| Param | Original file | Final file |
|---|---|---|
| Filename | modeM0/AS1A04_176T04_9000001964_13194cztM0_level2.evt | modeM0/AS1A04_176T04_9000001964_13194cztM0_level2_quad_clean.evt |
| Size (bytes) | 1,463,431,680 | 211,155,840 |
| Size | 1.4 GB | 201.4 MB |
| Events in quadrant A | 8,046,471 | 1,335,141 |
| Events in quadrant B | 10,732,972 | 1,319,147 |
| Events in quadrant C | 7,628,963 | 1,343,088 |
| Events in quadrant D | 16,755,192 | 1,215,913 |
| Mode M0 | |||
|---|---|---|---|
| Quadrant | BADHDUFLAG | Total packets | Discarded packets |
| A | 0 | 35308 | 3 |
| B | 0 | 43297 | 3 |
| C | 0 | 34947 | 3 |
| D | 0 | 61446 | 3 |
| Mode SS | |||
|---|---|---|---|
| Quadrant | BADHDUFLAG | Total packets | Discarded packets |
| A | 0 | 348 | 0 |
| B | 0 | 348 | 0 |
| C | 0 | 348 | 0 |
| D | 0 | 348 | 0 |
| Mode M9 | |||
|---|---|---|---|
| Quadrant | BADHDUFLAG | Total packets | Discarded packets |
| A | 0 | 13 | 0 |
| B | 0 | 12 | 0 |
| C | 0 | 12 | 0 |
| D | 0 | 13 | 0 |
| Quadrant | Total seconds | Saturated seconds | Saturation percentage |
|---|---|---|---|
| A | 17130 | 254 | 1.482779% |
| B | 17130 | 1133 | 6.614127% |
| C | 17130 | 199 | 1.161705% |
| D | 17130 | 2820 | 16.462347% |
Noise dominated data is calculated using 1-second bins in cleaned event files. If a bin has >2000 counts, and if more than 50% of those come from <1% of pixels, then it is considered to be noise-dominated and hence unusable.
| Quadrant | # 1 sec bins | Bins with >0 counts | Bins with >2000 counts | High rate bins dominated by noise | Noise dominated (total time) | Noise dominated (detector-on time) | Marked lightcurve |
|---|---|---|---|---|---|---|---|
| A | 18190 | 17132 | 1 | 1 | 0.01% | 0.01% | 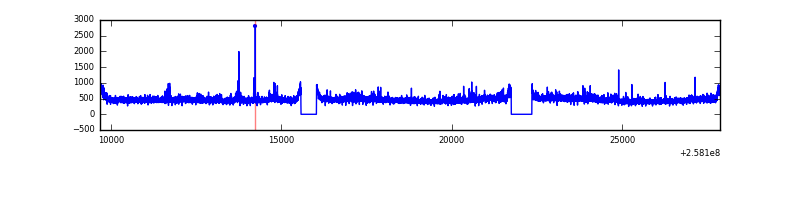 |
| B | 18190 | 17131 | 612 | 612 | 3.36% | 3.57% | 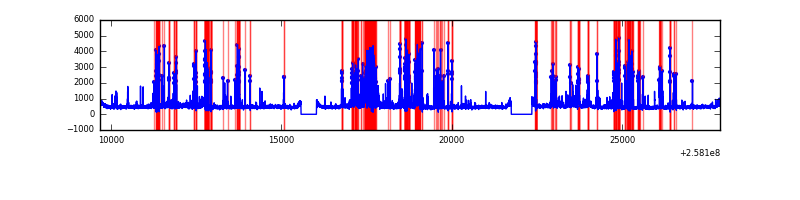 |
| C | 18190 | 17131 | 9 | 9 | 0.05% | 0.05% |  |
| D | 18190 | 17131 | 1961 | 1961 | 10.78% | 11.45% | 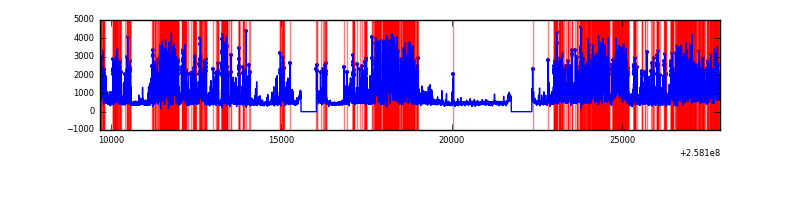 |
Top three noisy pixels from each quadrant. If the there are fewer than three noisy pixels in the level2.evt file, extra rows are filled as -1
| Pixel properties | Quadrant properties | ||||||
|---|---|---|---|---|---|---|---|
| Quadrant | DetID | PixID | Counts | Sigma | Mean | Median | Sigma |
| A | 8 | 15 | 242965 | 600.17 | 1982 | 1937 | 401.6 |
| A | 1 | 162 | 56303 | 135.37 | 1982 | 1937 | 401.6 |
| A | 12 | 189 | 40806 | 96.79 | 1982 | 1937 | 401.6 |
| B | 4 | 239 | 2139177 | 5755.94 | 1941 | 1888 | 371.3 |
| B | 0 | 189 | 550294 | 1476.91 | 1941 | 1888 | 371.3 |
| B | 3 | 64 | 159105 | 423.4 | 1941 | 1888 | 371.3 |
| C | 15 | 208 | 71782 | 156.25 | 1933 | 1943 | 447.0 |
| C | 13 | 61 | 14268 | 27.57 | 1933 | 1943 | 447.0 |
| C | 8 | 128 | 11071 | 20.42 | 1933 | 1943 | 447.0 |
| D | 13 | 122 | 9353221 | 21547.97 | 1806 | 1756 | 434.0 |
| D | 1 | 52 | 329963 | 756.27 | 1806 | 1756 | 434.0 |
| D | 2 | 234 | 80921 | 182.41 | 1806 | 1756 | 434.0 |
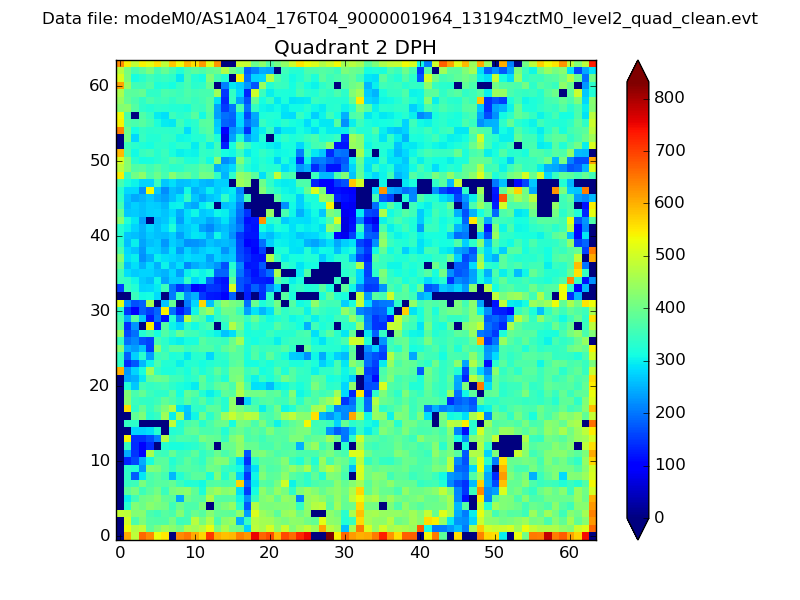
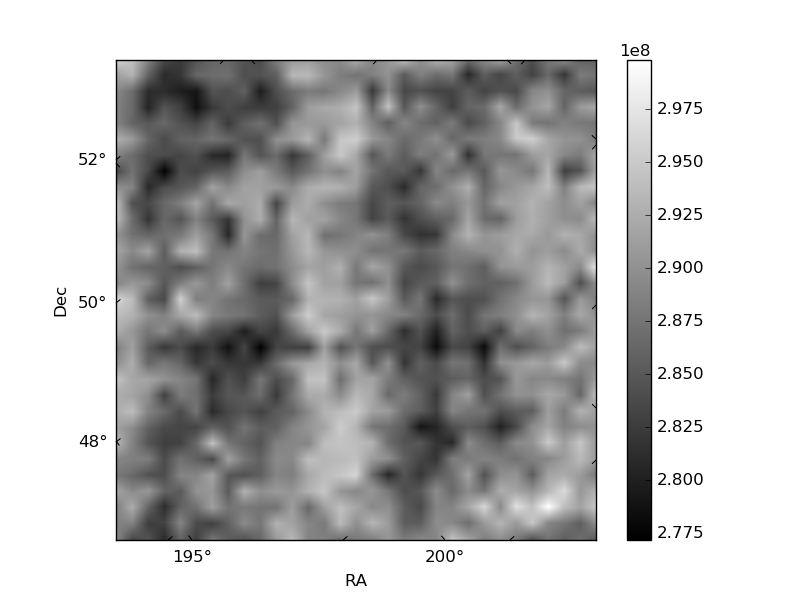
Histogram calculated using DETX and DETY for each event in the final _common_clean file
| Quadrant A | 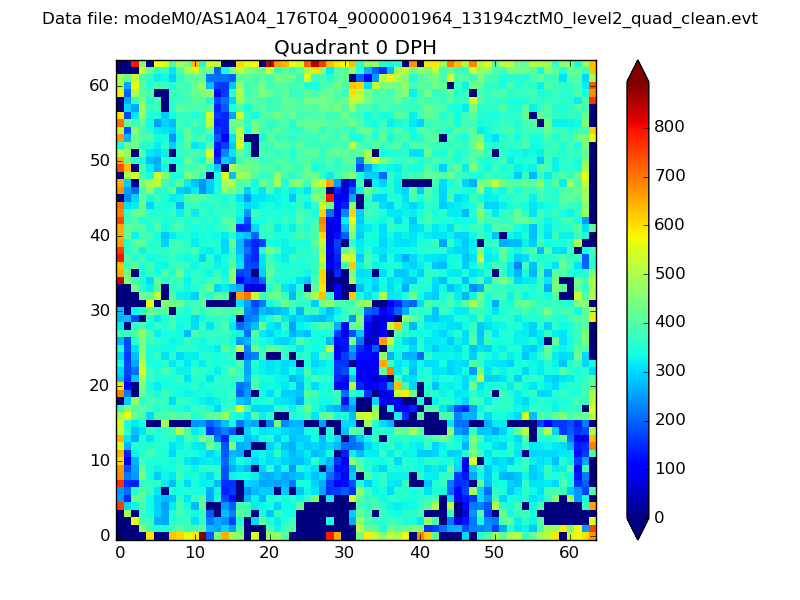 |
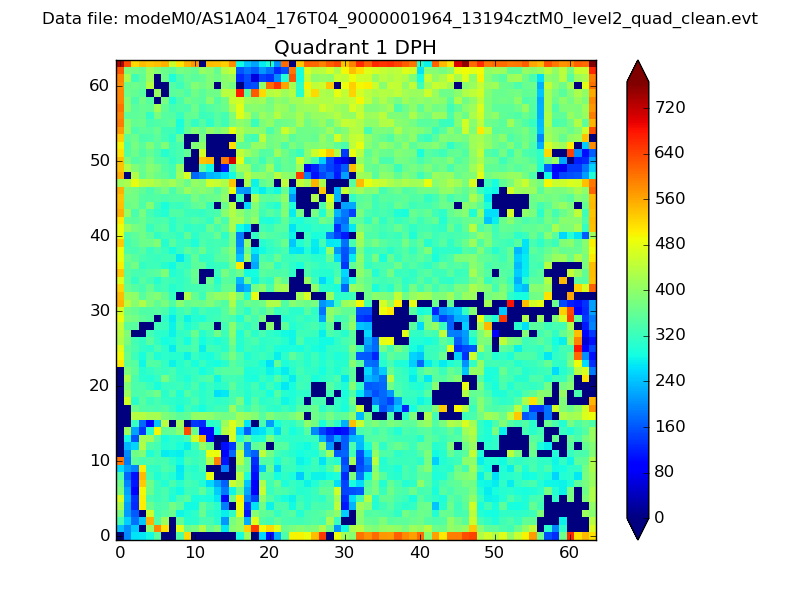 |
Quadrant B |
|---|---|---|---|
| Quadrant D | 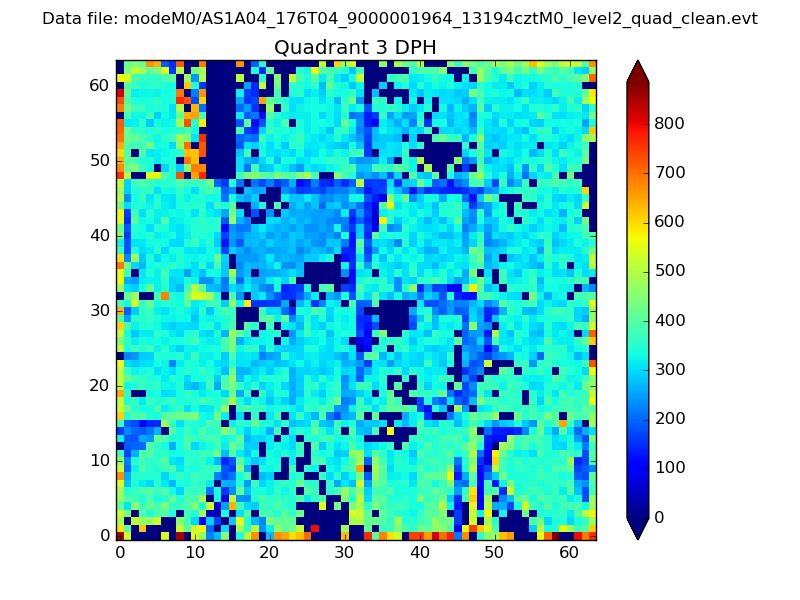 |
 |
Quadrant C |
| Plot type | Count rate plots | Images |
|---|---|---|
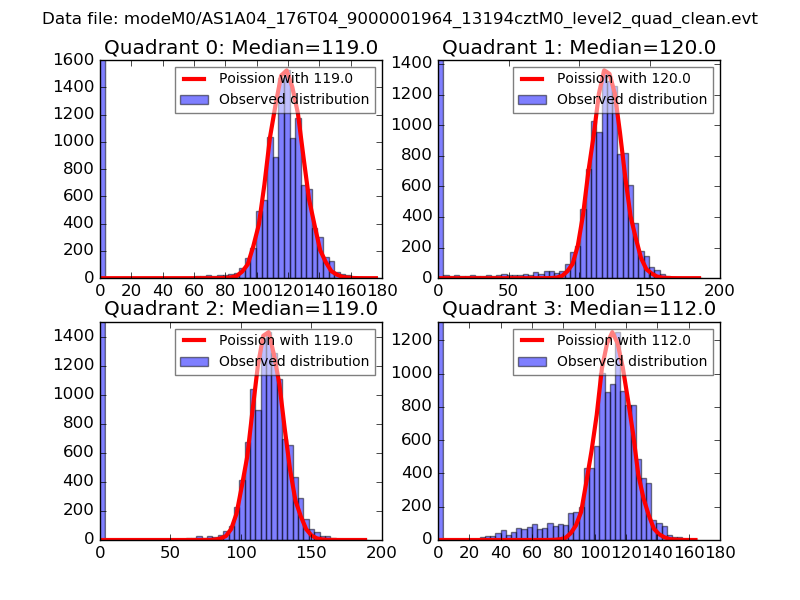
| Comparison with Poisson distribution Blue bars denote a histogram of data divided into 1 sec bins. Red curve is a Poisson curve with rate = median count rate of data. |
 |
 |
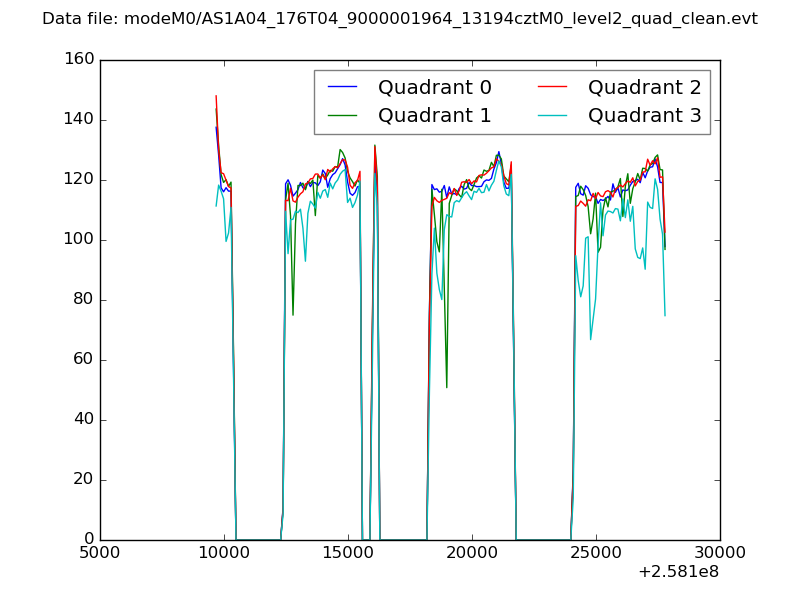
| Quadrant-wise count rates Data is divided into 100 sec bins |
 |
|
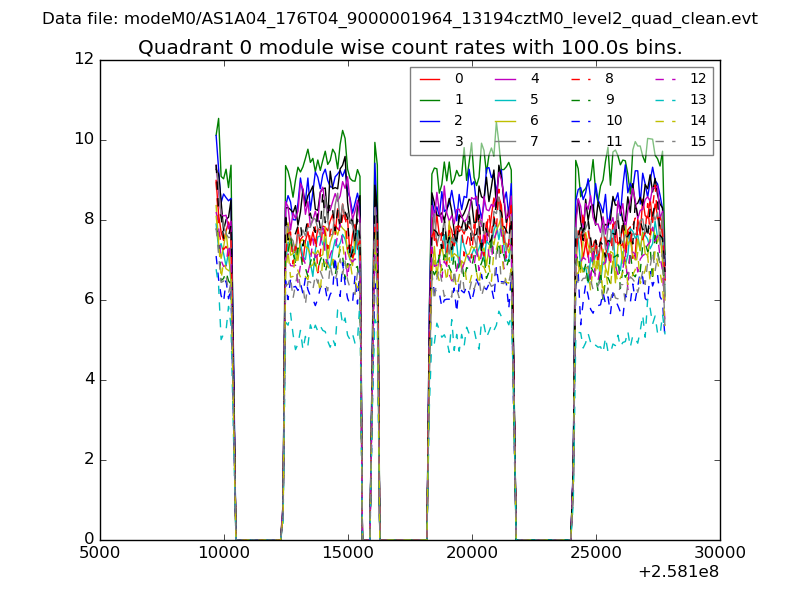
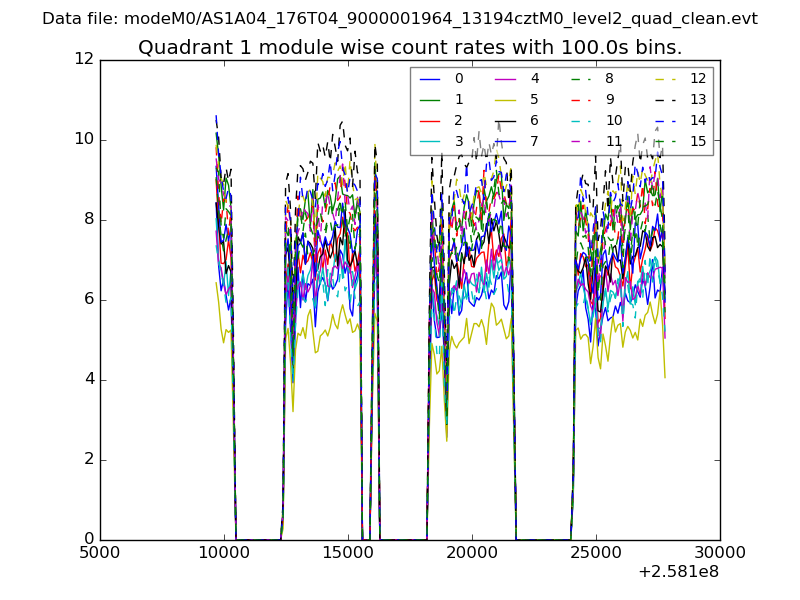
| Module-wise count rates for Quadrant A Data is divided into 100 sec bins |
 |
 |
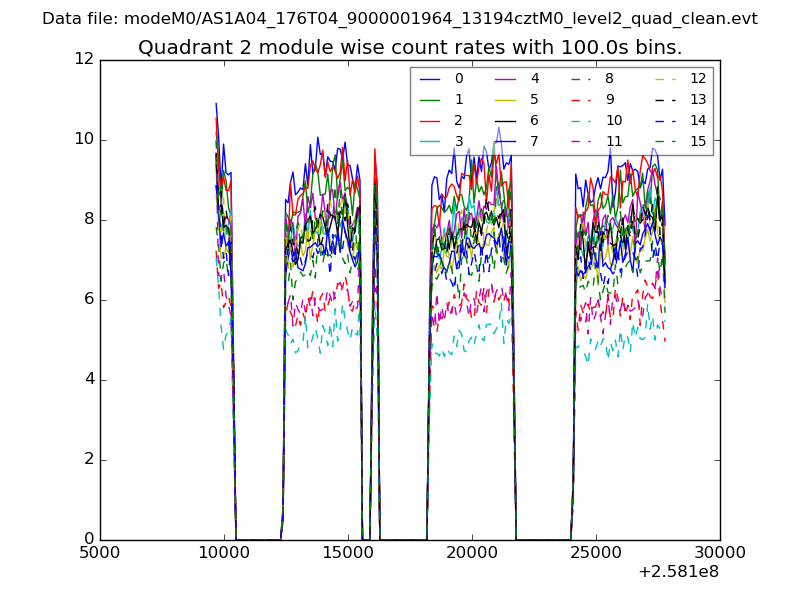
| Module-wise count rates for Quadrant B Data is divided into 100 sec bins |
 |
 |
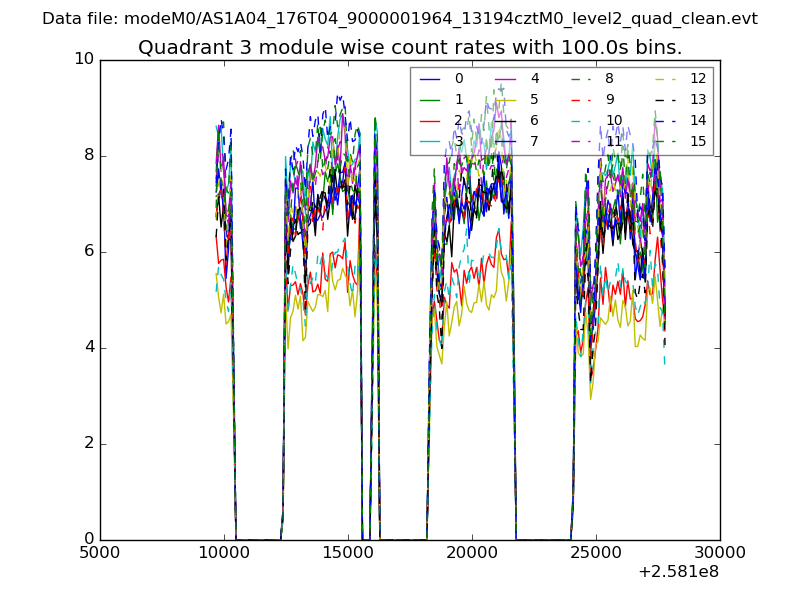
| Module-wise count rates for Quadrant C Data is divided into 100 sec bins |
 |
 |
| Module-wise count rates for Quadrant D Data is divided into 100 sec bins |
 |
 |
| Parameter | Plot |
|---|---|
| CZT HV Monitor | 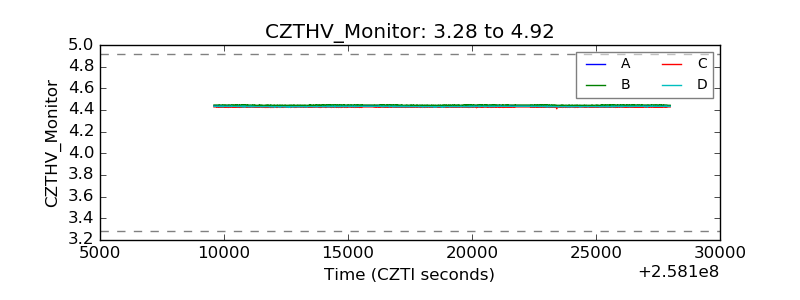 |
| D_VDD | 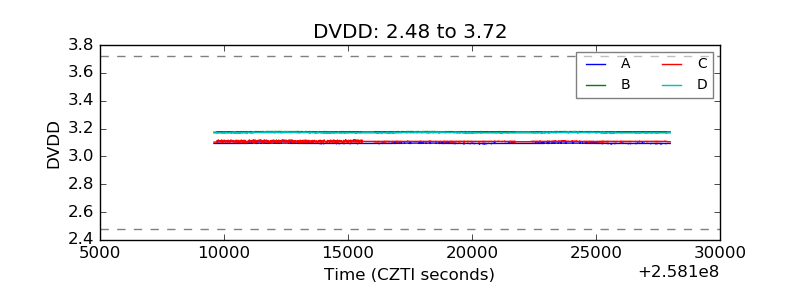 |
| Temperature 1 |  |
| Veto HV Monitor | 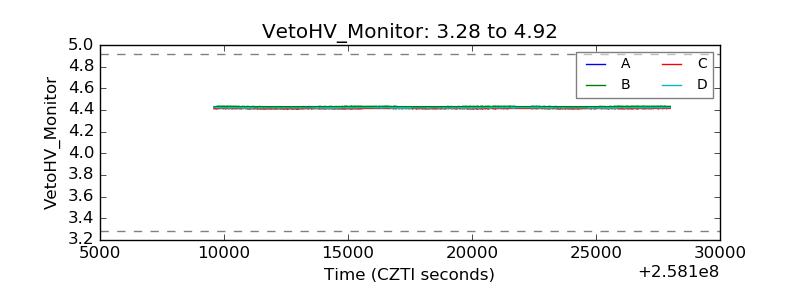 |
| Veto LLD | 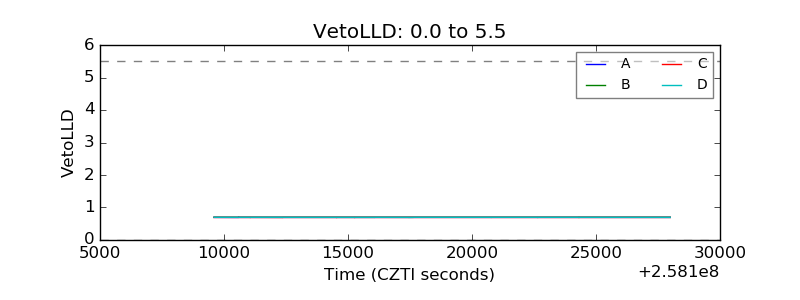 |
| Alpha Counter | 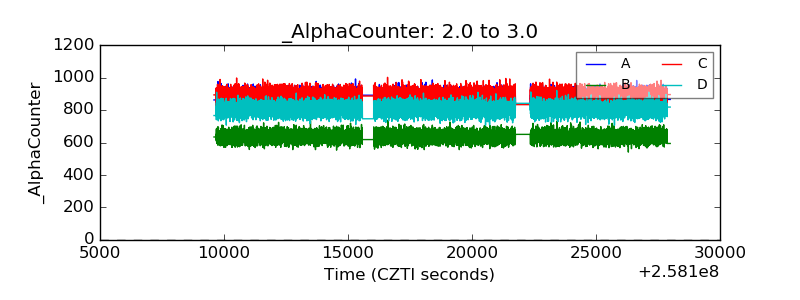 |
| _CPM_Rate |  |
| CZT Counter | 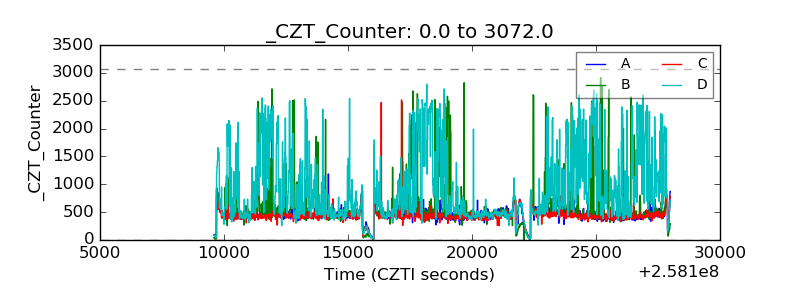 |
| +2.5 Volts monitor |  |
| +5 Volts monitor | 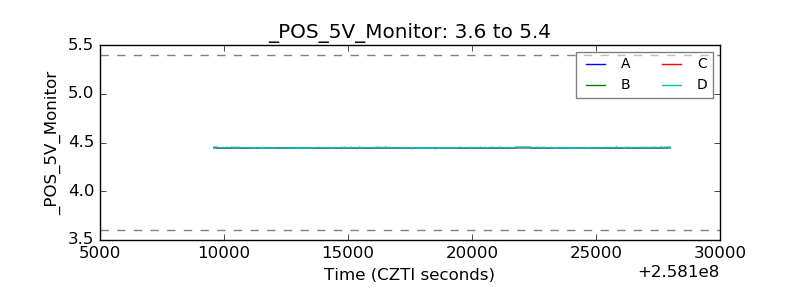 |
| _ROLL_ROT | 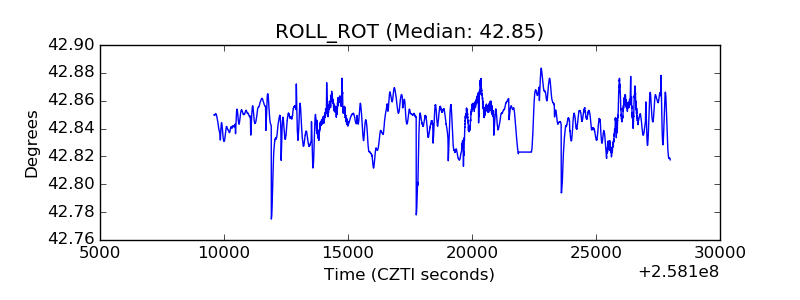 |
| _Roll_DEC | 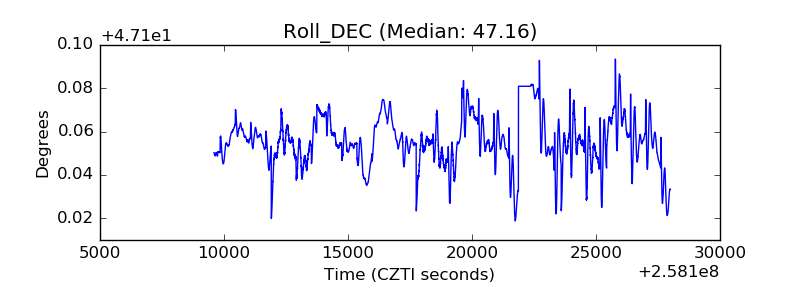 |
| _Roll_RA | 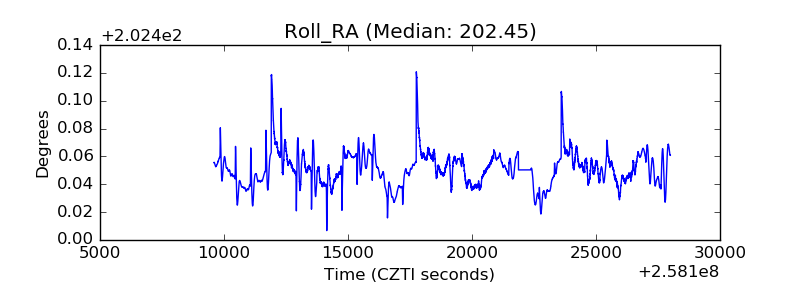 |
| Veto Counter | 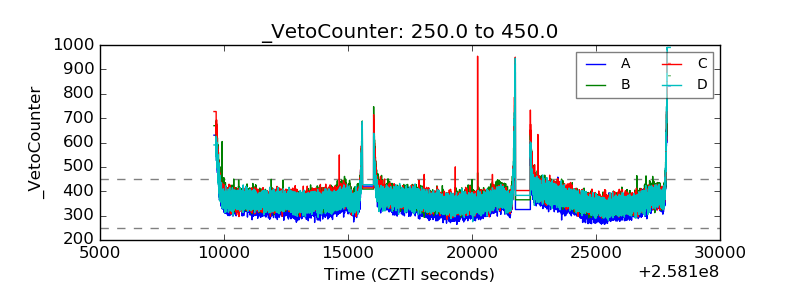 |