| Param | Original file | Final file |
|---|---|---|
| Filename | modeM0/AS1A04_176T04_9000001964_13195cztM0_level2.evt | modeM0/AS1A04_176T04_9000001964_13195cztM0_level2_quad_clean.evt |
| Size (bytes) | 538,784,640 | 86,463,360 |
| Size | 513.8 MB | 82.5 MB |
| Events in quadrant A | 3,290,418 | 542,797 |
| Events in quadrant B | 4,623,849 | 526,161 |
| Events in quadrant C | 3,215,248 | 546,516 |
| Events in quadrant D | 4,716,221 | 518,783 |
| Mode M0 | |||
|---|---|---|---|
| Quadrant | BADHDUFLAG | Total packets | Discarded packets |
| A | 0 | 14441 | 3 |
| B | 0 | 18338 | 2 |
| C | 0 | 14268 | 2 |
| D | 0 | 18914 | 2 |
| Mode SS | |||
|---|---|---|---|
| Quadrant | BADHDUFLAG | Total packets | Discarded packets |
| A | 0 | 142 | 0 |
| B | 0 | 142 | 0 |
| C | 0 | 142 | 0 |
| D | 0 | 142 | 0 |
| Mode M9 | |||
|---|---|---|---|
| Quadrant | BADHDUFLAG | Total packets | Discarded packets |
| A | 0 | 18 | 0 |
| B | 0 | 18 | 0 |
| C | 0 | 18 | 0 |
| D | 0 | 18 | 0 |
| Quadrant | Total seconds | Saturated seconds | Saturation percentage |
|---|---|---|---|
| A | 6947 | 109 | 1.569023% |
| B | 6947 | 635 | 9.140636% |
| C | 6947 | 99 | 1.425076% |
| D | 6947 | 408 | 5.873039% |
Noise dominated data is calculated using 1-second bins in cleaned event files. If a bin has >2000 counts, and if more than 50% of those come from <1% of pixels, then it is considered to be noise-dominated and hence unusable.
| Quadrant | # 1 sec bins | Bins with >0 counts | Bins with >2000 counts | High rate bins dominated by noise | Noise dominated (total time) | Noise dominated (detector-on time) | Marked lightcurve |
|---|---|---|---|---|---|---|---|
| A | 8728 | 6949 | 0 | 0 | 0.00% | 0.00% | 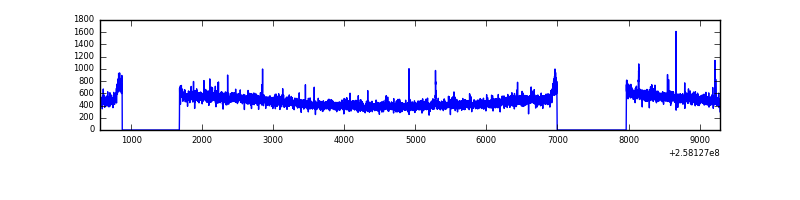 |
| B | 8728 | 6949 | 332 | 332 | 3.80% | 4.78% | 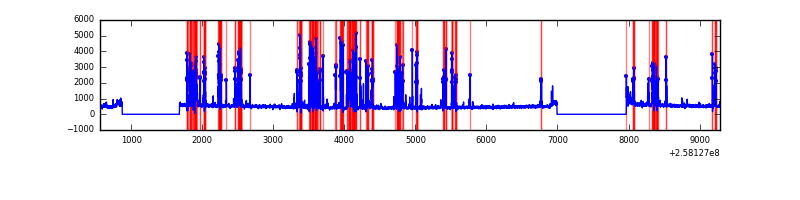 |
| C | 8728 | 6949 | 1 | 1 | 0.01% | 0.01% | 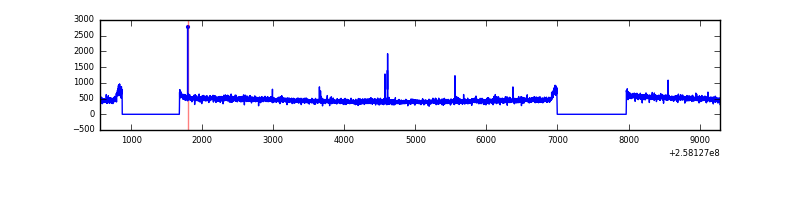 |
| D | 8728 | 6949 | 202 | 202 | 2.31% | 2.91% | 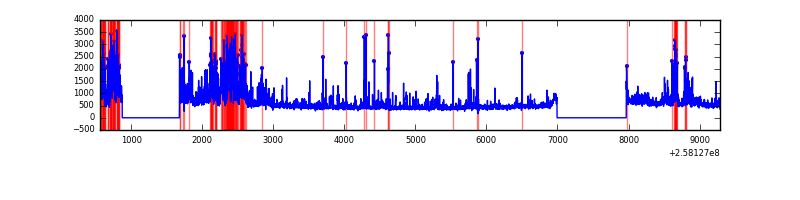 |
Top three noisy pixels from each quadrant. If the there are fewer than three noisy pixels in the level2.evt file, extra rows are filled as -1
| Pixel properties | Quadrant properties | ||||||
|---|---|---|---|---|---|---|---|
| Quadrant | DetID | PixID | Counts | Sigma | Mean | Median | Sigma |
| A | 8 | 15 | 30208 | 170.57 | 840 | 820 | 172.3 |
| A | 4 | 2 | 12388 | 67.14 | 840 | 820 | 172.3 |
| A | 1 | 162 | 8243 | 43.08 | 840 | 820 | 172.3 |
| B | 4 | 239 | 1108534 | 7202.91 | 808 | 790 | 153.8 |
| B | 3 | 64 | 265132 | 1718.84 | 808 | 790 | 153.8 |
| B | 0 | 197 | 34321 | 218.03 | 808 | 790 | 153.8 |
| C | 15 | 208 | 17338 | 87.43 | 819 | 824 | 188.9 |
| C | 13 | 61 | 5915 | 26.95 | 819 | 824 | 188.9 |
| C | 8 | 222 | 4050 | 17.08 | 819 | 824 | 188.9 |
| D | 13 | 122 | 1308085 | 6784.05 | 804 | 779 | 192.7 |
| D | 1 | 52 | 212815 | 1100.33 | 804 | 779 | 192.7 |
| D | 2 | 69 | 37814 | 192.19 | 804 | 779 | 192.7 |
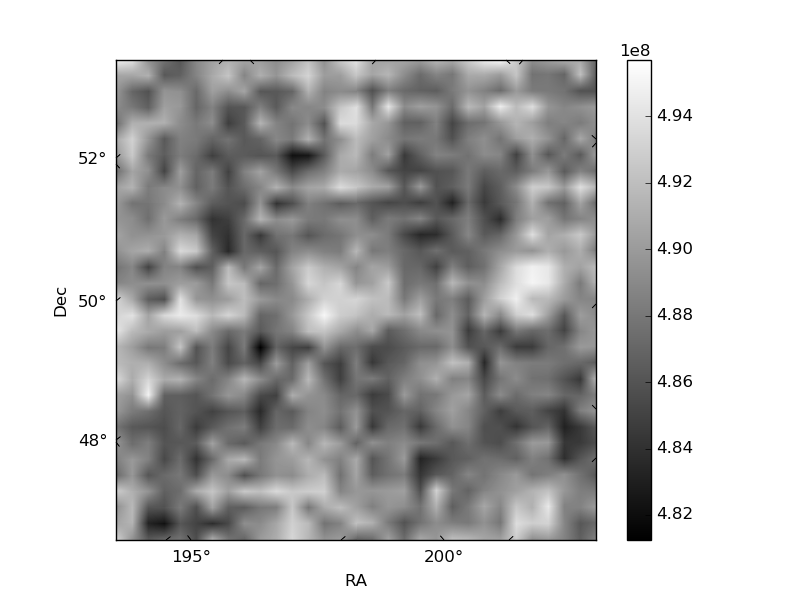
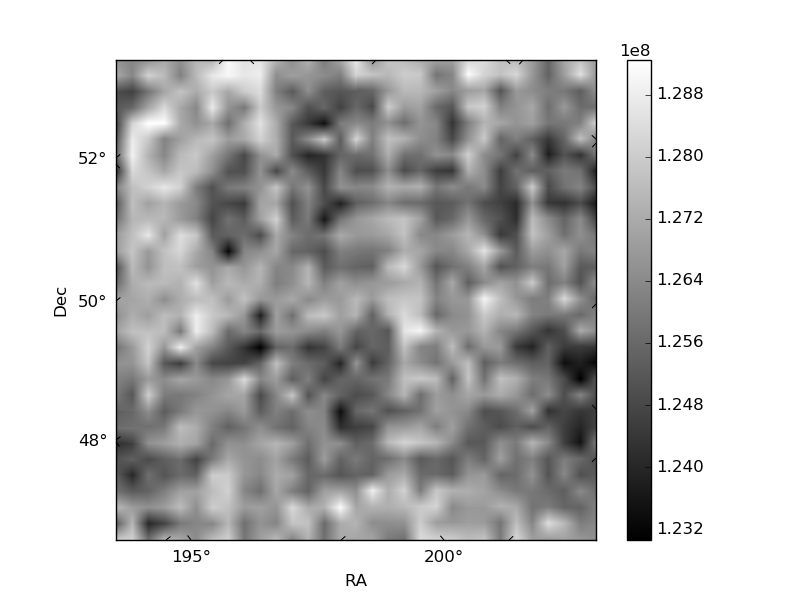
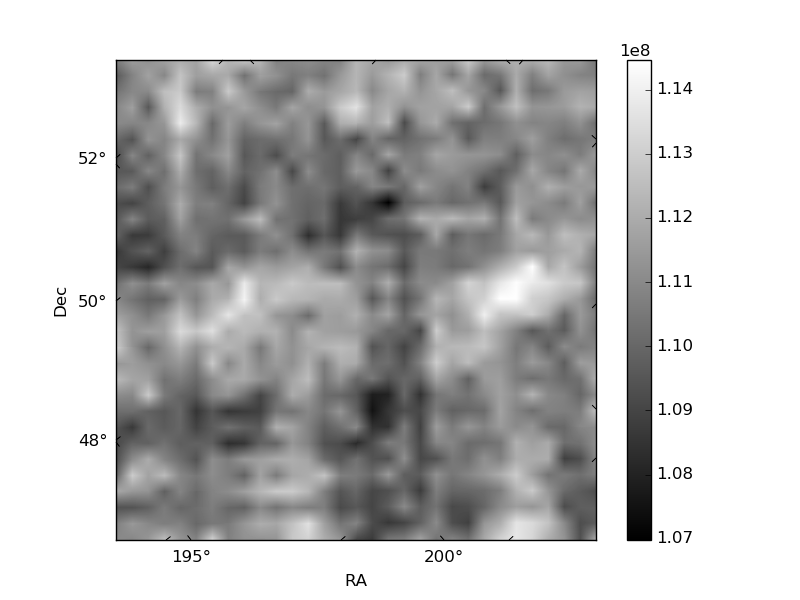
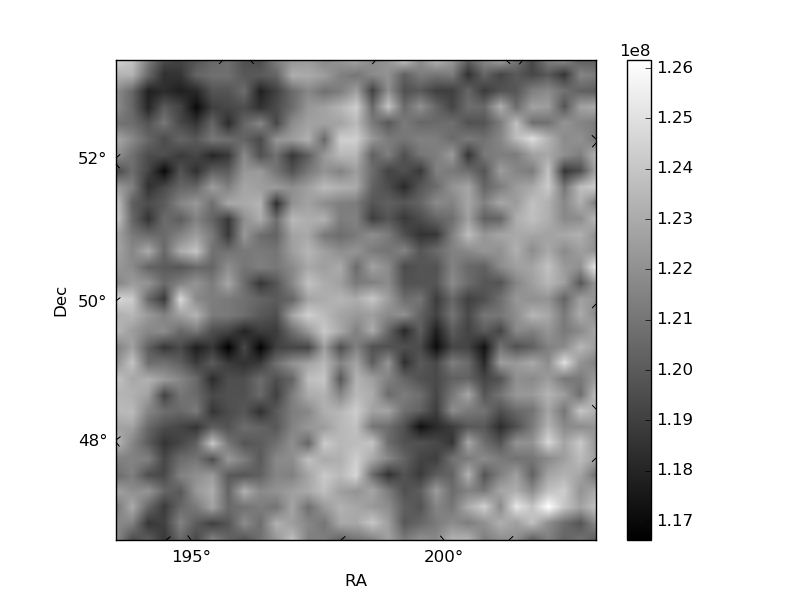
Histogram calculated using DETX and DETY for each event in the final _common_clean file
| Quadrant A | 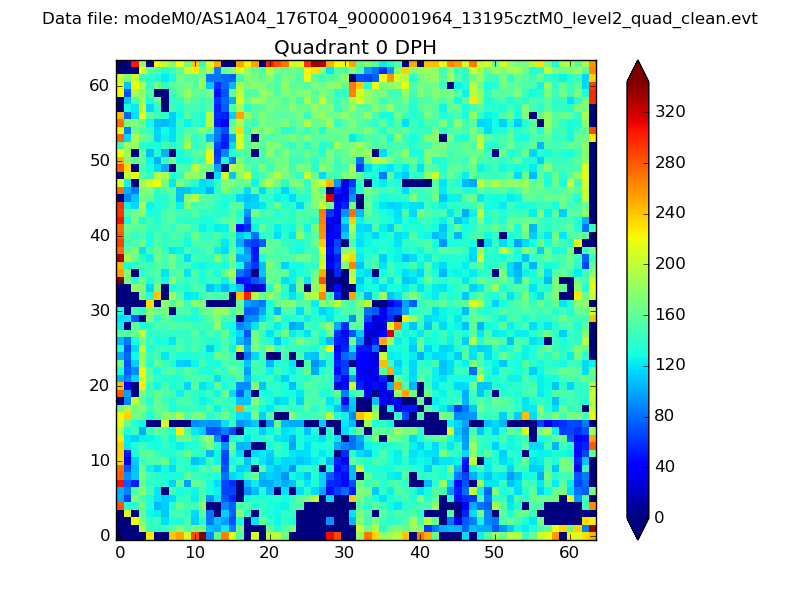 |
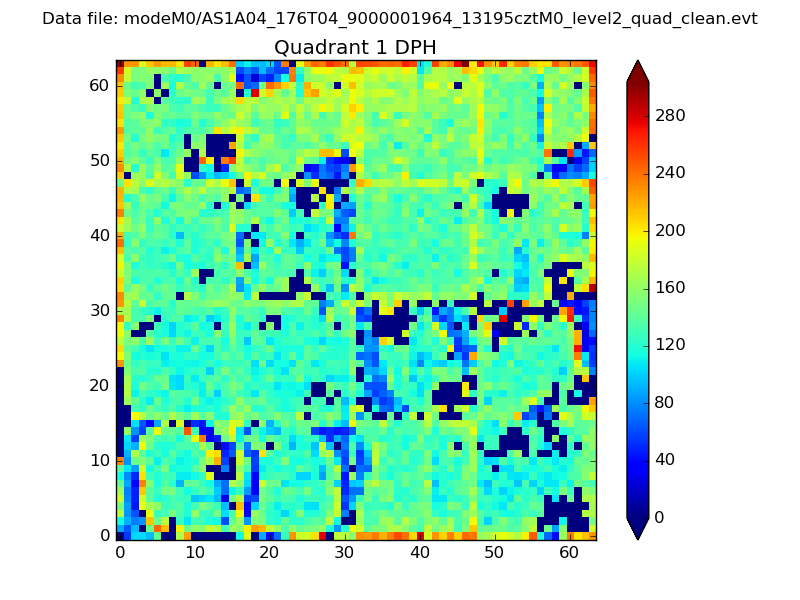 |
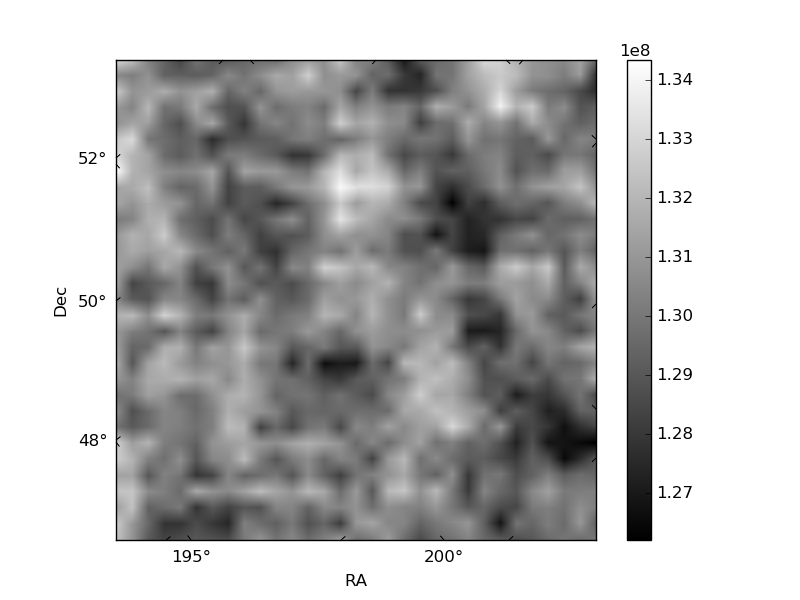
Quadrant B |
|---|---|---|---|
| Quadrant D | 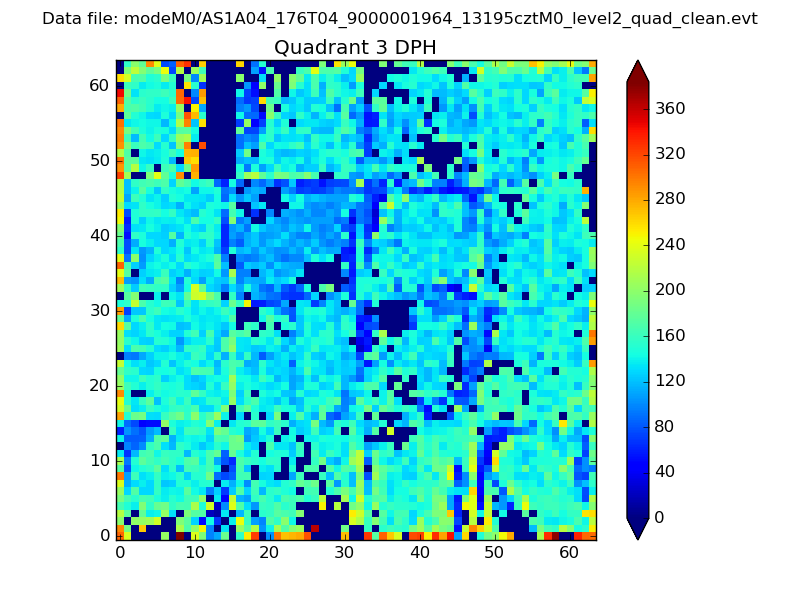 |
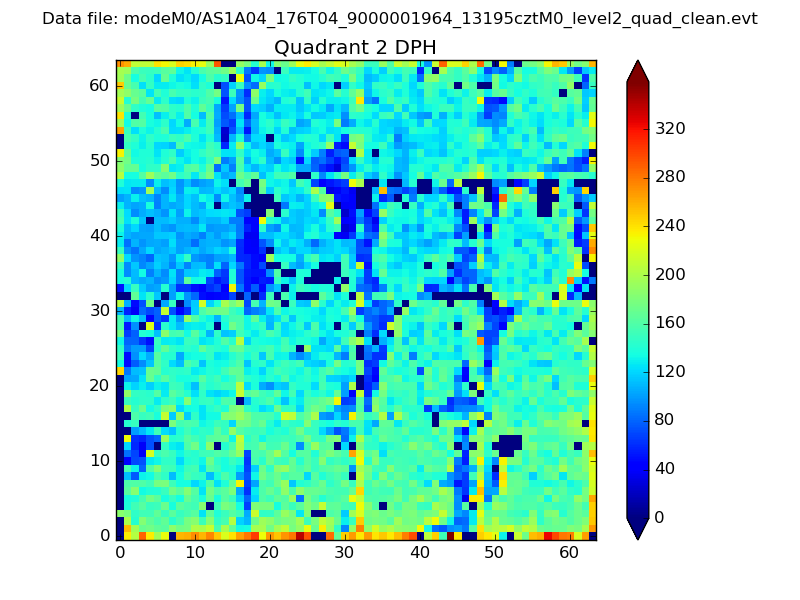 |
Quadrant C |
| Plot type | Count rate plots | Images |
|---|---|---|
| Comparison with Poisson distribution Blue bars denote a histogram of data divided into 1 sec bins. Red curve is a Poisson curve with rate = median count rate of data. |
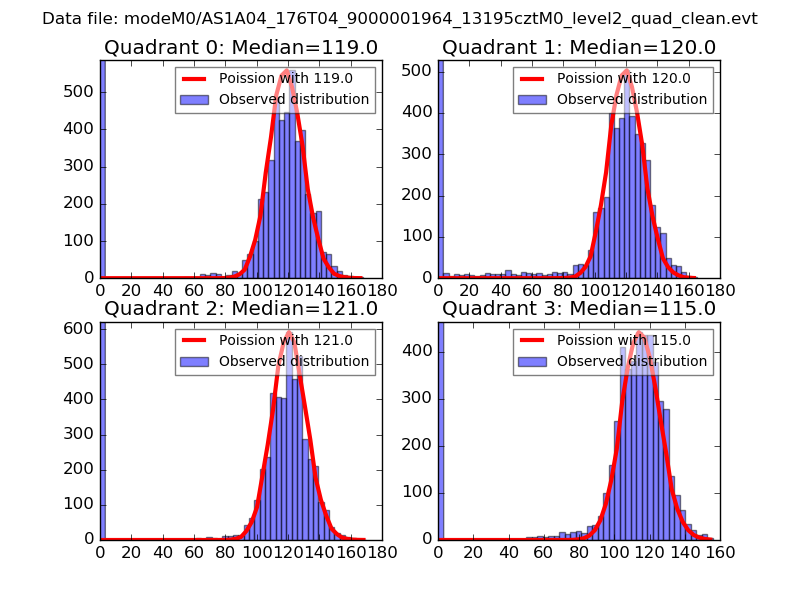 |
 |
| Quadrant-wise count rates Data is divided into 100 sec bins |
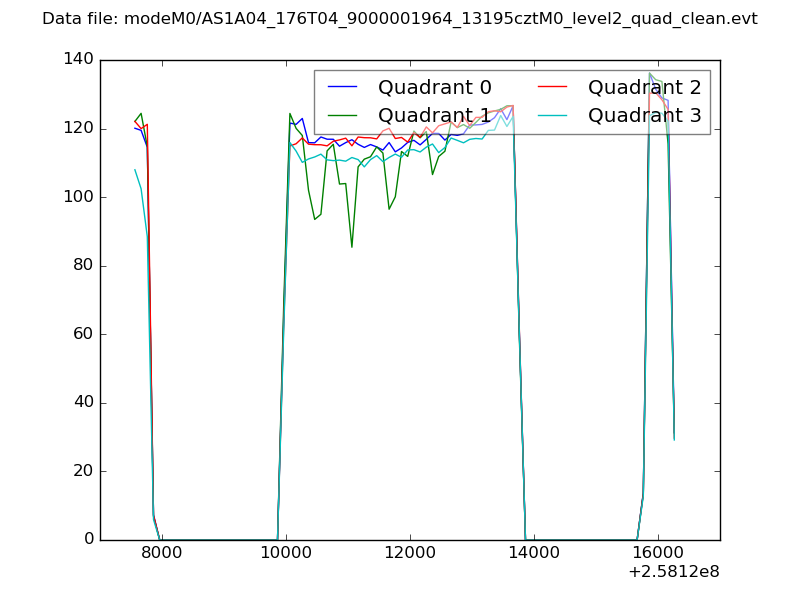 |
|
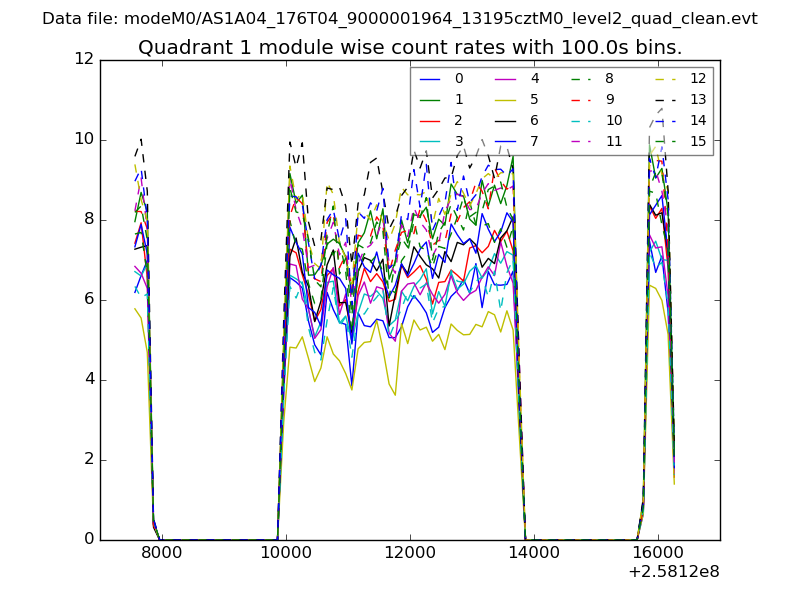
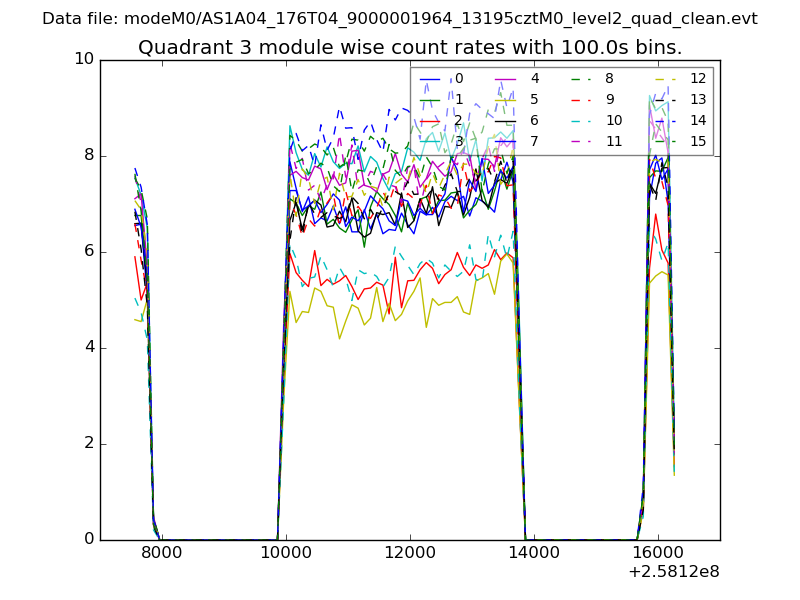
| Module-wise count rates for Quadrant A Data is divided into 100 sec bins |
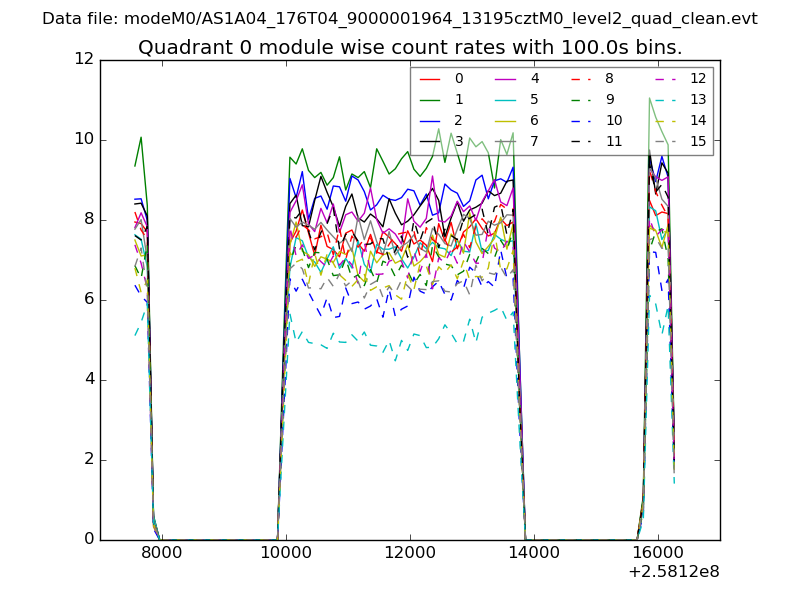 |
 |
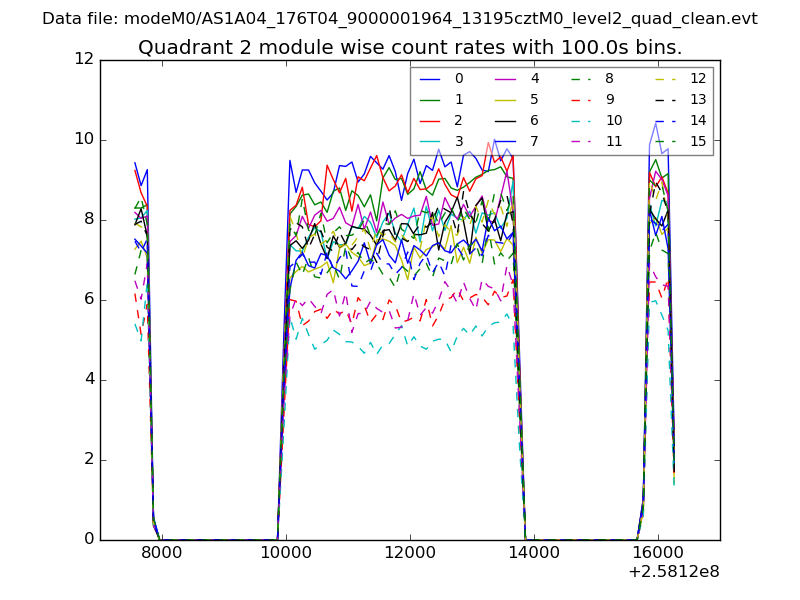
| Module-wise count rates for Quadrant B Data is divided into 100 sec bins |
 |
 |
| Module-wise count rates for Quadrant C Data is divided into 100 sec bins |
 |
 |
| Module-wise count rates for Quadrant D Data is divided into 100 sec bins |
 |
 |
| Parameter | Plot |
|---|---|
| CZT HV Monitor | 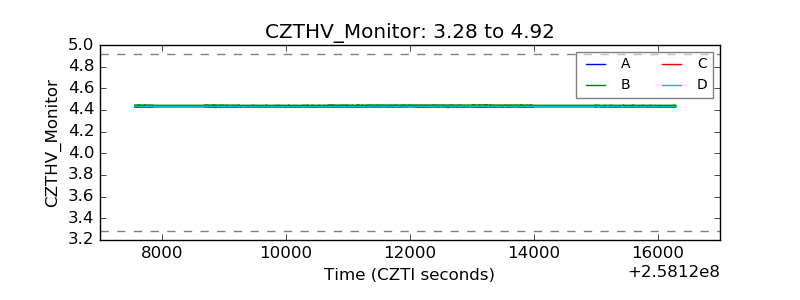 |
| D_VDD | 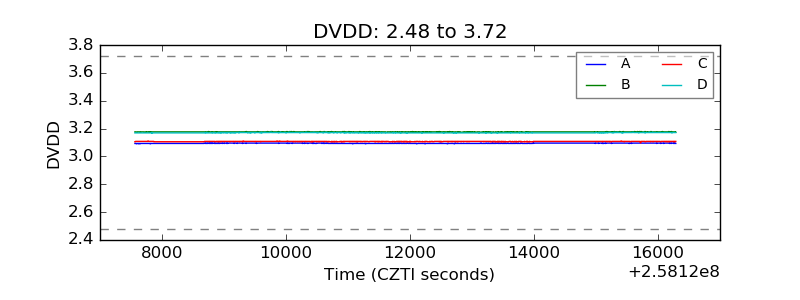 |
| Temperature 1 | 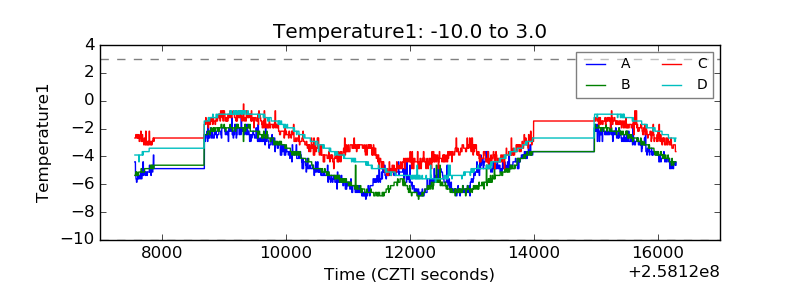 |
| Veto HV Monitor | 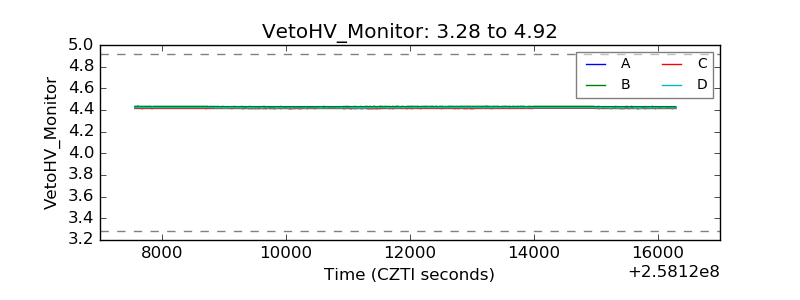 |
| Veto LLD | 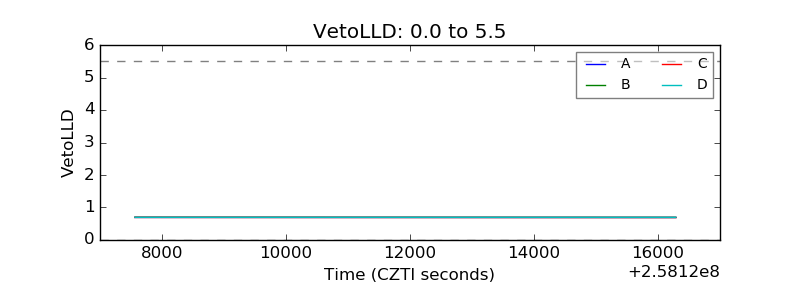 |
| Alpha Counter | 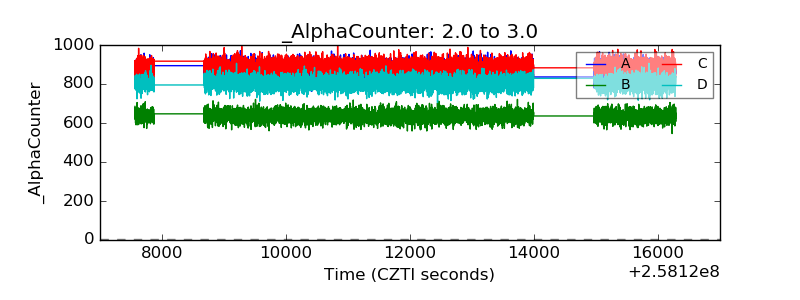 |
| _CPM_Rate | 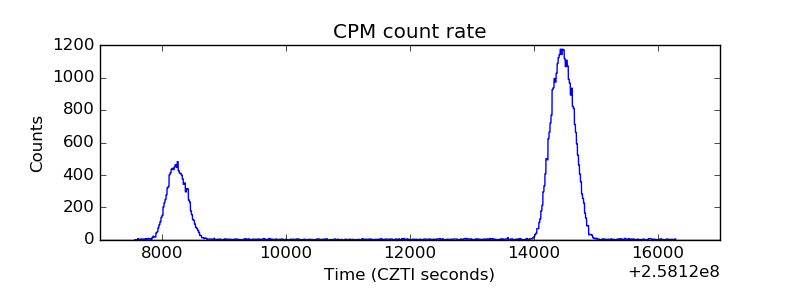 |
| CZT Counter | 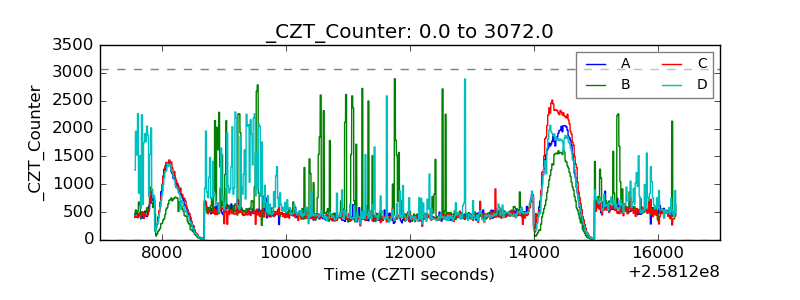 |
| +2.5 Volts monitor | 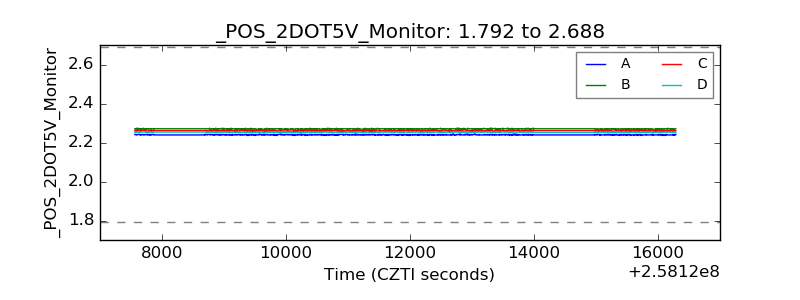 |
| +5 Volts monitor | 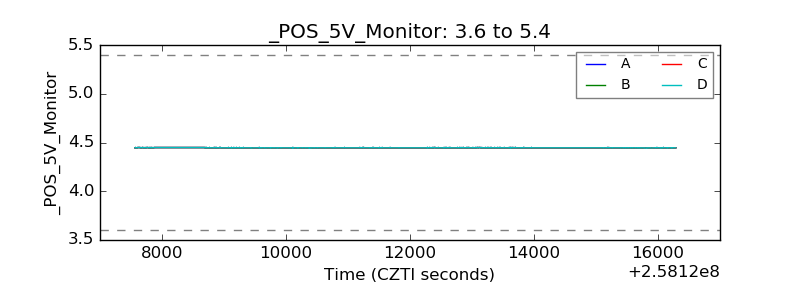 |
| _ROLL_ROT | 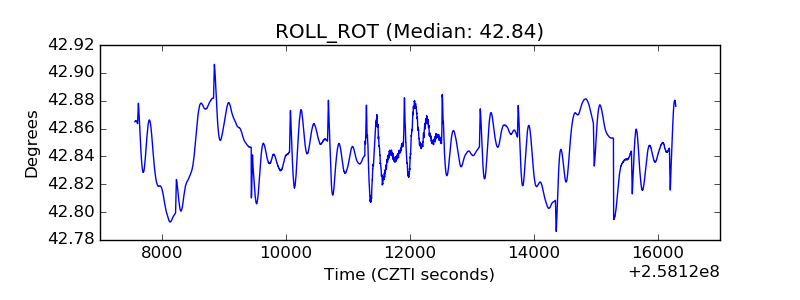 |
| _Roll_DEC | 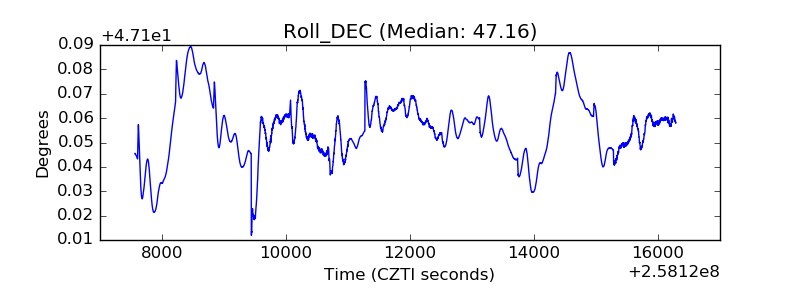 |
| _Roll_RA | 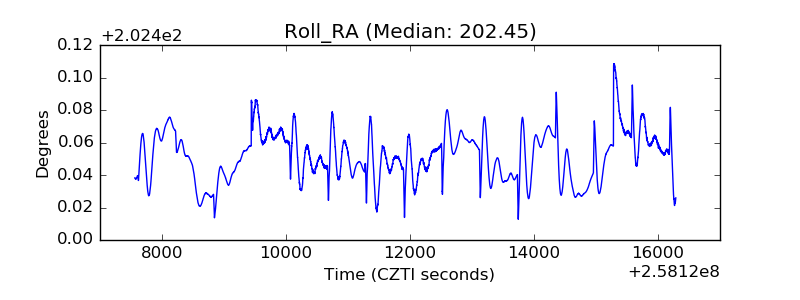 |
| Veto Counter | 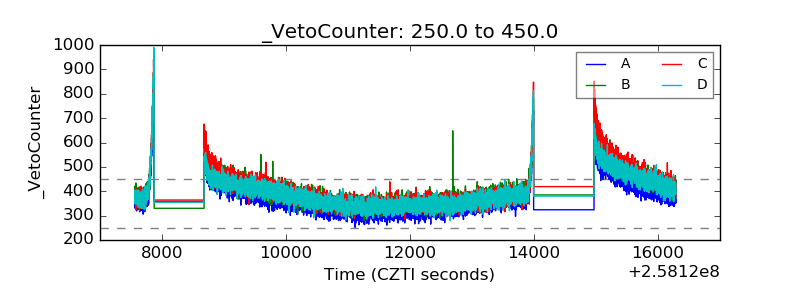 |