| Param | Original file | Final file |
|---|---|---|
| Filename | modeM0/AS1A04_176T04_9000001964_13371cztM0_level2.evt | modeM0/AS1A04_176T04_9000001964_13371cztM0_level2_quad_clean.evt |
| Size (bytes) | 374,008,320 | 63,290,880 |
| Size | 356.7 MB | 60.4 MB |
| Events in quadrant A | 2,420,982 | 395,455 |
| Events in quadrant B | 2,583,275 | 407,748 |
| Events in quadrant C | 2,402,689 | 400,139 |
| Events in quadrant D | 3,588,064 | 370,806 |
| Mode M0 | |||
|---|---|---|---|
| Quadrant | BADHDUFLAG | Total packets | Discarded packets |
| A | 0 | 10484 | 2 |
| B | 0 | 10844 | 1 |
| C | 0 | 10440 | 1 |
| D | 0 | 13927 | 1 |
| Mode SS | |||
|---|---|---|---|
| Quadrant | BADHDUFLAG | Total packets | Discarded packets |
| A | 0 | 100 | 0 |
| B | 0 | 100 | 0 |
| C | 0 | 100 | 0 |
| D | 0 | 100 | 0 |
| Mode M9 | |||
|---|---|---|---|
| Quadrant | BADHDUFLAG | Total packets | Discarded packets |
| A | 0 | 11 | 0 |
| B | 0 | 11 | 0 |
| C | 0 | 11 | 0 |
| D | 0 | 11 | 0 |
| Quadrant | Total seconds | Saturated seconds | Saturation percentage |
|---|---|---|---|
| A | 4874 | 77 | 1.579811% |
| B | 4874 | 87 | 1.784982% |
| C | 4874 | 59 | 1.210505% |
| D | 4874 | 180 | 3.693065% |
Noise dominated data is calculated using 1-second bins in cleaned event files. If a bin has >2000 counts, and if more than 50% of those come from <1% of pixels, then it is considered to be noise-dominated and hence unusable.
| Quadrant | # 1 sec bins | Bins with >0 counts | Bins with >2000 counts | High rate bins dominated by noise | Noise dominated (total time) | Noise dominated (detector-on time) | Marked lightcurve |
|---|---|---|---|---|---|---|---|
| A | 5960 | 4875 | 3 | 3 | 0.05% | 0.06% | 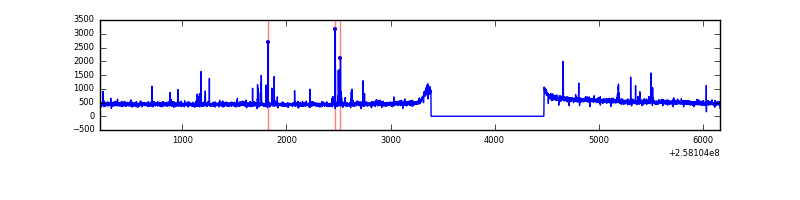 |
| B | 5960 | 4875 | 14 | 14 | 0.23% | 0.29% |  |
| C | 5960 | 4876 | 0 | 0 | 0.00% | 0.00% | 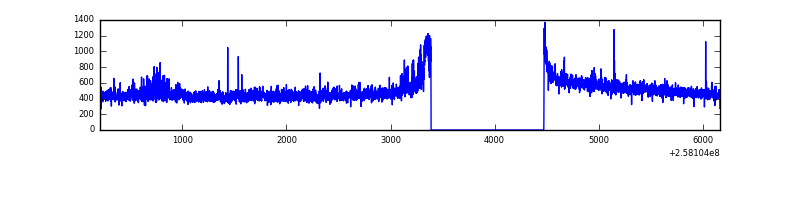 |
| D | 5960 | 4875 | 90 | 90 | 1.51% | 1.85% | 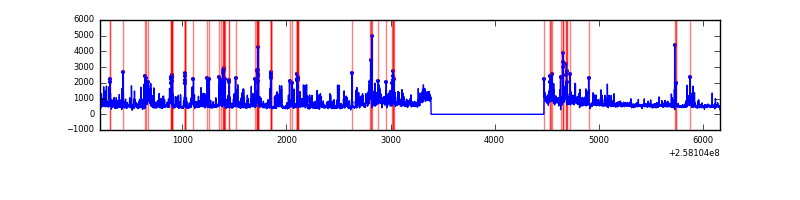 |
Top three noisy pixels from each quadrant. If the there are fewer than three noisy pixels in the level2.evt file, extra rows are filled as -1
| Pixel properties | Quadrant properties | ||||||
|---|---|---|---|---|---|---|---|
| Quadrant | DetID | PixID | Counts | Sigma | Mean | Median | Sigma |
| A | 9 | 143 | 71931 | 578.83 | 605 | 590 | 123.2 |
| A | 1 | 162 | 10303 | 78.81 | 605 | 590 | 123.2 |
| A | 15 | 69 | 6153 | 45.14 | 605 | 590 | 123.2 |
| B | 3 | 64 | 88151 | 762.28 | 605 | 591 | 114.9 |
| B | 4 | 142 | 34903 | 298.71 | 605 | 591 | 114.9 |
| B | 0 | 230 | 28693 | 244.65 | 605 | 591 | 114.9 |
| C | 14 | 220 | 74730 | 547.6 | 586 | 591 | 135.4 |
| C | 3 | 233 | 40404 | 294.06 | 586 | 591 | 135.4 |
| C | 13 | 61 | 4232 | 26.89 | 586 | 591 | 135.4 |
| D | 1 | 52 | 805454 | 5797.12 | 575 | 558 | 138.8 |
| D | 14 | 34 | 304270 | 2187.43 | 575 | 558 | 138.8 |
| D | 8 | 195 | 141446 | 1014.72 | 575 | 558 | 138.8 |
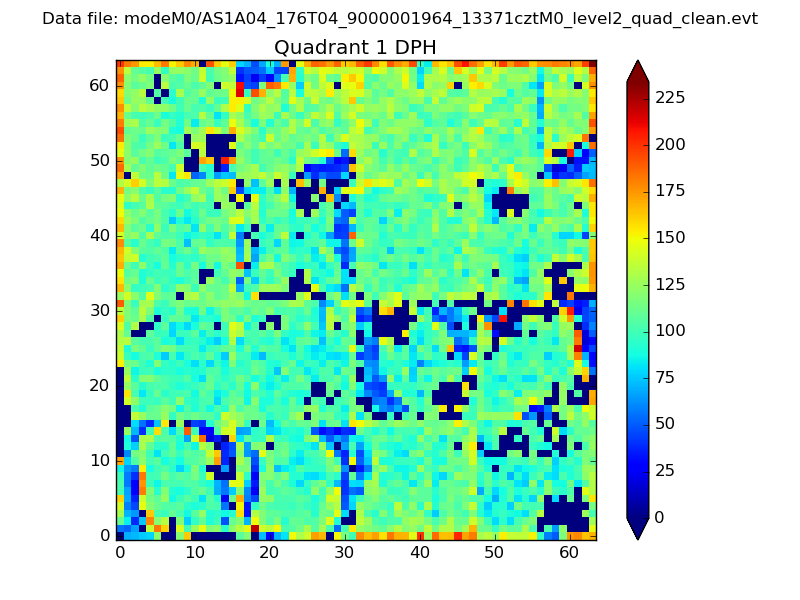
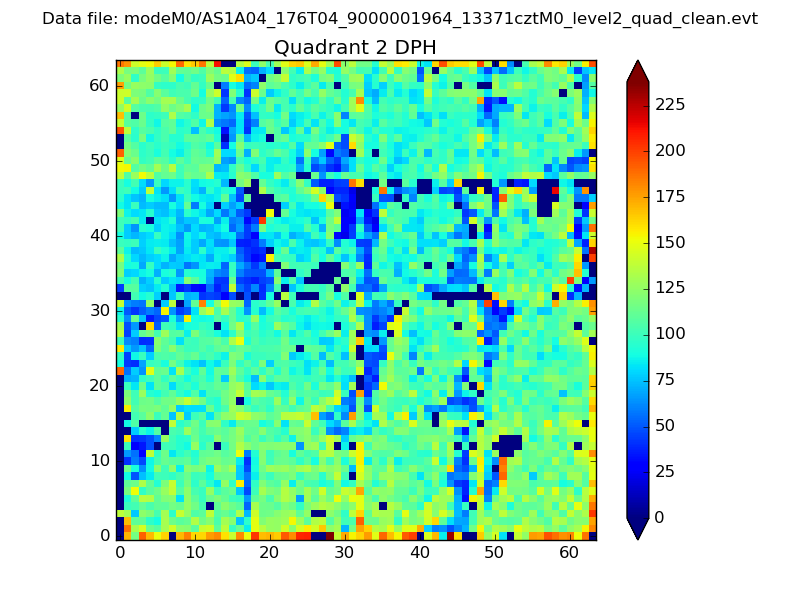
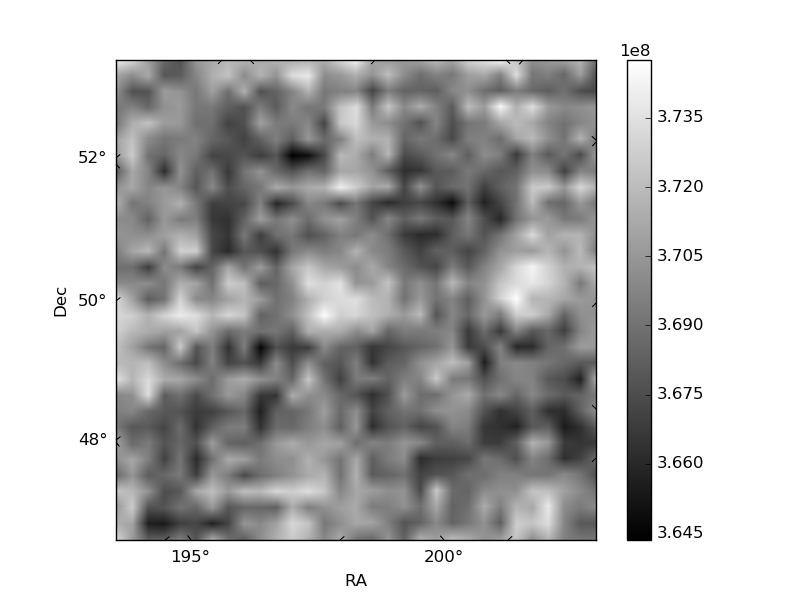
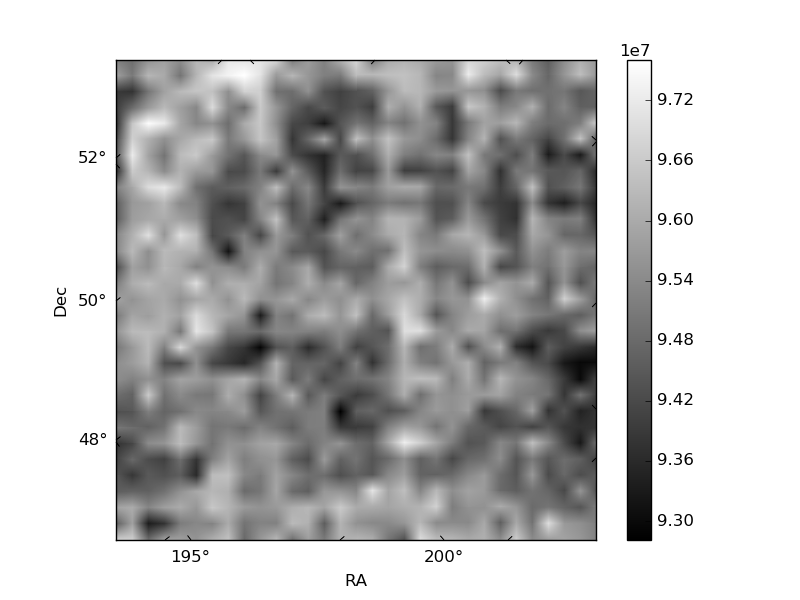
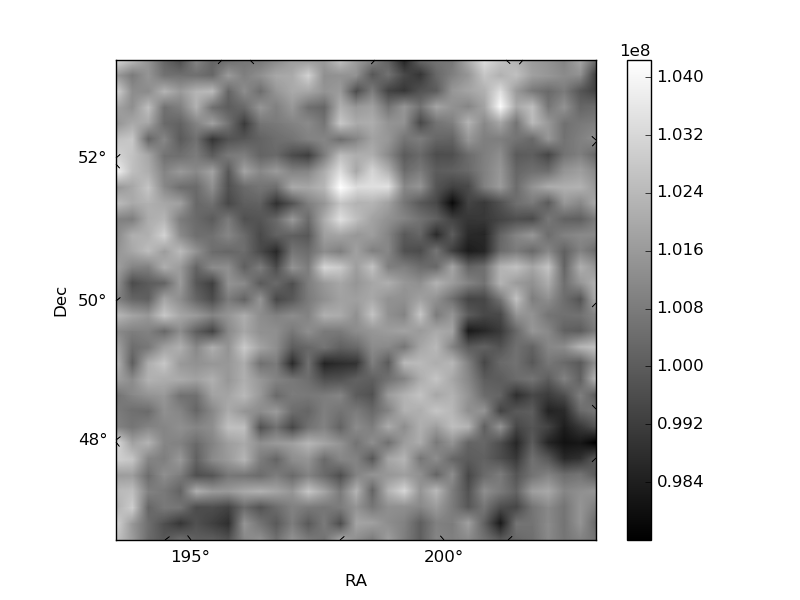
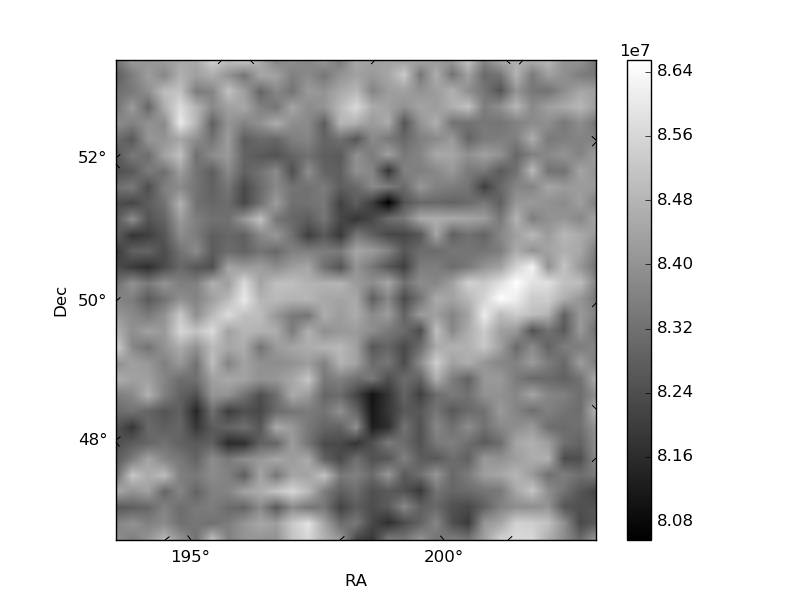
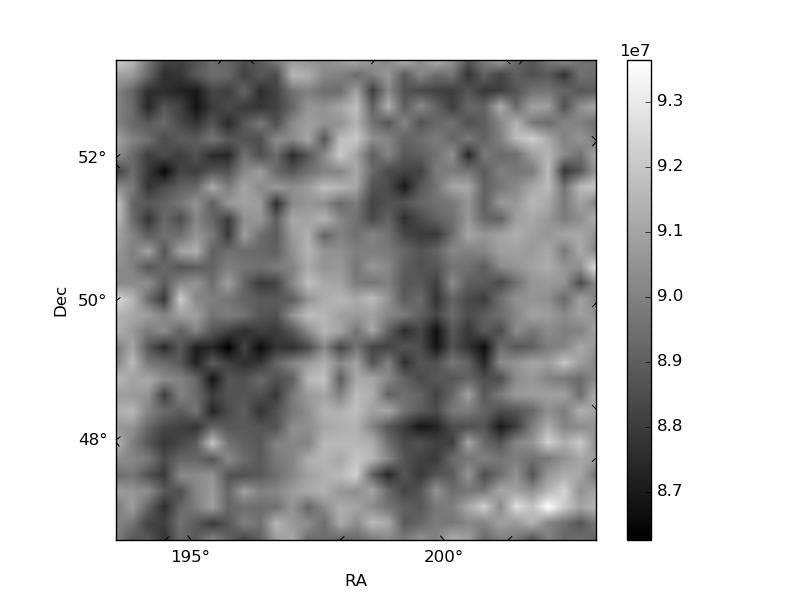
Histogram calculated using DETX and DETY for each event in the final _common_clean file
| Quadrant A | 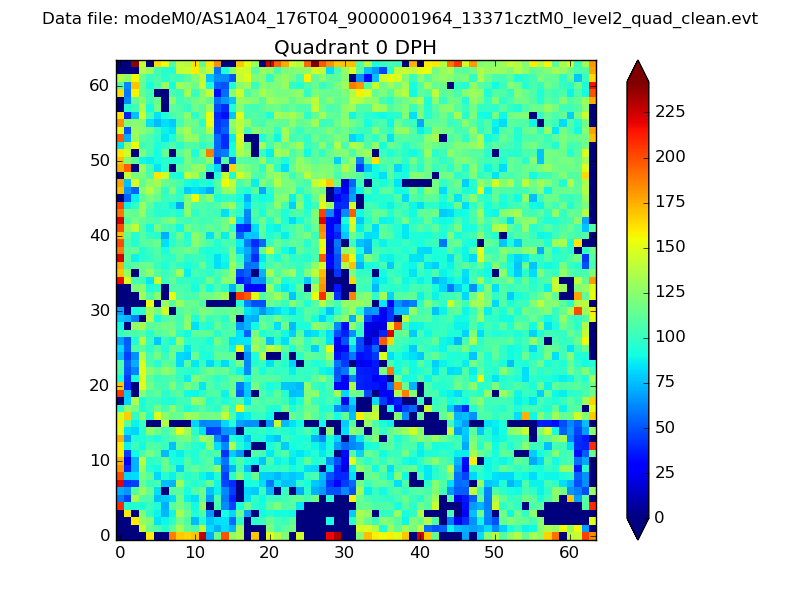 |
 |
Quadrant B |
|---|---|---|---|
| Quadrant D | 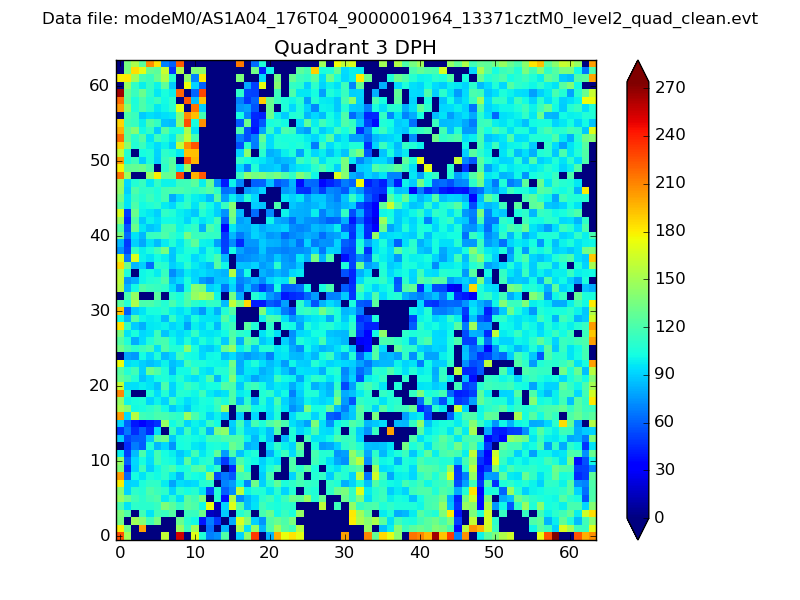 |
 |
Quadrant C |
| Plot type | Count rate plots | Images |
|---|---|---|
| Comparison with Poisson distribution Blue bars denote a histogram of data divided into 1 sec bins. Red curve is a Poisson curve with rate = median count rate of data. |
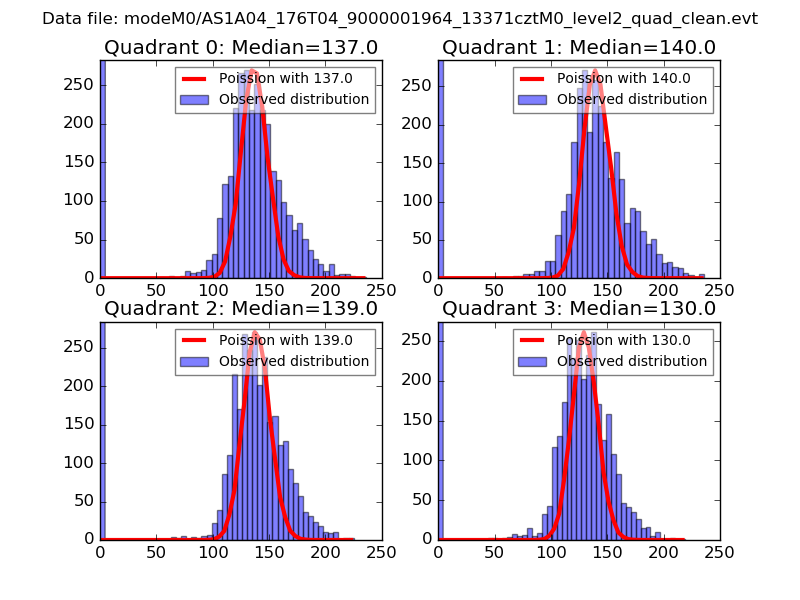 |
 |
| Quadrant-wise count rates Data is divided into 100 sec bins |
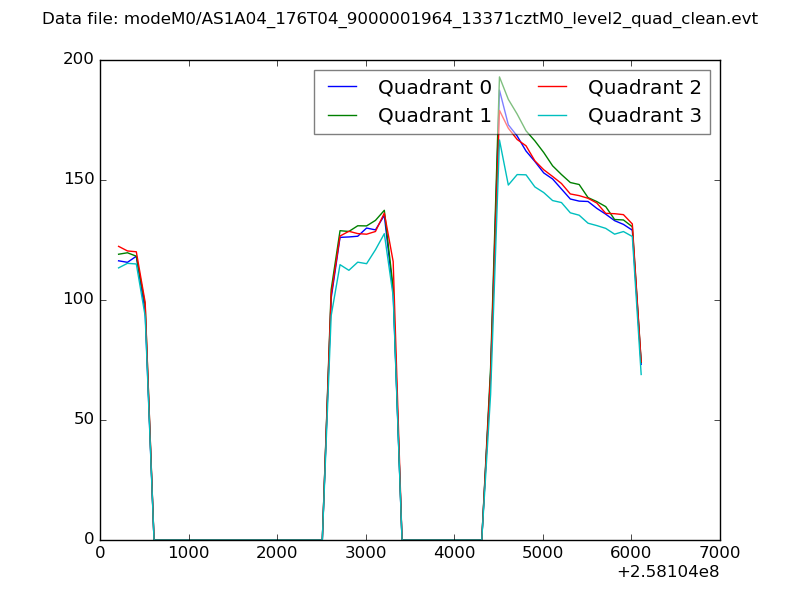 |
|
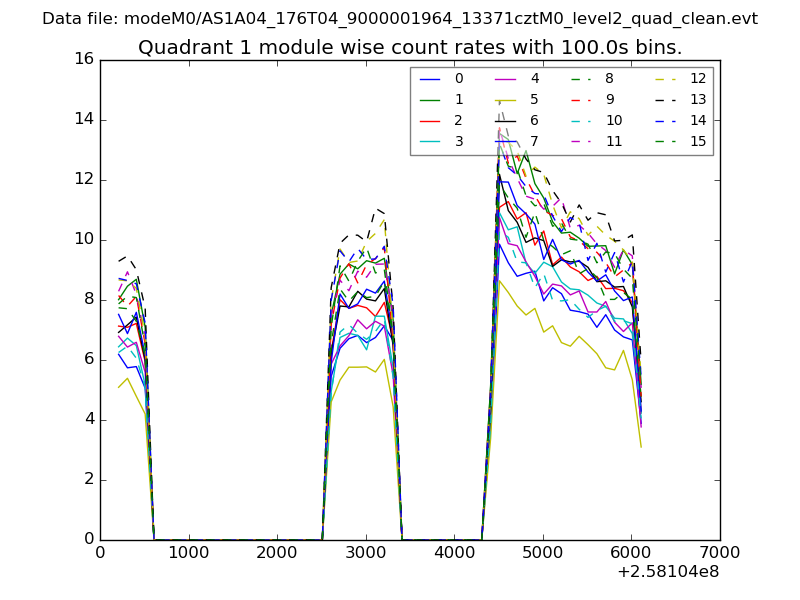
| Module-wise count rates for Quadrant A Data is divided into 100 sec bins |
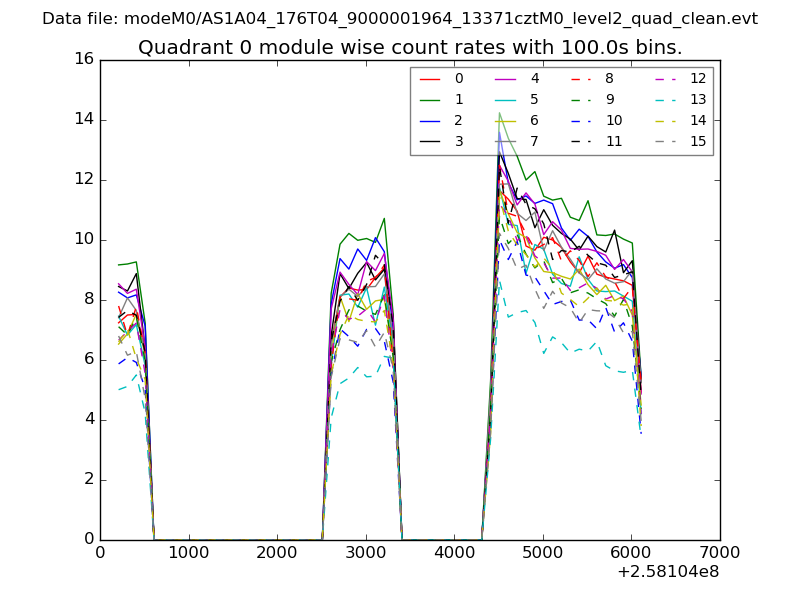 |
 |
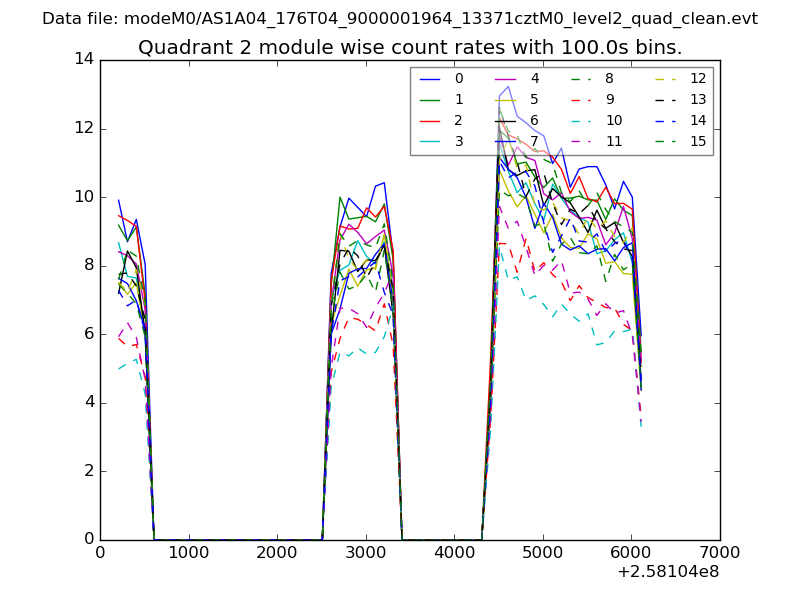
| Module-wise count rates for Quadrant B Data is divided into 100 sec bins |
 |
 |
| Module-wise count rates for Quadrant C Data is divided into 100 sec bins |
 |
 |
| Module-wise count rates for Quadrant D Data is divided into 100 sec bins |
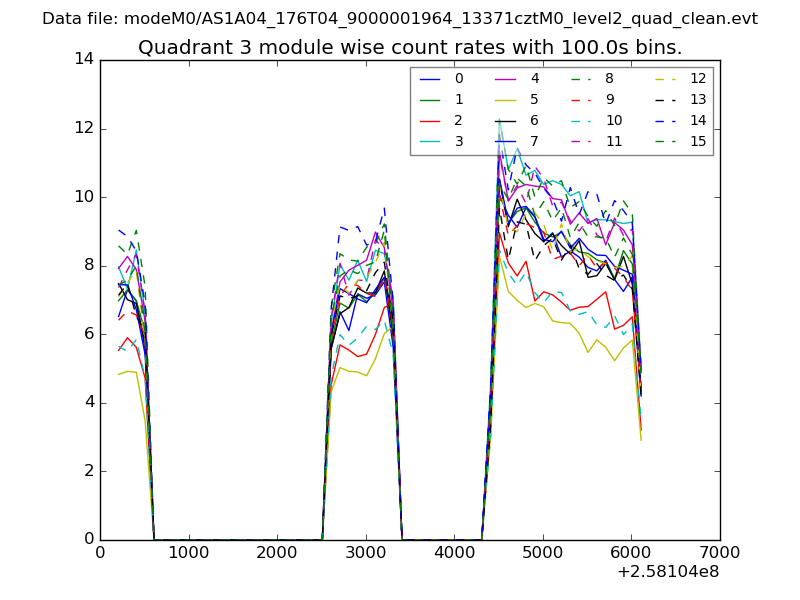 |
 |
| Parameter | Plot |
|---|---|
| CZT HV Monitor | 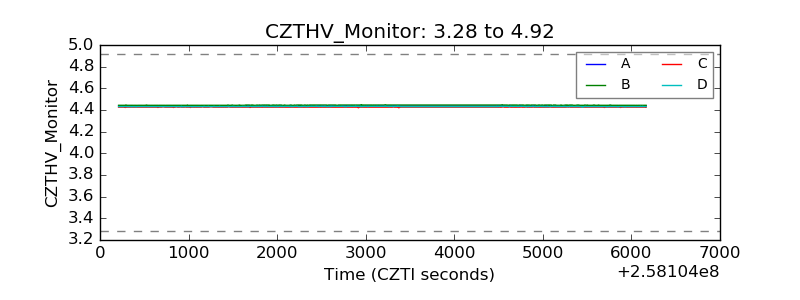 |
| D_VDD | 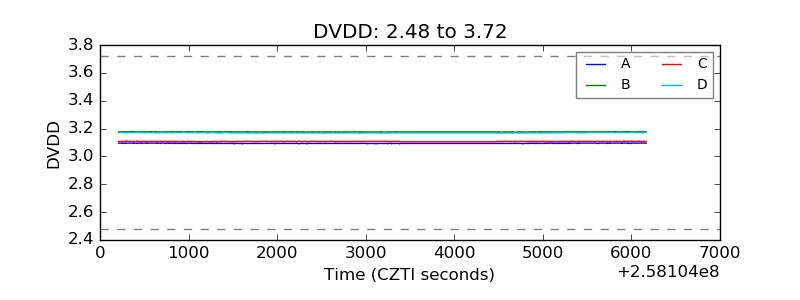 |
| Temperature 1 | 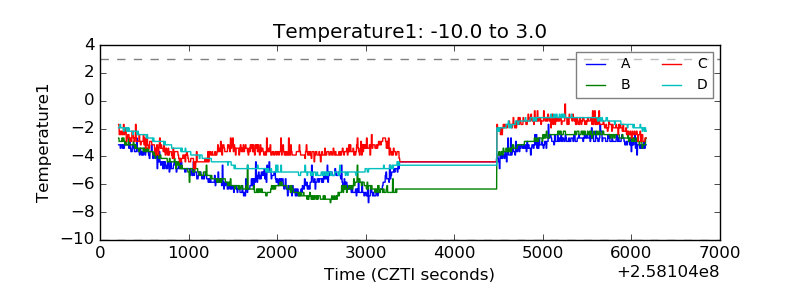 |
| Veto HV Monitor | 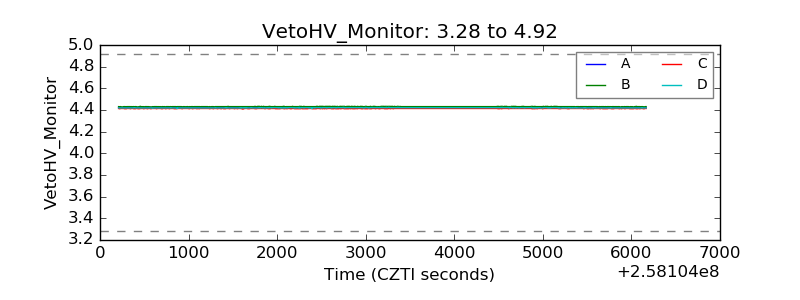 |
| Veto LLD | 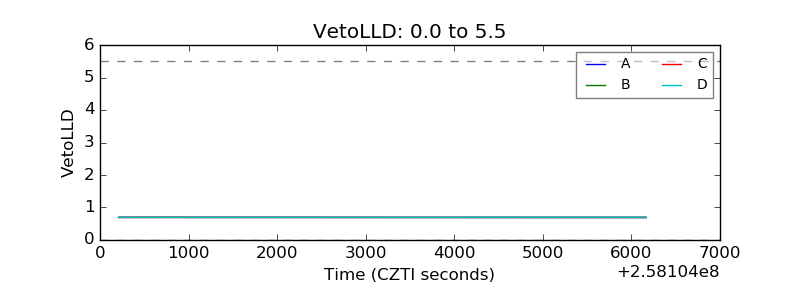 |
| Alpha Counter | 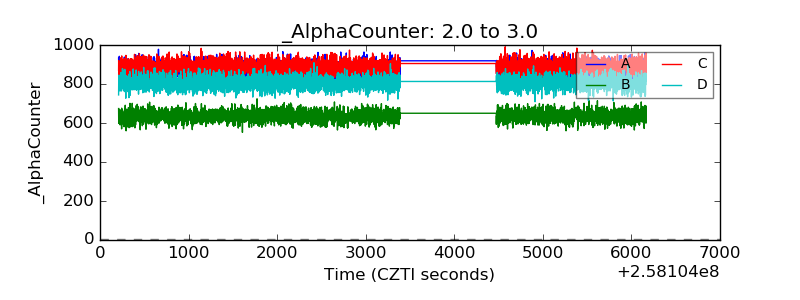 |
| _CPM_Rate | 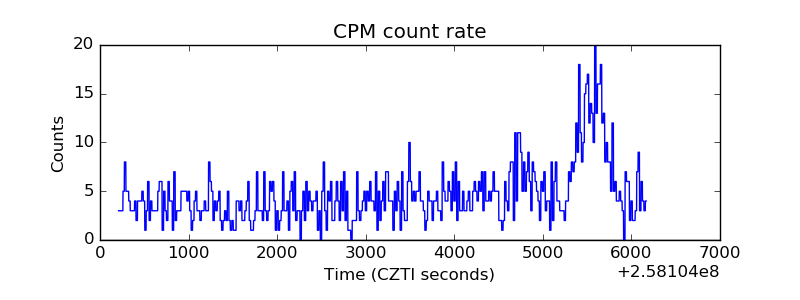 |
| CZT Counter | 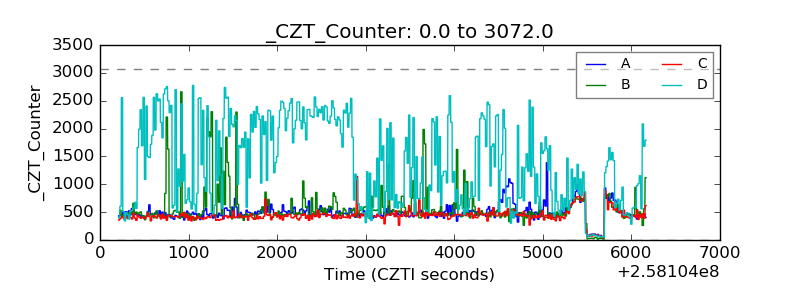 |
| +2.5 Volts monitor |  |
| +5 Volts monitor |  |
| _ROLL_ROT | 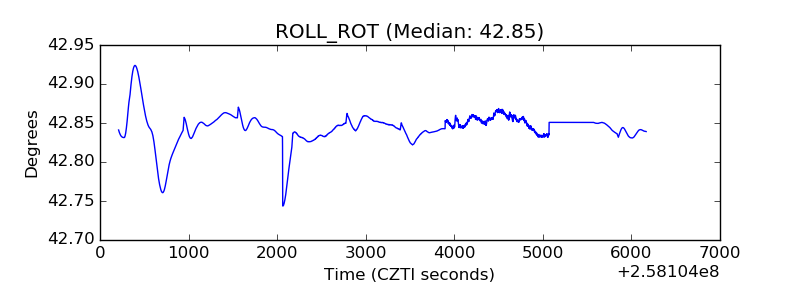 |
| _Roll_DEC | 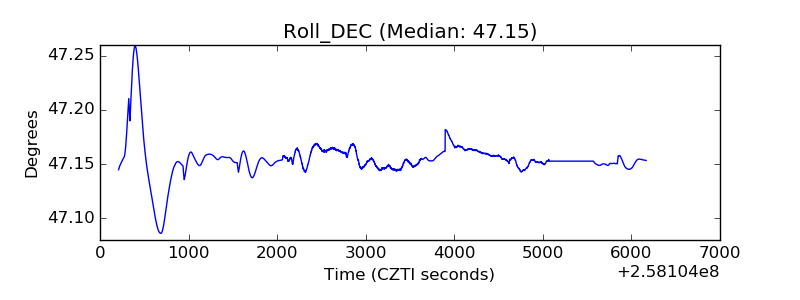 |
| _Roll_RA | 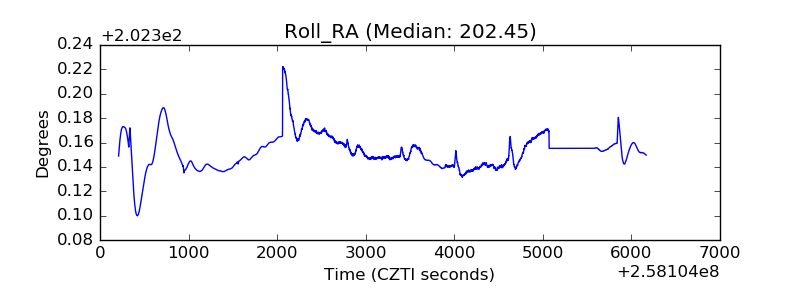 |
| Veto Counter | 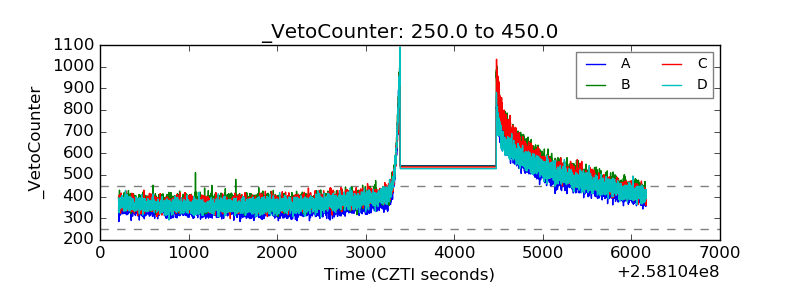 |