| Param | Original file | Final file |
|---|---|---|
| Filename | modeM0/AS1T02_012T08_9000001960cztM0_level2.fits | modeM0/AS1T02_012T08_9000001960cztM0_level2_quad_clean.evt |
| Size (bytes) | 49,806,720 | 49,089,600 |
| Size | 47.5 MB | 46.8 MB |
| Events in quadrant A | 304,116 | 313,035 |
| Events in quadrant B | 278,526 | 282,957 |
| Events in quadrant C | 301,038 | 295,402 |
| Events in quadrant D | 234,386 | 204,545 |
| Mode M9 | |||
|---|---|---|---|
| Quadrant | BADHDUFLAG | Total packets | Discarded packets |
| A | 0 | 5 | 0 |
| B | 0 | 5 | 0 |
| C | 0 | 5 | 0 |
| D | 0 | 5 | 0 |
| Mode SS | |||
|---|---|---|---|
| Quadrant | BADHDUFLAG | Total packets | Discarded packets |
| A | 0 | 114 | 0 |
| B | 0 | 114 | 0 |
| C | 0 | 114 | 0 |
| D | 0 | 114 | 0 |
| Mode M0 | |||
|---|---|---|---|
| Quadrant | BADHDUFLAG | Total packets | Discarded packets |
| A | 0 | 11496 | 0 |
| B | 0 | 15222 | 0 |
| C | 0 | 11415 | 0 |
| D | 0 | 22059 | 0 |
| Quadrant | Total seconds | Saturated seconds | Saturation percentage |
|---|---|---|---|
| A | 5569 | 119 | 2.136829% |
| B | 5569 | 556 | 9.983839% |
| C | 5569 | 85 | 1.526306% |
| D | 5569 | 1051 | 18.872329% |
Noise dominated data is calculated using 1-second bins in cleaned event files. If a bin has >2000 counts, and if more than 50% of those come from <1% of pixels, then it is considered to be noise-dominated and hence unusable.
| Quadrant | # 1 sec bins | Bins with >0 counts | Bins with >2000 counts | High rate bins dominated by noise | Noise dominated (total time) | Noise dominated (detector-on time) | Marked lightcurve |
|---|---|---|---|---|---|---|---|
| A | 6099 | 5570 | 0 | 0 | 0.00% | 0.00% | 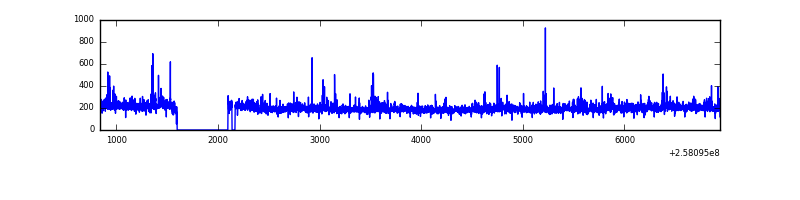 |
| B | 6099 | 5497 | 0 | 0 | 0.00% | 0.00% | 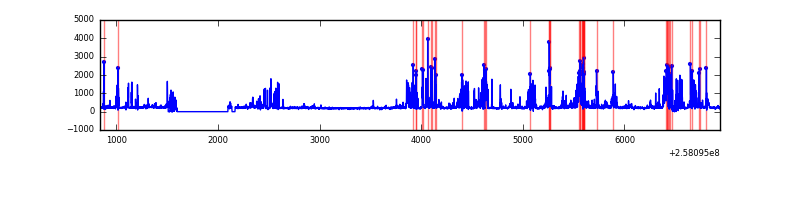 |
| C | 6099 | 5569 | 0 | 0 | 0.00% | 0.00% | 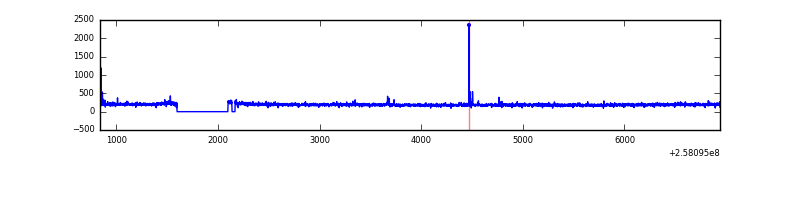 |
| D | 6099 | 5556 | 0 | 0 | 0.00% | 0.00% | 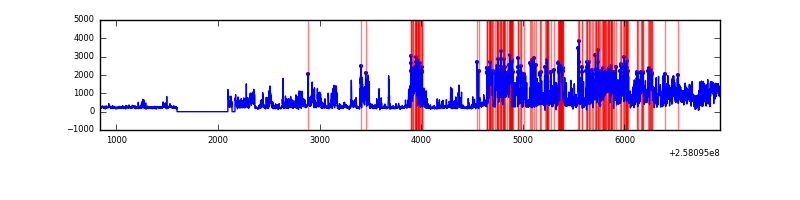 |
Top three noisy pixels from each quadrant. If the there are fewer than three noisy pixels in the level2.evt file, extra rows are filled as -1
| Pixel properties | Quadrant properties | ||||||
|---|---|---|---|---|---|---|---|
| Quadrant | DetID | PixID | Counts | Sigma | Mean | Median | Sigma |
| A | 0 | 29 | 271 | 8.97 | 79 | 74 | 22.0 |
| A | 7 | 110 | 254 | 8.19 | 79 | 74 | 22.0 |
| A | 0 | 30 | 223 | 6.78 | 79 | 74 | 22.0 |
| B | 2 | 9 | 255 | 10.85 | 73 | 69 | 17.1 |
| B | 12 | 226 | 205 | 7.93 | 73 | 69 | 17.1 |
| B | 14 | 254 | 204 | 7.88 | 73 | 69 | 17.1 |
| C | 12 | 241 | 234 | 7.14 | 79 | 74 | 22.4 |
| C | 9 | 188 | 204 | 5.8 | 79 | 74 | 22.4 |
| C | 12 | 242 | 203 | 5.76 | 79 | 74 | 22.4 |
| D | 6 | 38 | 181 | 6.18 | 66 | 61 | 19.4 |
| D | 7 | 5 | 177 | 5.97 | 66 | 61 | 19.4 |
| D | 1 | 3 | 170 | 5.61 | 66 | 61 | 19.4 |
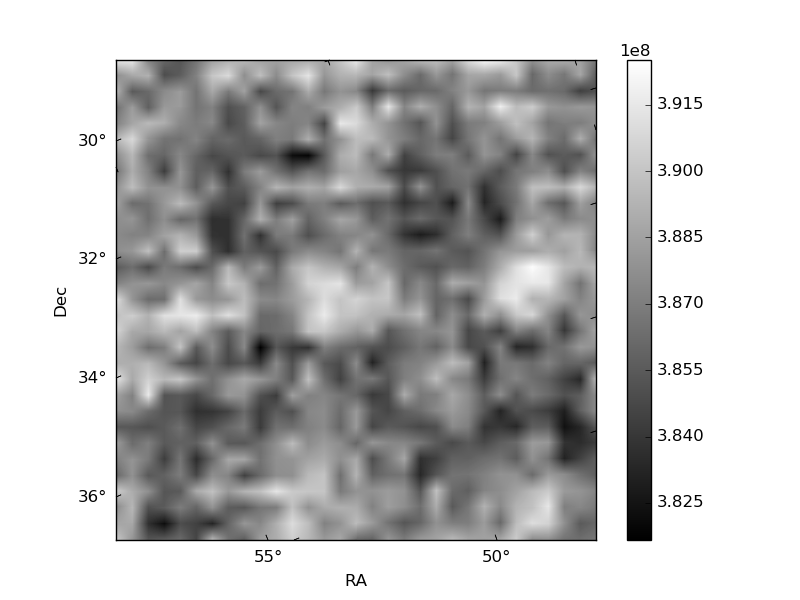
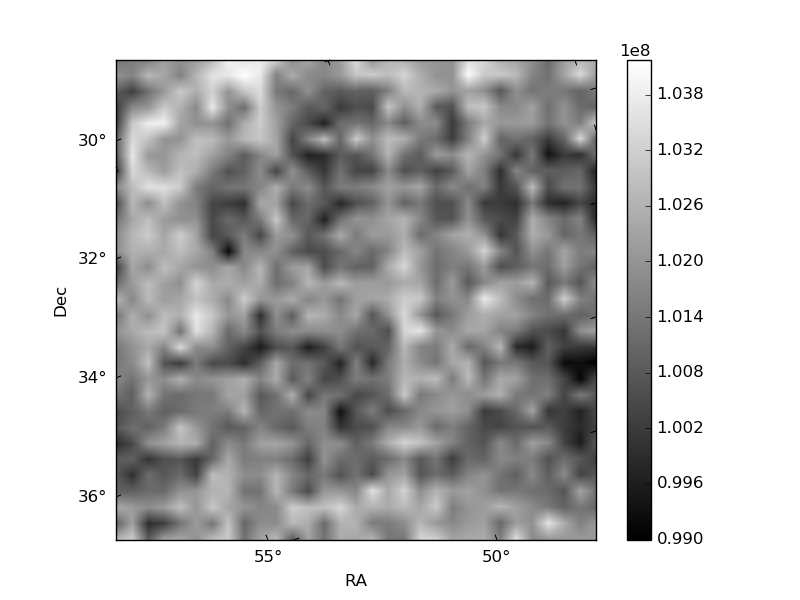
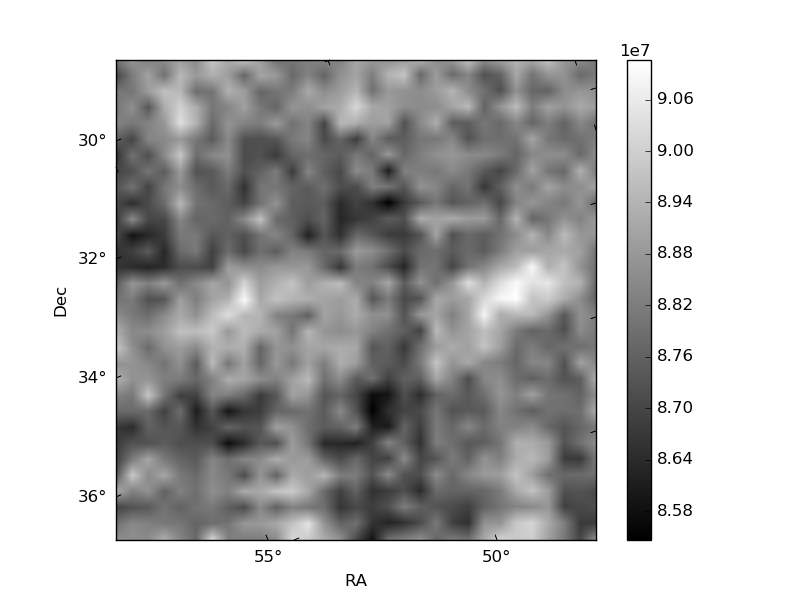
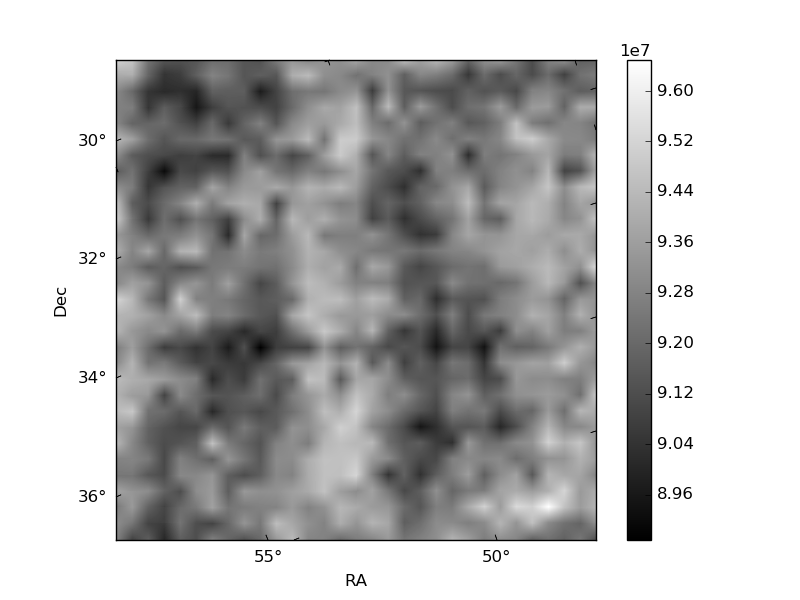
Histogram calculated using DETX and DETY for each event in the final _common_clean file
| Quadrant A | 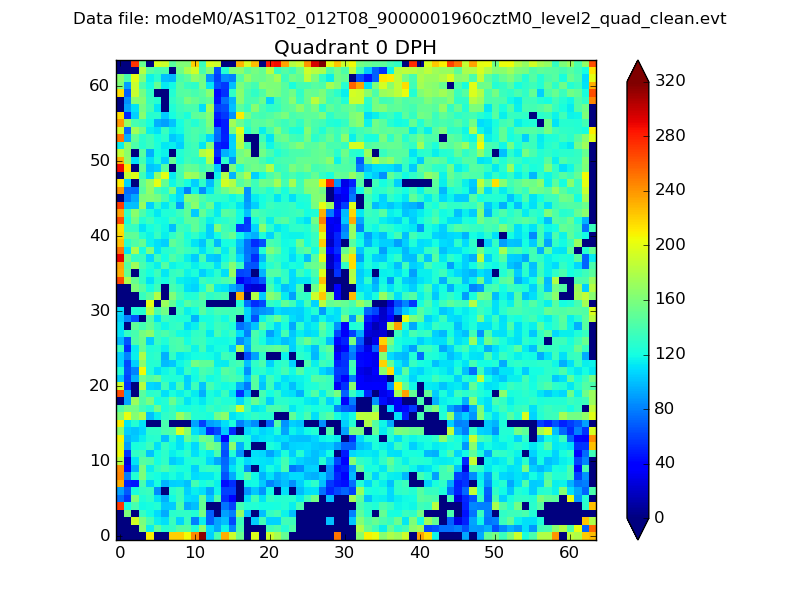 |
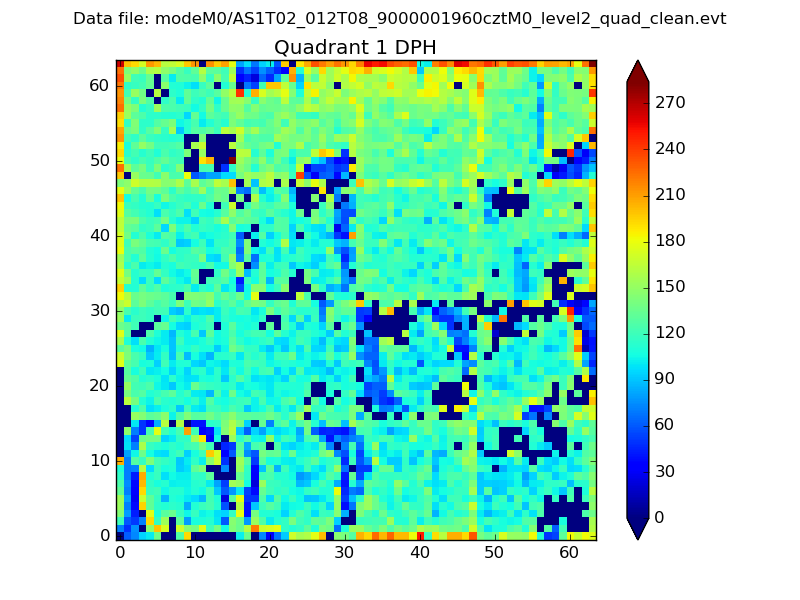 |
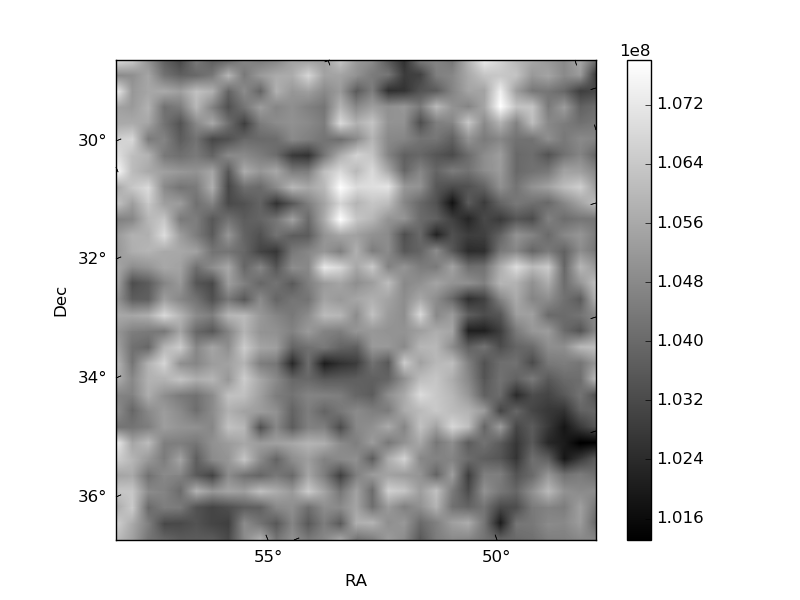
Quadrant B |
|---|---|---|---|
| Quadrant D | 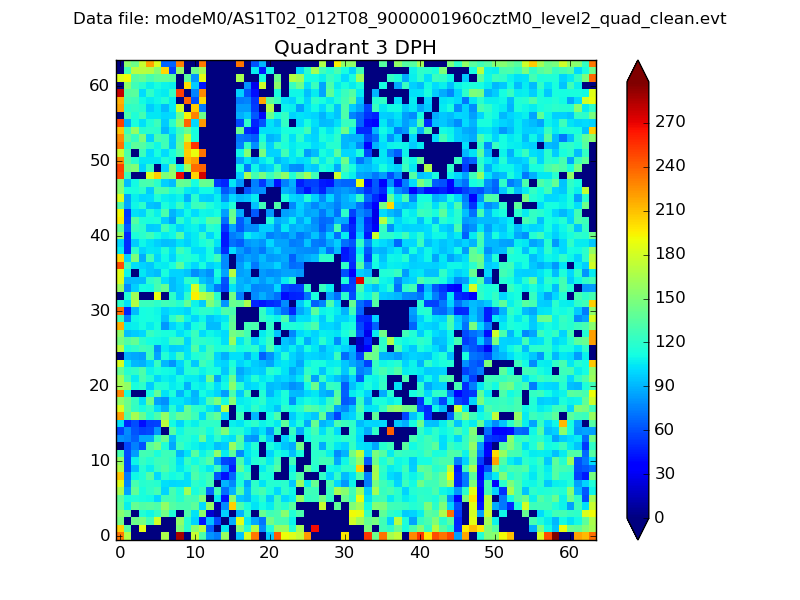 |
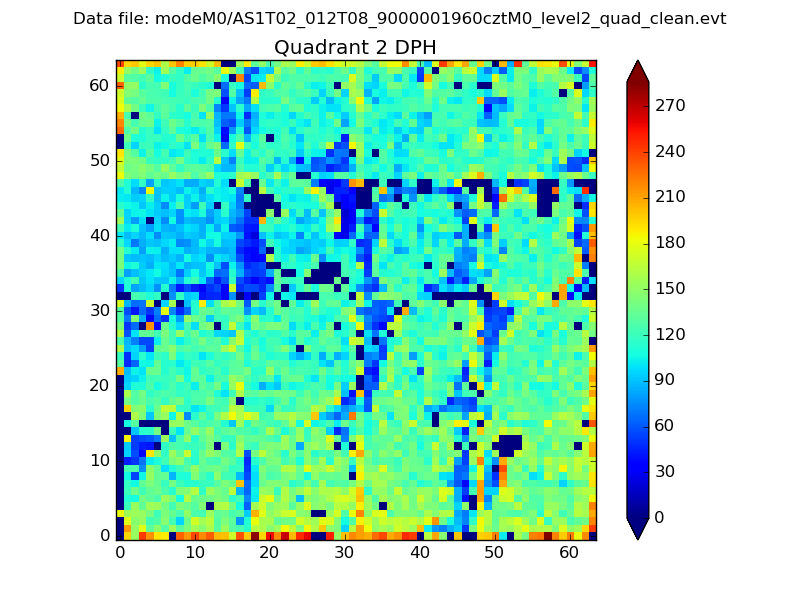 |
Quadrant C |
| Plot type | Count rate plots | Images |
|---|---|---|
| Comparison with Poisson distribution Blue bars denote a histogram of data divided into 1 sec bins. Red curve is a Poisson curve with rate = median count rate of data. |
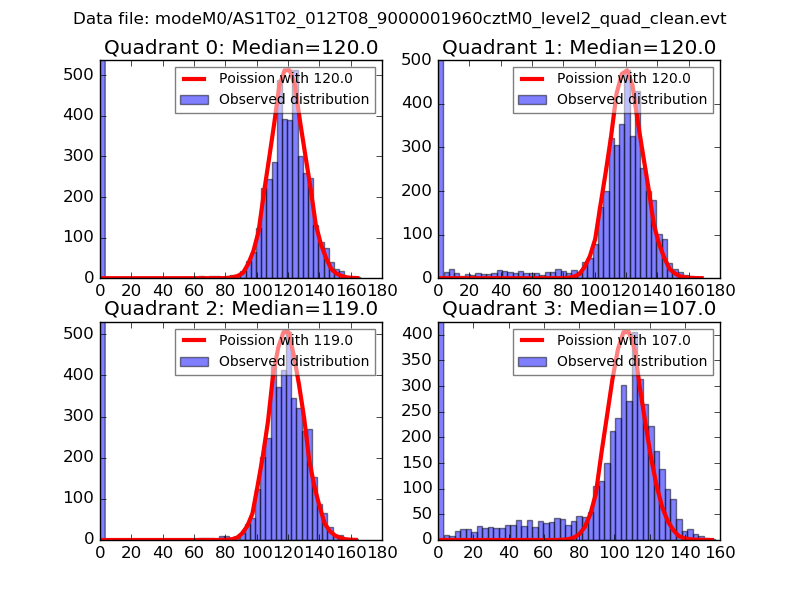 |
 |
| Quadrant-wise count rates Data is divided into 100 sec bins |
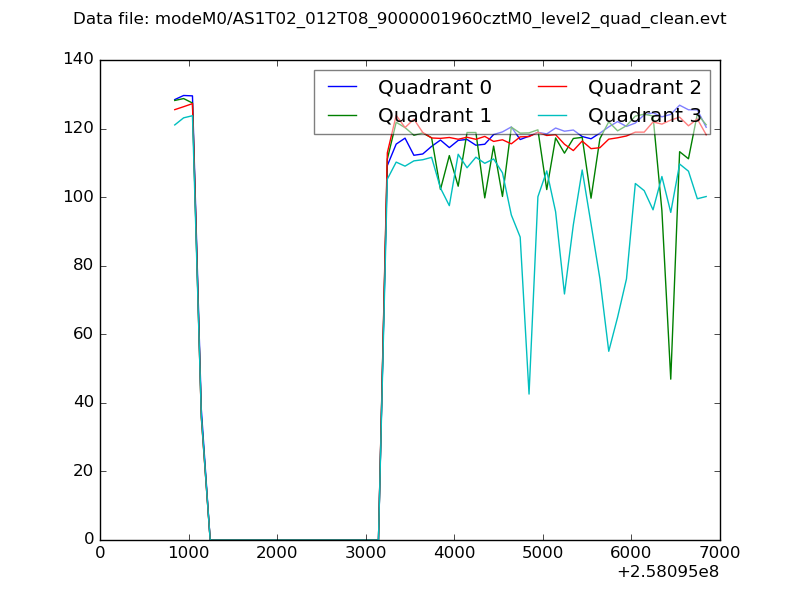 |
|
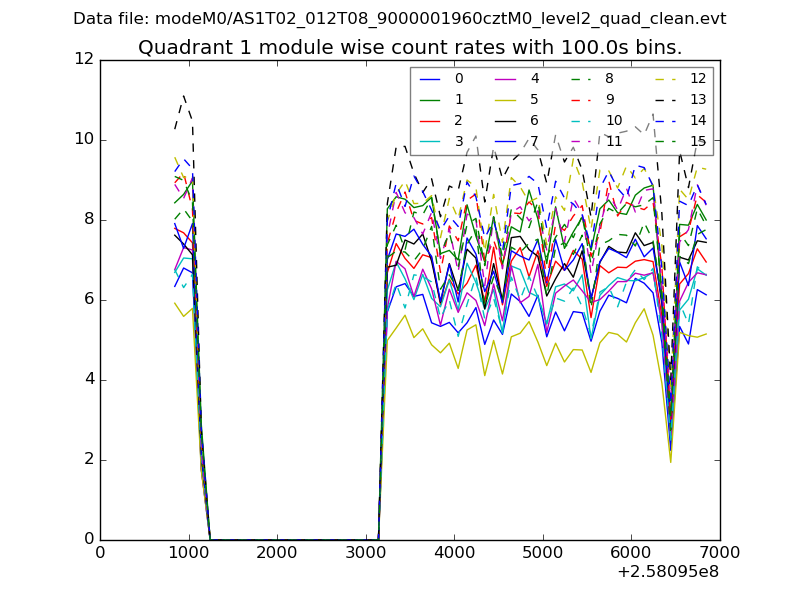
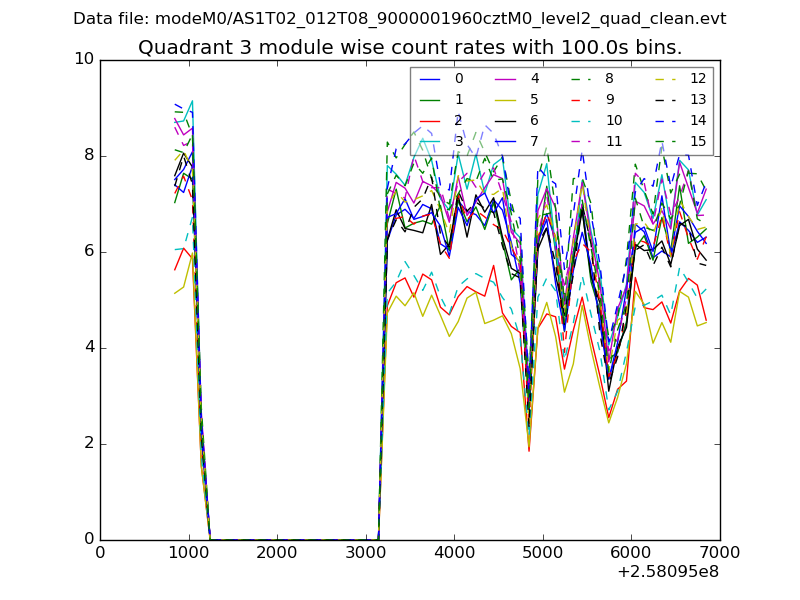
| Module-wise count rates for Quadrant A Data is divided into 100 sec bins |
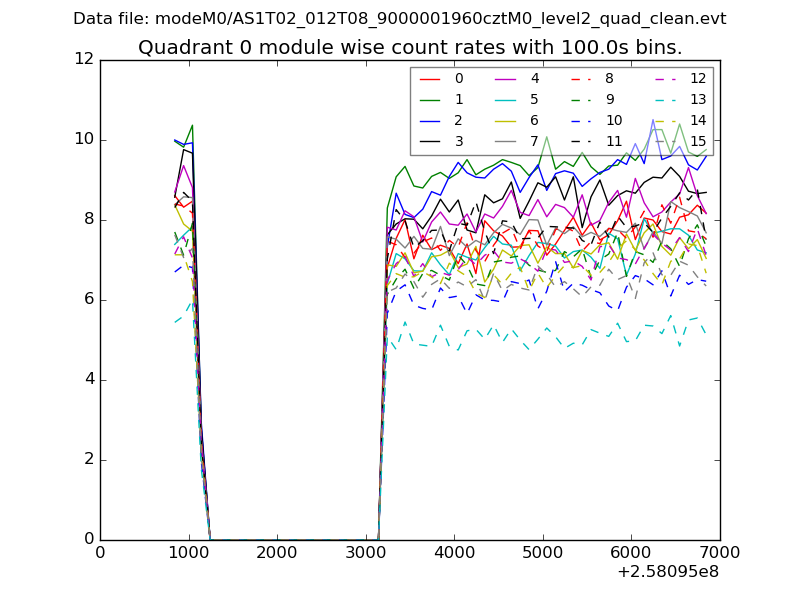 |
 |
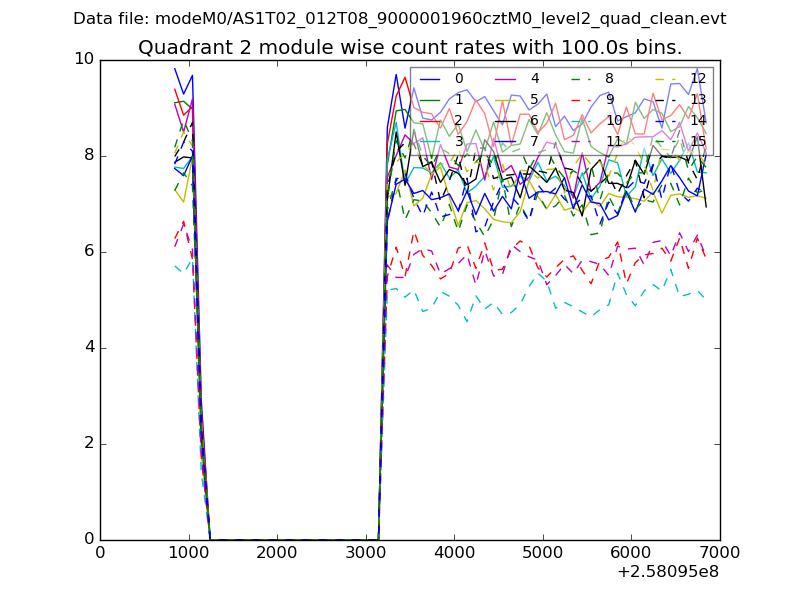
| Module-wise count rates for Quadrant B Data is divided into 100 sec bins |
 |
 |
| Module-wise count rates for Quadrant C Data is divided into 100 sec bins |
 |
 |
| Module-wise count rates for Quadrant D Data is divided into 100 sec bins |
 |
 |
| Parameter | Plot |
|---|---|
| CZT HV Monitor | 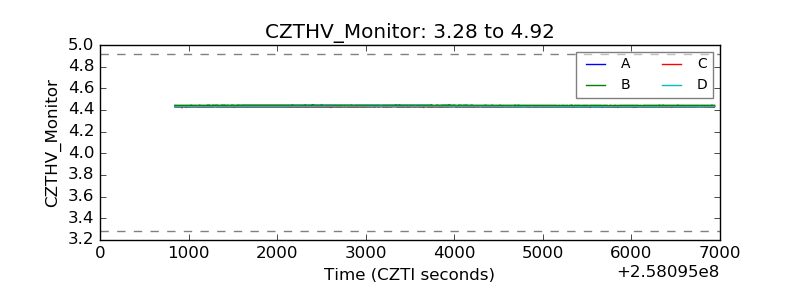 |
| D_VDD | 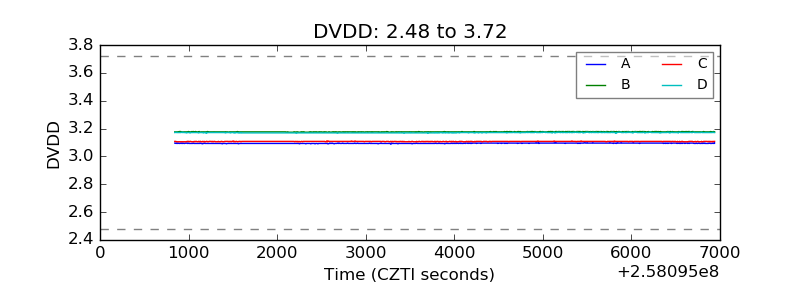 |
| Temperature 1 | 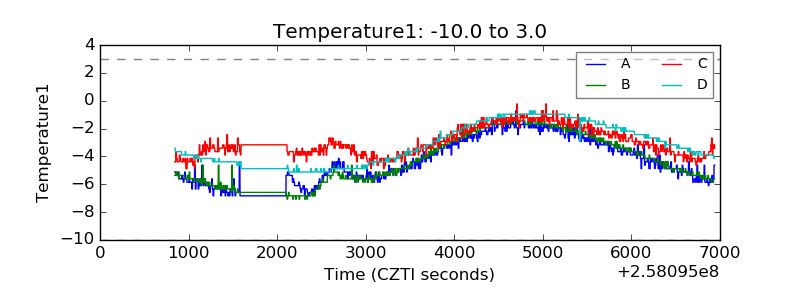 |
| Veto HV Monitor | 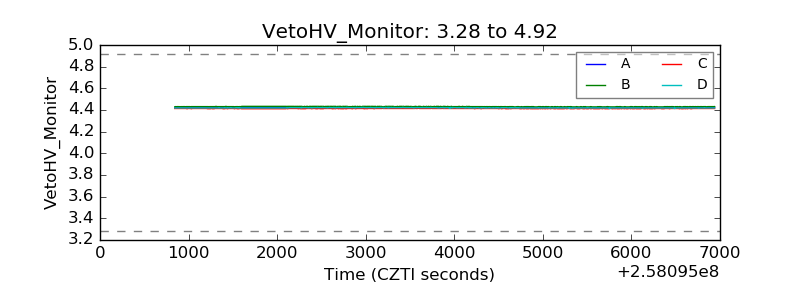 |
| Veto LLD | 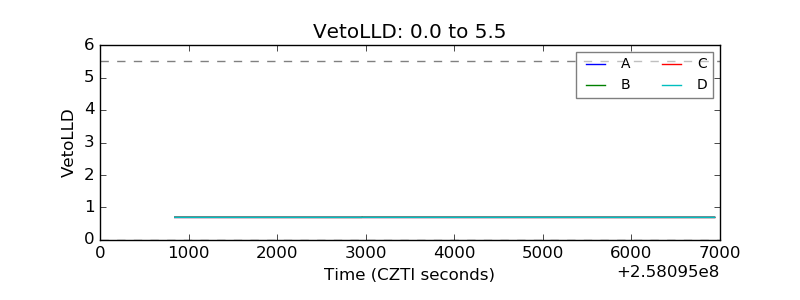 |
| Alpha Counter | 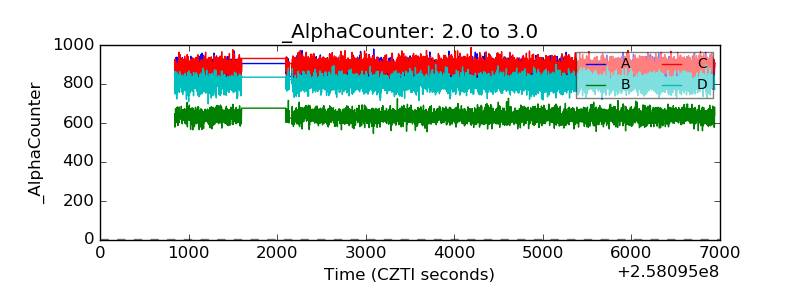 |
| _CPM_Rate | 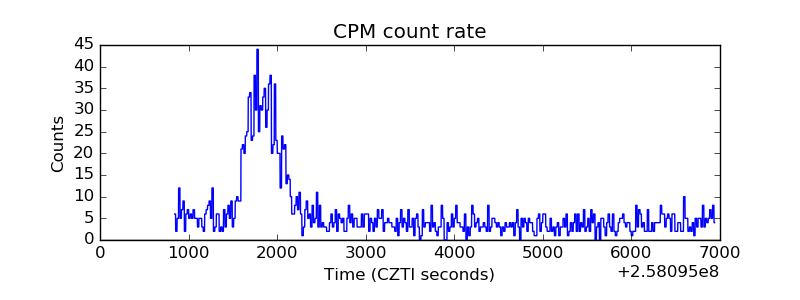 |
| CZT Counter | 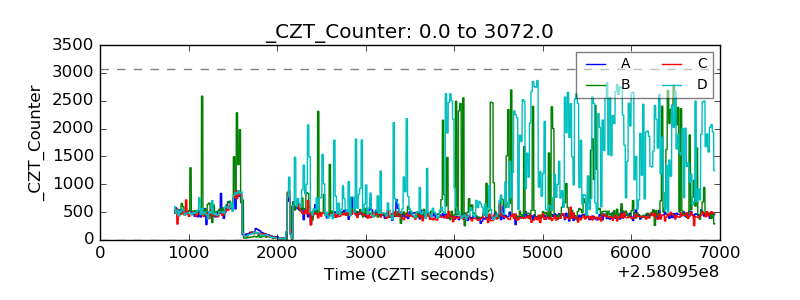 |
| +2.5 Volts monitor | 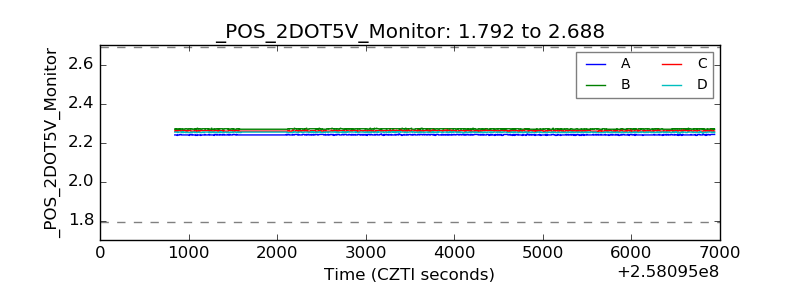 |
| +5 Volts monitor | 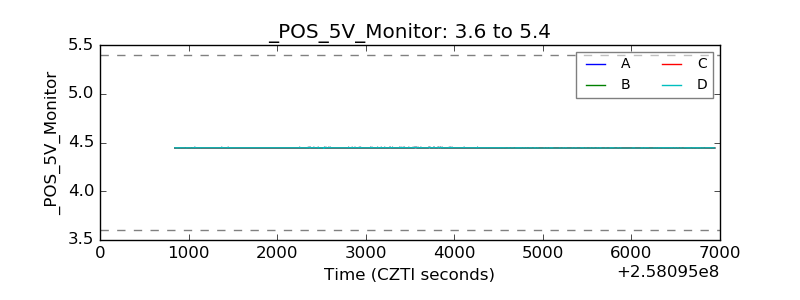 |
| _ROLL_ROT | 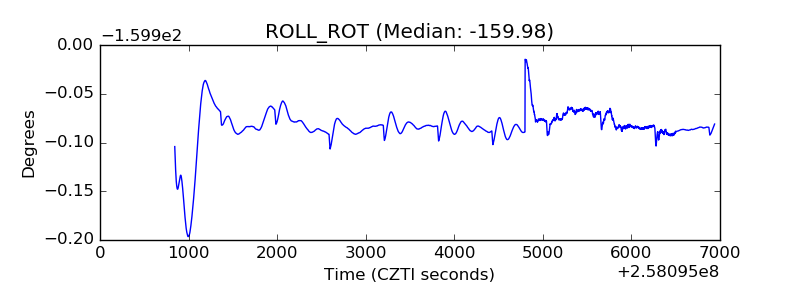 |
| _Roll_DEC | 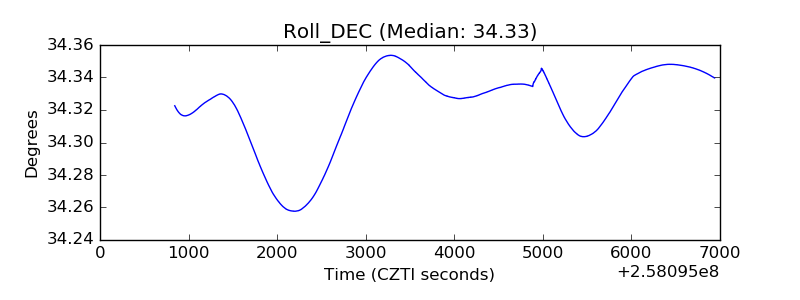 |
| _Roll_RA | 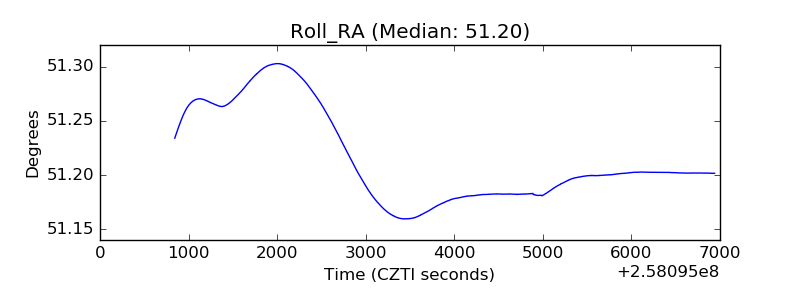 |
| Veto Counter | 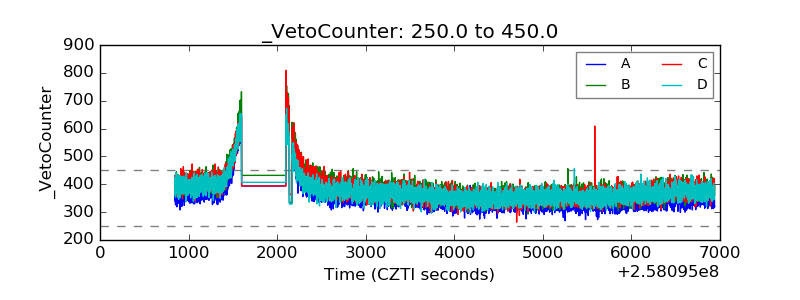 |