| Param | Original file | Final file |
|---|---|---|
| Filename | modeM0/AS1T02_012T08_9000001960_13189cztM0_level2.evt | modeM0/AS1T02_012T08_9000001960_13189cztM0_level2_quad_clean.evt |
| Size (bytes) | 176,846,400 | 16,738,560 |
| Size | 168.7 MB | 16.0 MB |
| Events in quadrant A | 1,144,733 | 85,965 |
| Events in quadrant B | 1,375,345 | 87,306 |
| Events in quadrant C | 1,116,782 | 87,363 |
| Events in quadrant D | 1,563,227 | 82,349 |
| Mode M9 | |||
|---|---|---|---|
| Quadrant | BADHDUFLAG | Total packets | Discarded packets |
| A | 0 | 5 | 0 |
| B | 0 | 5 | 0 |
| C | 0 | 5 | 0 |
| D | 0 | 5 | 0 |
| Mode SS | |||
|---|---|---|---|
| Quadrant | BADHDUFLAG | Total packets | Discarded packets |
| A | 0 | 48 | 0 |
| B | 0 | 48 | 0 |
| C | 0 | 48 | 0 |
| D | 0 | 48 | 0 |
| Mode M0 | |||
|---|---|---|---|
| Quadrant | BADHDUFLAG | Total packets | Discarded packets |
| A | 0 | 4835 | 2 |
| B | 0 | 5506 | 1 |
| C | 0 | 4769 | 1 |
| D | 0 | 6106 | 1 |
| Quadrant | Total seconds | Saturated seconds | Saturation percentage |
|---|---|---|---|
| A | 2254 | 118 | 5.235138% |
| B | 2254 | 208 | 9.228039% |
| C | 2254 | 83 | 3.682343% |
| D | 2254 | 134 | 5.944987% |
Noise dominated data is calculated using 1-second bins in cleaned event files. If a bin has >2000 counts, and if more than 50% of those come from <1% of pixels, then it is considered to be noise-dominated and hence unusable.
| Quadrant | # 1 sec bins | Bins with >0 counts | Bins with >2000 counts | High rate bins dominated by noise | Noise dominated (total time) | Noise dominated (detector-on time) | Marked lightcurve |
|---|---|---|---|---|---|---|---|
| A | 2785 | 2257 | 0 | 0 | 0.00% | 0.00% | 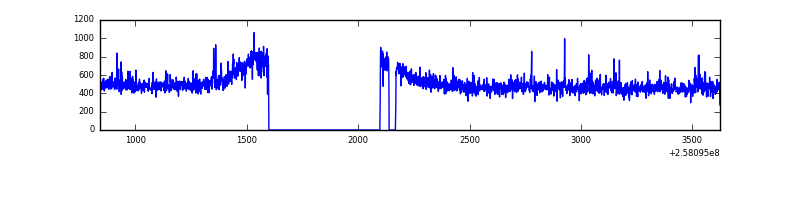 |
| B | 2785 | 2257 | 51 | 51 | 1.83% | 2.26% | 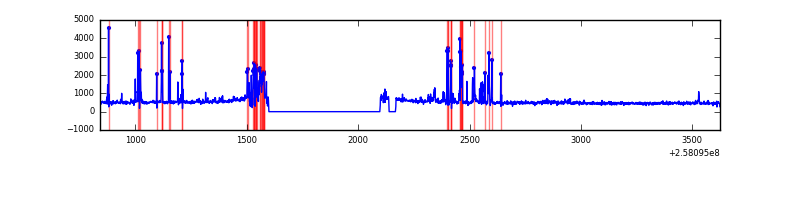 |
| C | 2785 | 2257 | 0 | 0 | 0.00% | 0.00% |  |
| D | 2785 | 2257 | 31 | 31 | 1.11% | 1.37% | 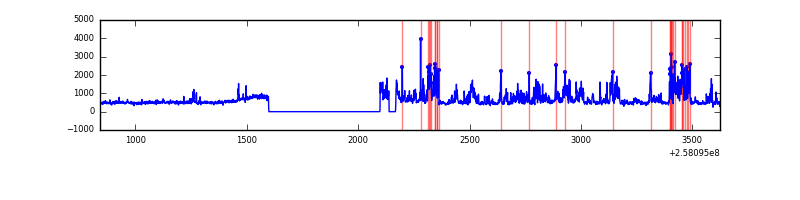 |
Top three noisy pixels from each quadrant. If the there are fewer than three noisy pixels in the level2.evt file, extra rows are filled as -1
| Pixel properties | Quadrant properties | ||||||
|---|---|---|---|---|---|---|---|
| Quadrant | DetID | PixID | Counts | Sigma | Mean | Median | Sigma |
| A | 4 | 2 | 13656 | 223.54 | 286 | 278 | 59.8 |
| A | 12 | 189 | 12850 | 210.08 | 286 | 278 | 59.8 |
| A | 8 | 15 | 8106 | 130.8 | 286 | 278 | 59.8 |
| B | 4 | 239 | 270746 | 4936.33 | 273 | 266 | 54.8 |
| B | 3 | 64 | 10573 | 188.11 | 273 | 266 | 54.8 |
| B | 0 | 219 | 8996 | 159.32 | 273 | 266 | 54.8 |
| C | 15 | 208 | 6696 | 94.99 | 284 | 285 | 67.5 |
| C | 13 | 61 | 2105 | 26.97 | 284 | 285 | 67.5 |
| C | 8 | 222 | 770 | 7.19 | 284 | 285 | 67.5 |
| D | 13 | 122 | 464262 | 6737.04 | 277 | 268 | 68.9 |
| D | 1 | 52 | 31635 | 455.44 | 277 | 268 | 68.9 |
| D | 2 | 234 | 7538 | 105.56 | 277 | 268 | 68.9 |
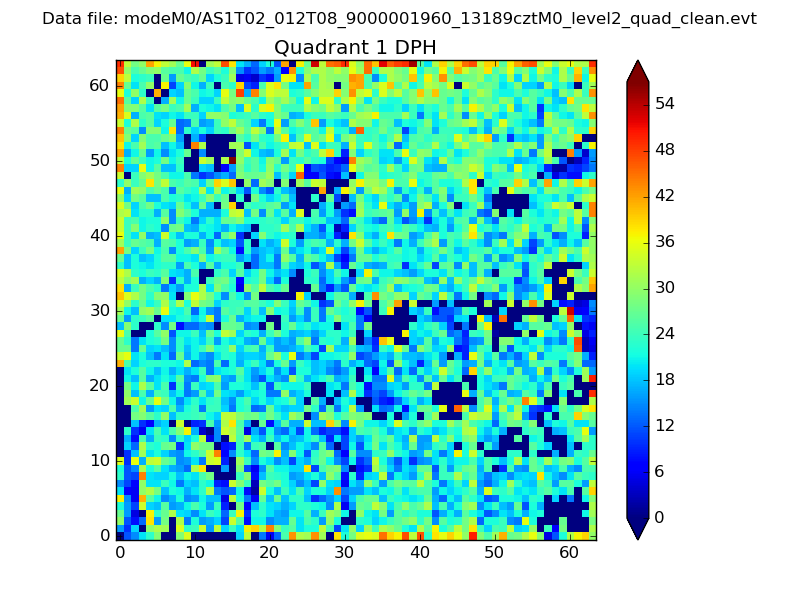
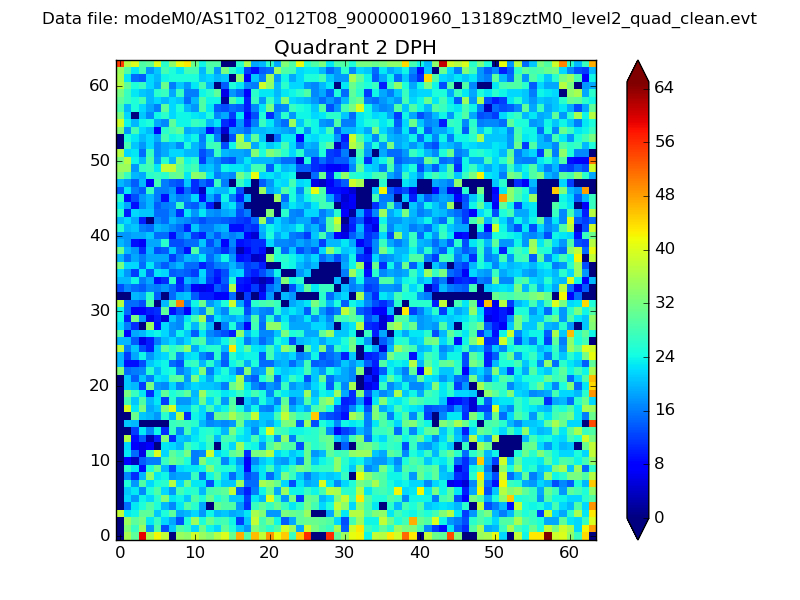
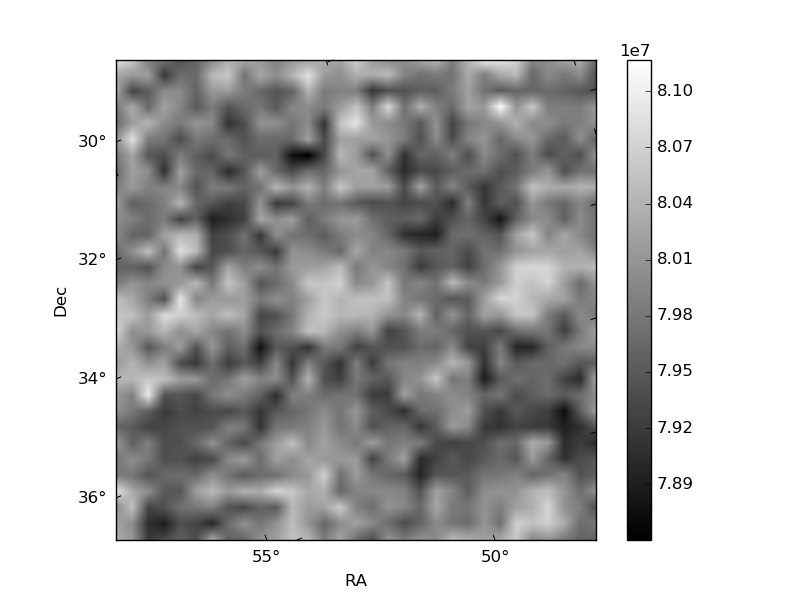
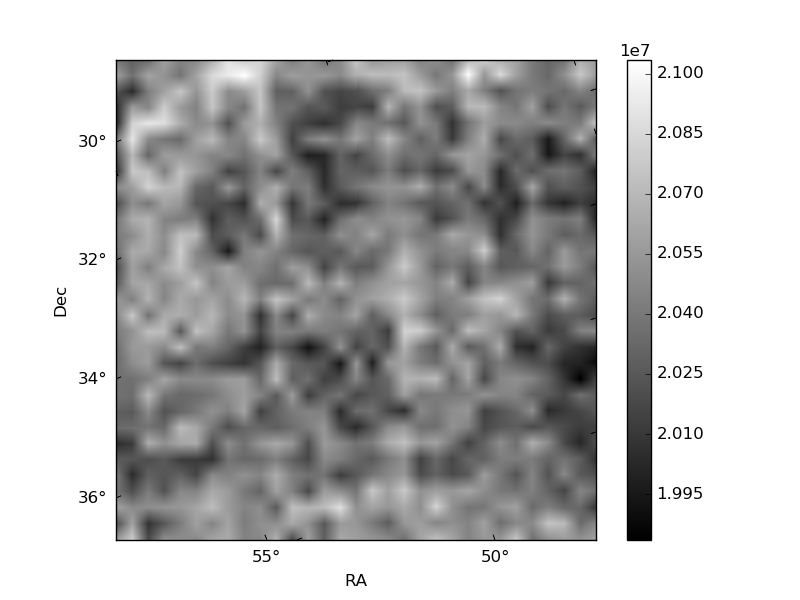
Histogram calculated using DETX and DETY for each event in the final _common_clean file
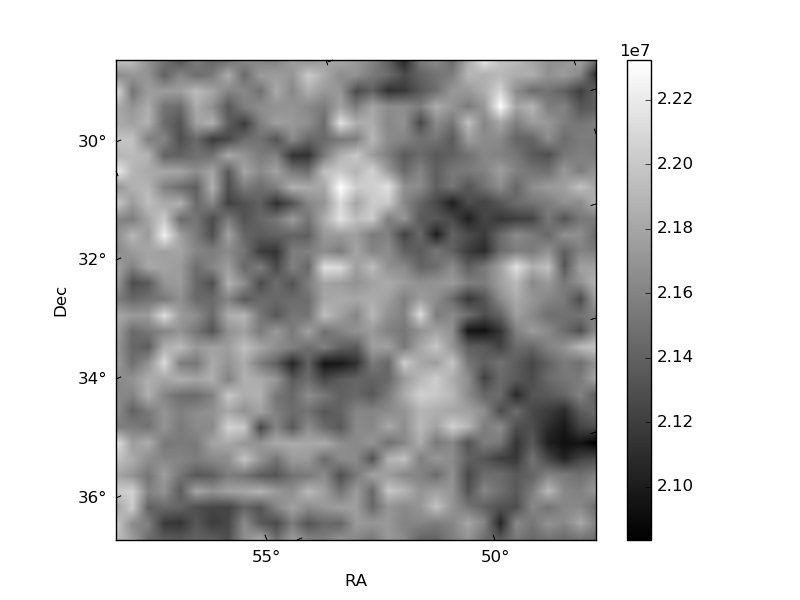
| Quadrant A | 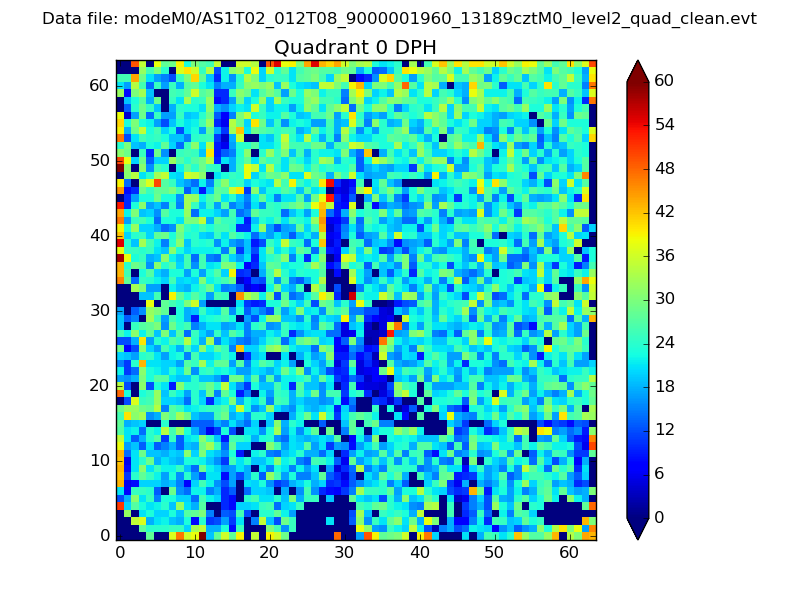 |
 |
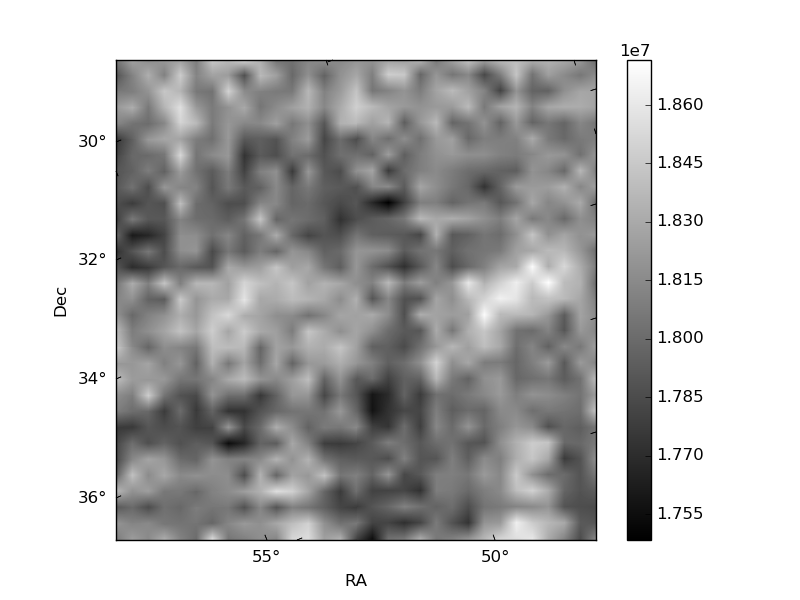
Quadrant B |
|---|---|---|---|
| Quadrant D | 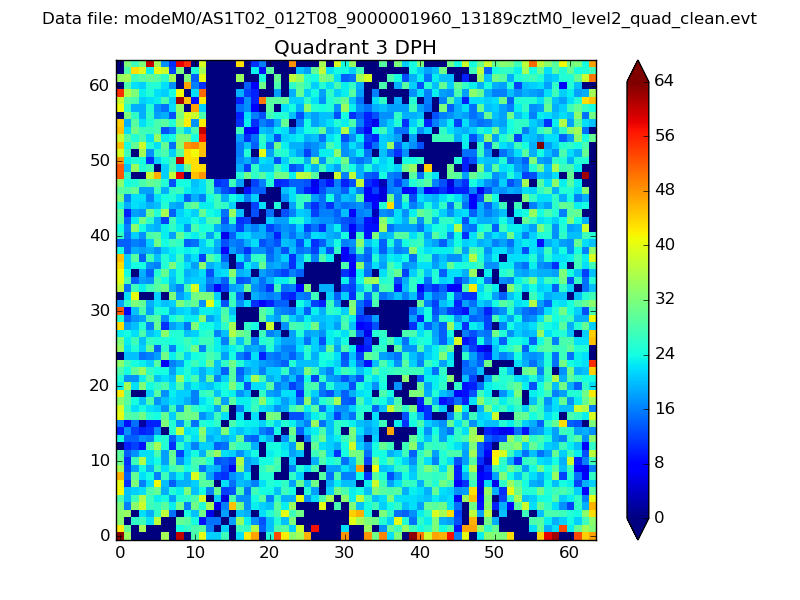 |
 |
Quadrant C |
| Plot type | Count rate plots | Images |
|---|---|---|
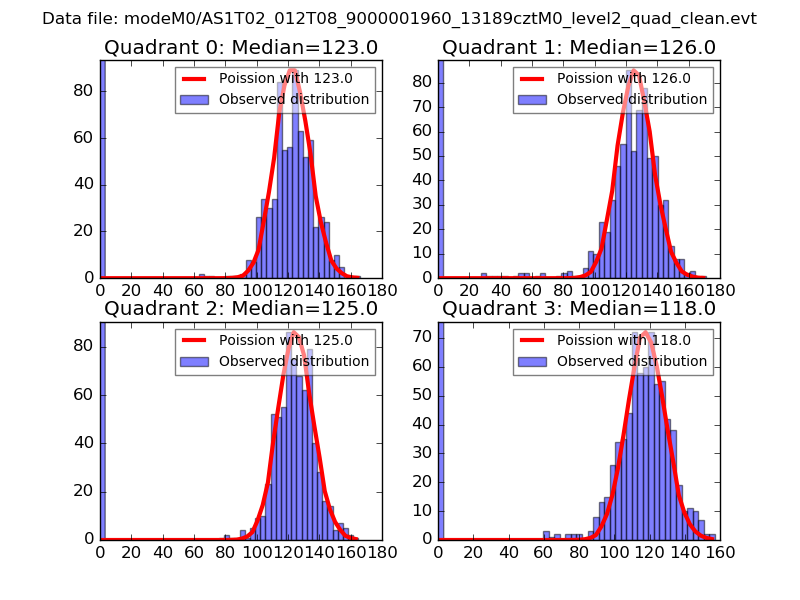
| Comparison with Poisson distribution Blue bars denote a histogram of data divided into 1 sec bins. Red curve is a Poisson curve with rate = median count rate of data. |
 |
 |
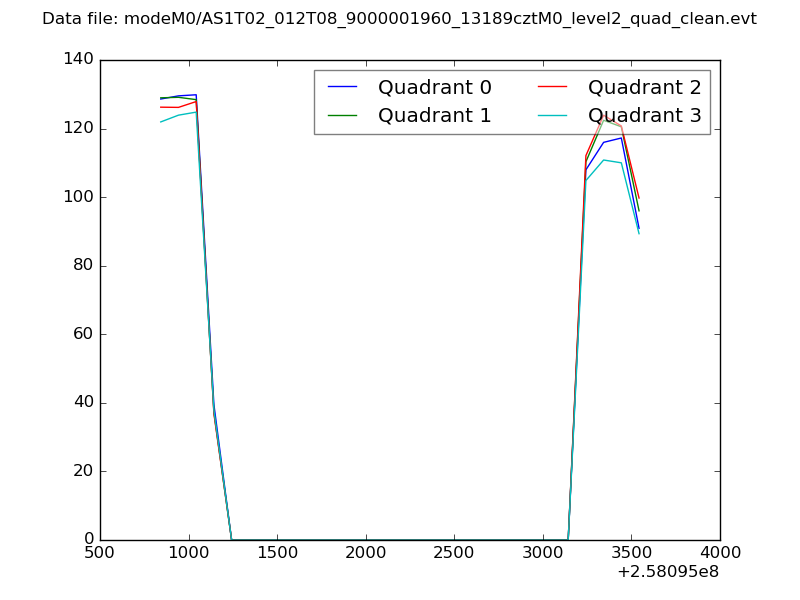
| Quadrant-wise count rates Data is divided into 100 sec bins |
 |
|
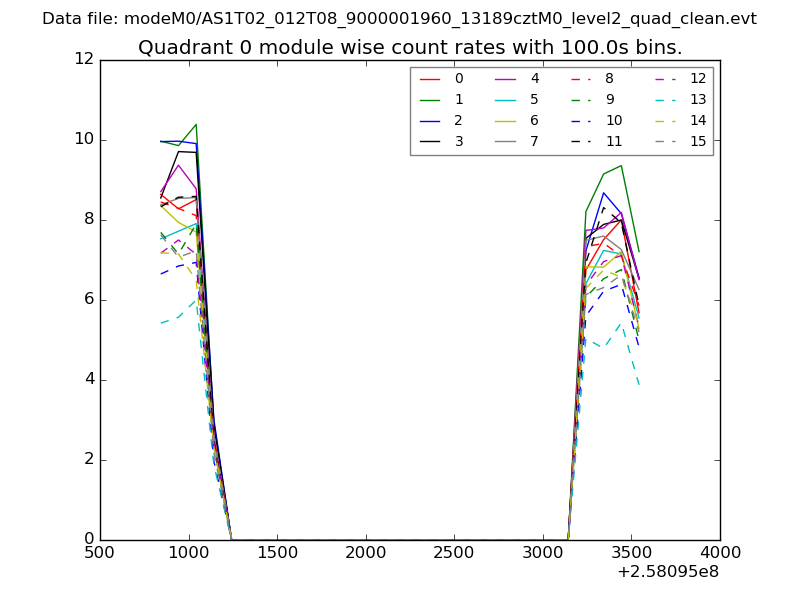
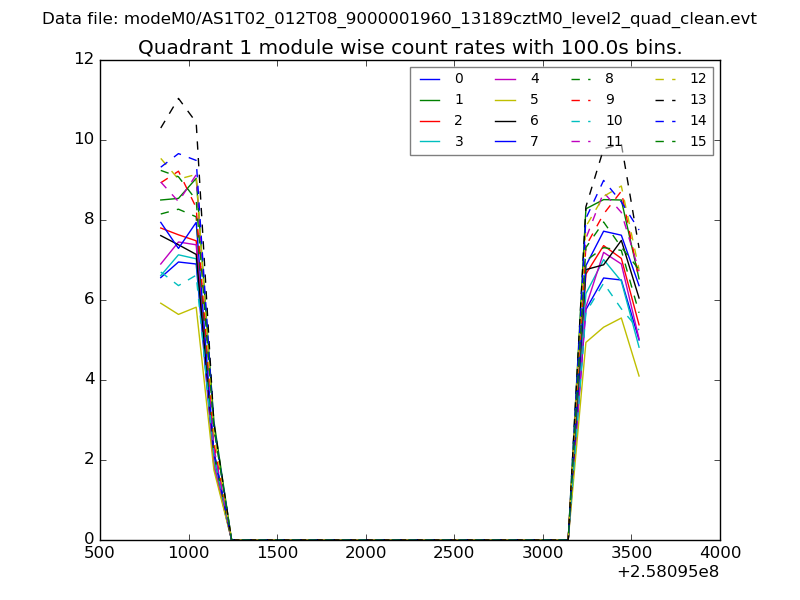
| Module-wise count rates for Quadrant A Data is divided into 100 sec bins |
 |
 |
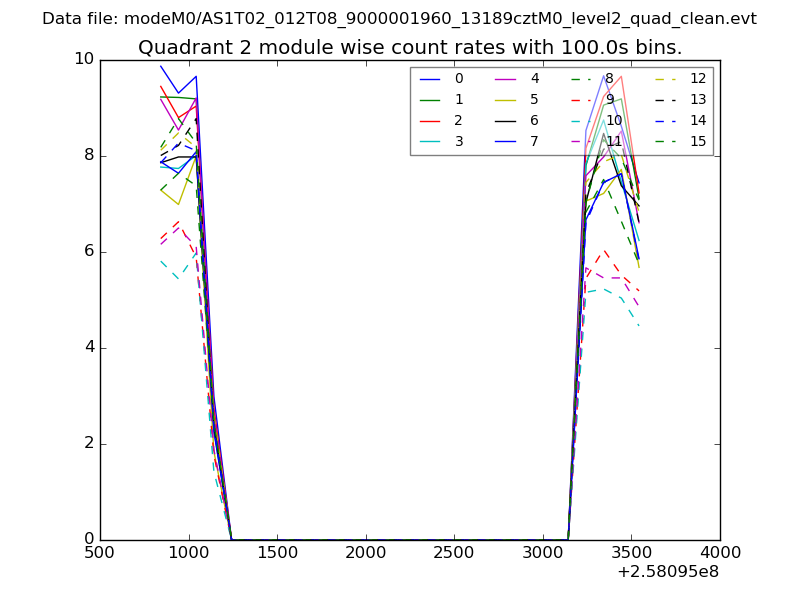
| Module-wise count rates for Quadrant B Data is divided into 100 sec bins |
 |
 |
| Module-wise count rates for Quadrant C Data is divided into 100 sec bins |
 |
 |
| Module-wise count rates for Quadrant D Data is divided into 100 sec bins |
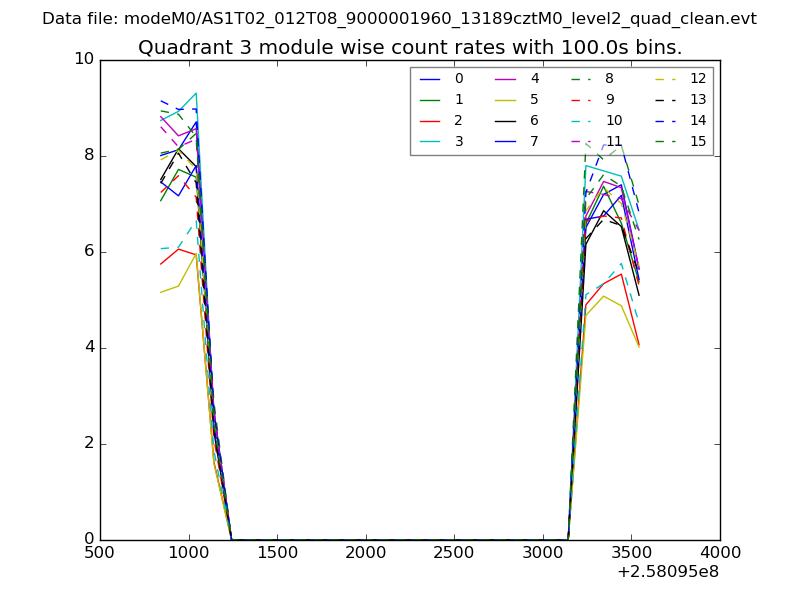 |
 |
| Parameter | Plot |
|---|---|
| CZT HV Monitor | 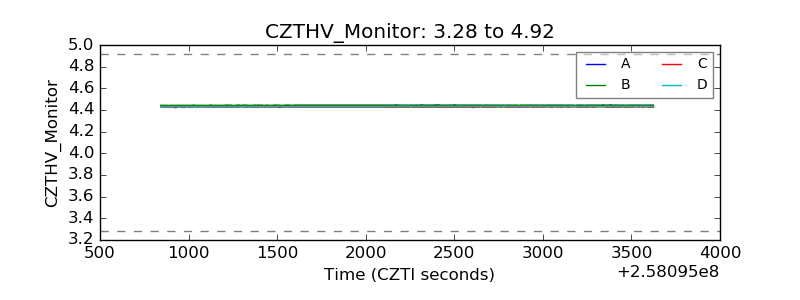 |
| D_VDD | 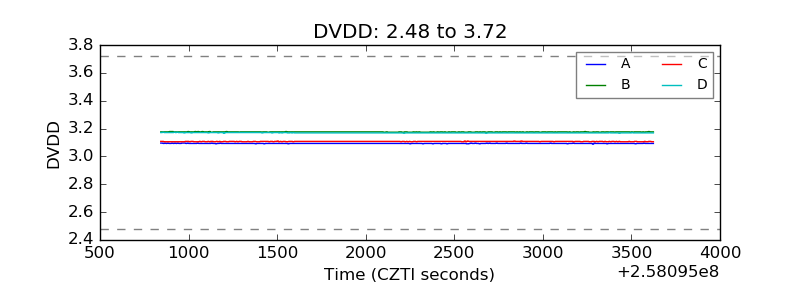 |
| Temperature 1 | 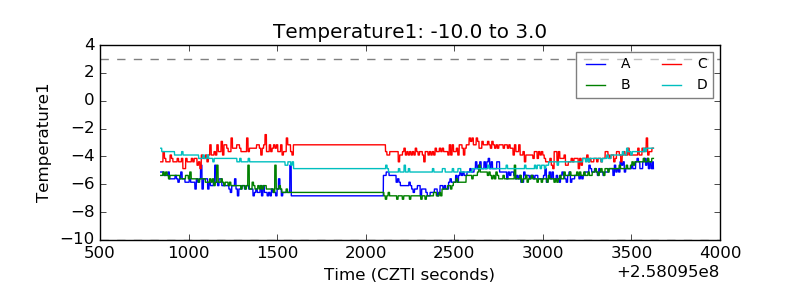 |
| Veto HV Monitor | 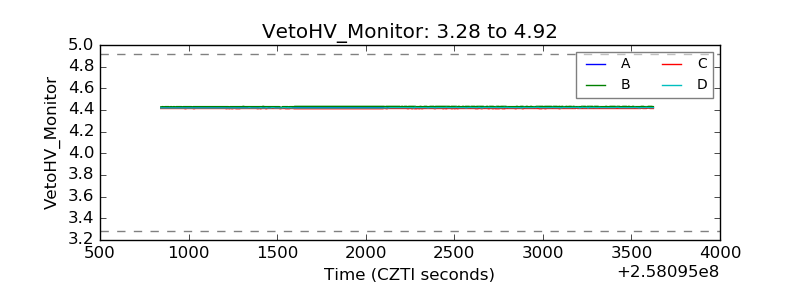 |
| Veto LLD | 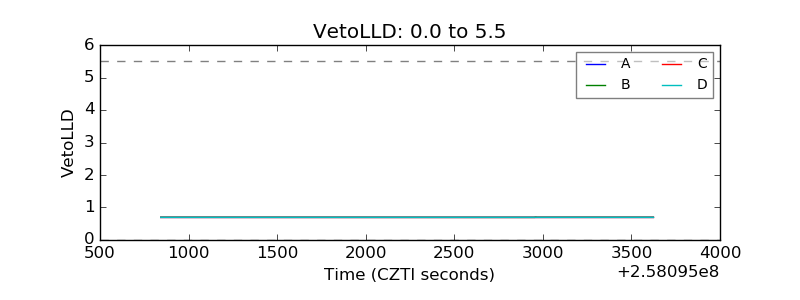 |
| Alpha Counter | 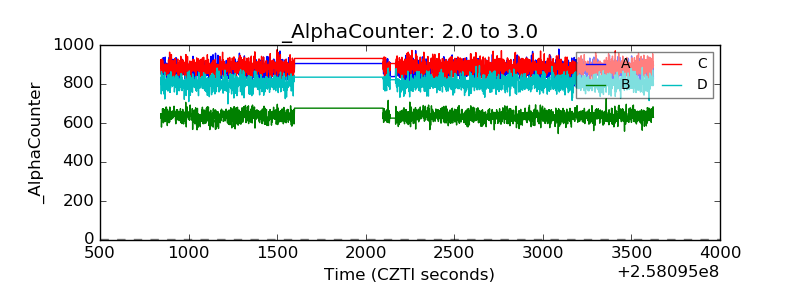 |
| _CPM_Rate | 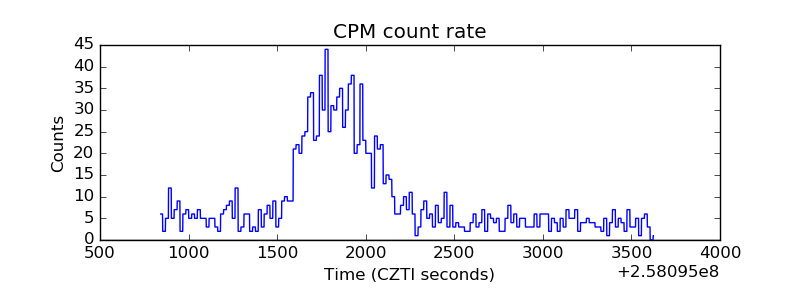 |
| CZT Counter |  |
| +2.5 Volts monitor |  |
| +5 Volts monitor |  |
| _ROLL_ROT | 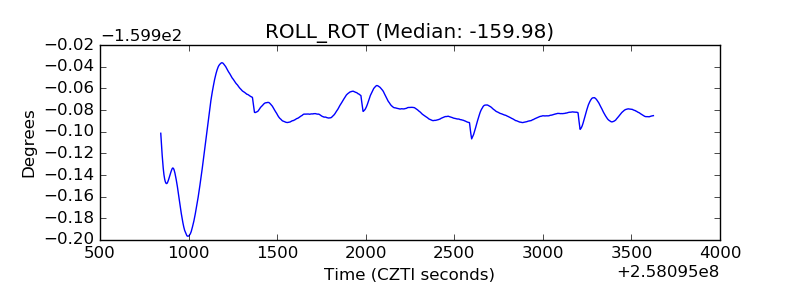 |
| _Roll_DEC | 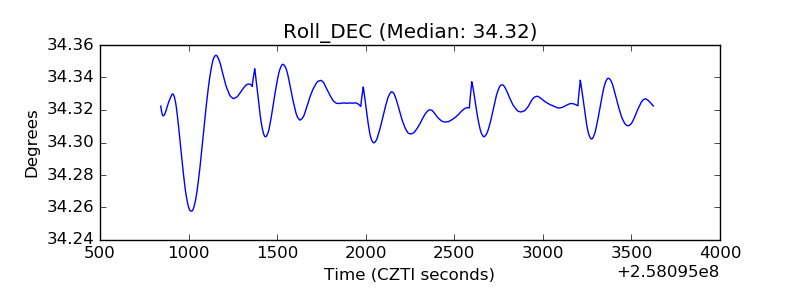 |
| _Roll_RA | 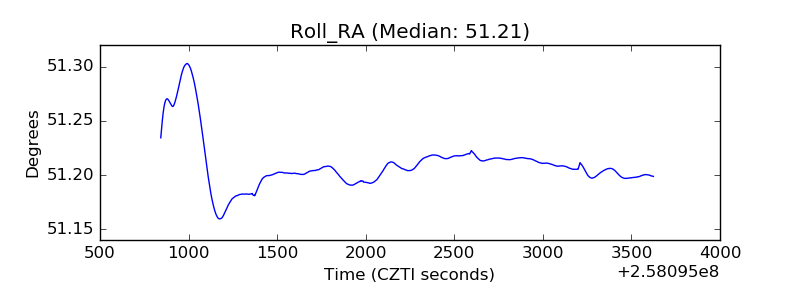 |
| Veto Counter | 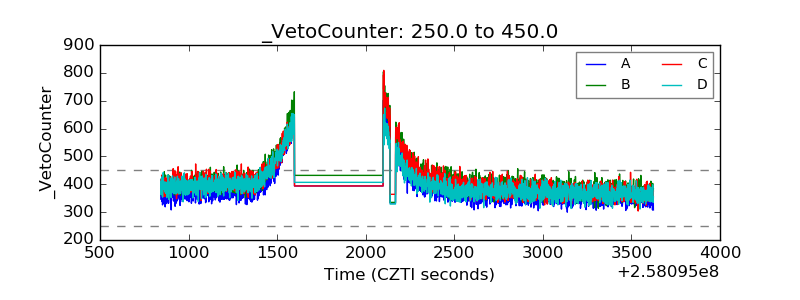 |