| Param | Original file | Final file |
|---|---|---|
| Filename | modeM0/AS1T02_012T08_9000001960_13190cztM0_level2.evt | modeM0/AS1T02_012T08_9000001960_13190cztM0_level2_quad_clean.evt |
| Size (bytes) | 464,290,560 | 66,081,600 |
| Size | 442.8 MB | 63.0 MB |
| Events in quadrant A | 2,260,952 | 439,635 |
| Events in quadrant B | 3,488,053 | 418,256 |
| Events in quadrant C | 2,160,949 | 437,856 |
| Events in quadrant D | 5,817,641 | 360,265 |
| Mode M9 | |||
|---|---|---|---|
| Quadrant | BADHDUFLAG | Total packets | Discarded packets |
| A | 0 | 5 | 0 |
| B | 0 | 5 | 0 |
| C | 0 | 5 | 0 |
| D | 0 | 5 | 0 |
| Mode SS | |||
|---|---|---|---|
| Quadrant | BADHDUFLAG | Total packets | Discarded packets |
| A | 0 | 100 | 0 |
| B | 0 | 100 | 0 |
| C | 0 | 100 | 0 |
| D | 0 | 100 | 0 |
| Mode M0 | |||
|---|---|---|---|
| Quadrant | BADHDUFLAG | Total packets | Discarded packets |
| A | 0 | 10070 | 1 |
| B | 0 | 13610 | 1 |
| C | 0 | 10018 | 1 |
| D | 0 | 20634 | 1 |
| Quadrant | Total seconds | Saturated seconds | Saturation percentage |
|---|---|---|---|
| A | 4906 | 117 | 2.384835% |
| B | 4906 | 529 | 10.782715% |
| C | 4906 | 84 | 1.712189% |
| D | 4906 | 1050 | 21.402364% |
Noise dominated data is calculated using 1-second bins in cleaned event files. If a bin has >2000 counts, and if more than 50% of those come from <1% of pixels, then it is considered to be noise-dominated and hence unusable.
| Quadrant | # 1 sec bins | Bins with >0 counts | Bins with >2000 counts | High rate bins dominated by noise | Noise dominated (total time) | Noise dominated (detector-on time) | Marked lightcurve |
|---|---|---|---|---|---|---|---|
| A | 5437 | 4909 | 0 | 0 | 0.00% | 0.00% | 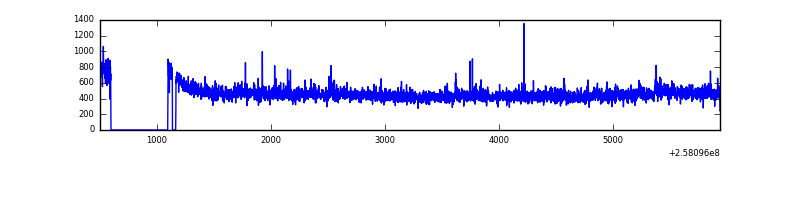 |
| B | 5437 | 4909 | 297 | 297 | 5.46% | 6.05% | 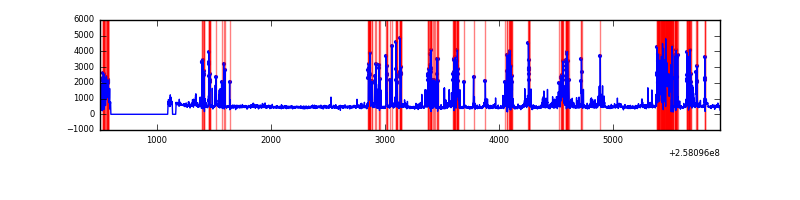 |
| C | 5437 | 4909 | 1 | 1 | 0.02% | 0.02% |  |
| D | 5437 | 4909 | 879 | 879 | 16.17% | 17.91% |  |
Top three noisy pixels from each quadrant. If the there are fewer than three noisy pixels in the level2.evt file, extra rows are filled as -1
| Pixel properties | Quadrant properties | ||||||
|---|---|---|---|---|---|---|---|
| Quadrant | DetID | PixID | Counts | Sigma | Mean | Median | Sigma |
| A | 4 | 2 | 22117 | 184.95 | 566 | 552 | 116.6 |
| A | 8 | 15 | 19197 | 159.9 | 566 | 552 | 116.6 |
| A | 1 | 162 | 19027 | 158.45 | 566 | 552 | 116.6 |
| B | 4 | 239 | 1165599 | 11429.83 | 530 | 516 | 101.9 |
| B | 0 | 197 | 97453 | 950.98 | 530 | 516 | 101.9 |
| B | 3 | 64 | 70566 | 687.21 | 530 | 516 | 101.9 |
| C | 15 | 208 | 12132 | 89.84 | 551 | 553 | 128.9 |
| C | 13 | 61 | 3883 | 25.84 | 551 | 553 | 128.9 |
| C | 8 | 222 | 1723 | 9.08 | 551 | 553 | 128.9 |
| D | 13 | 122 | 2145990 | 17533.83 | 505 | 490 | 122.4 |
| D | 1 | 52 | 1667951 | 13627.11 | 505 | 490 | 122.4 |
| D | 13 | 104 | 35904 | 289.42 | 505 | 490 | 122.4 |
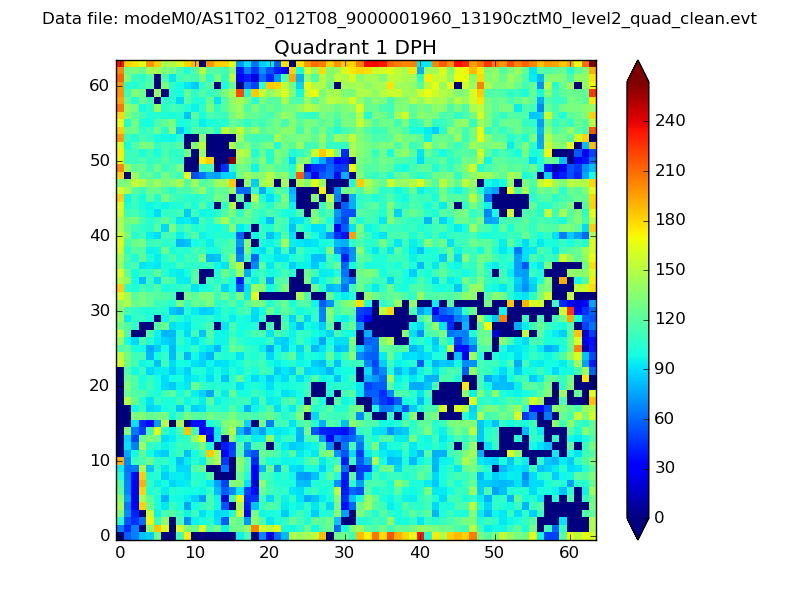
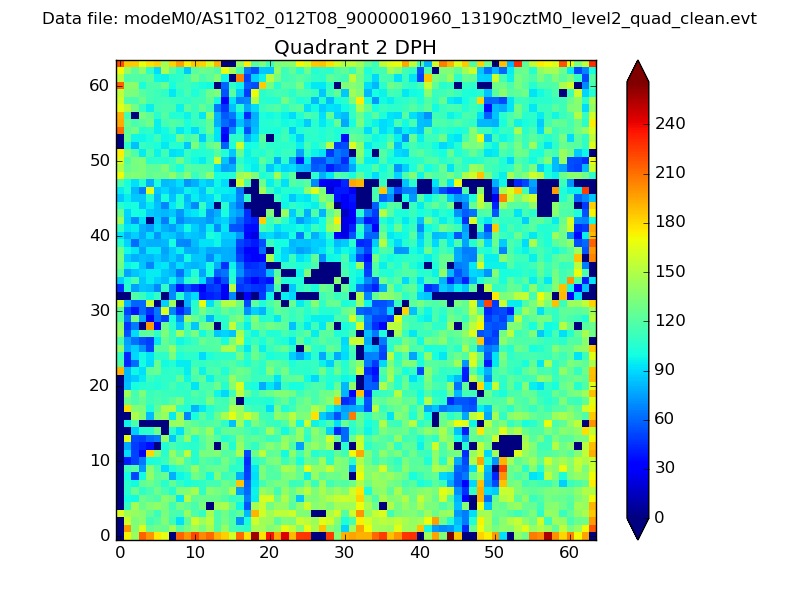
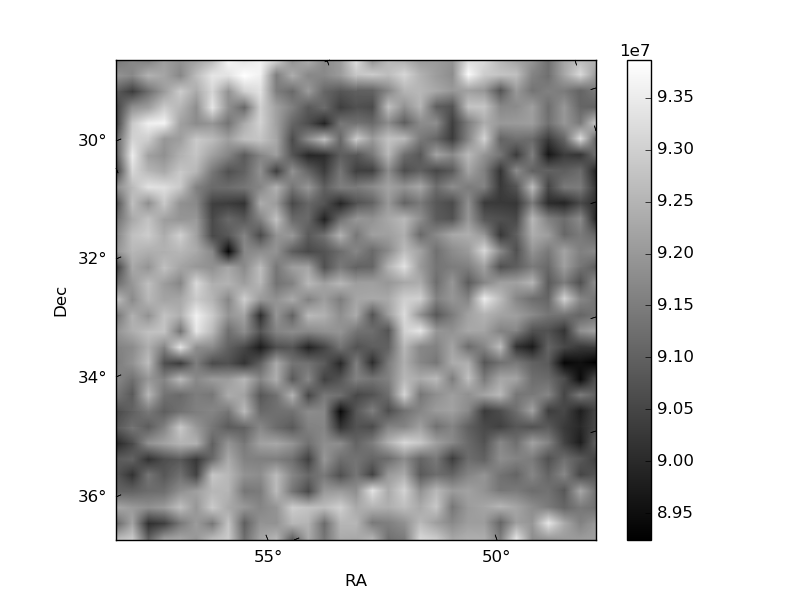
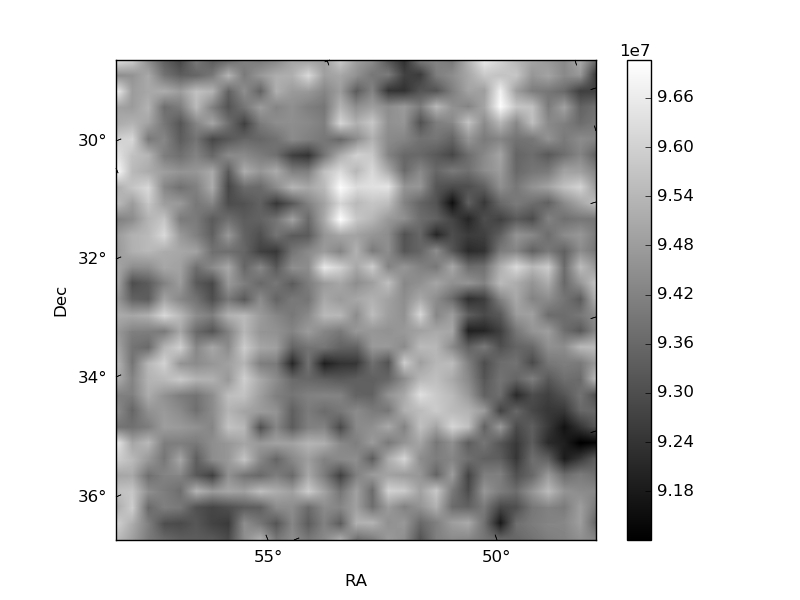
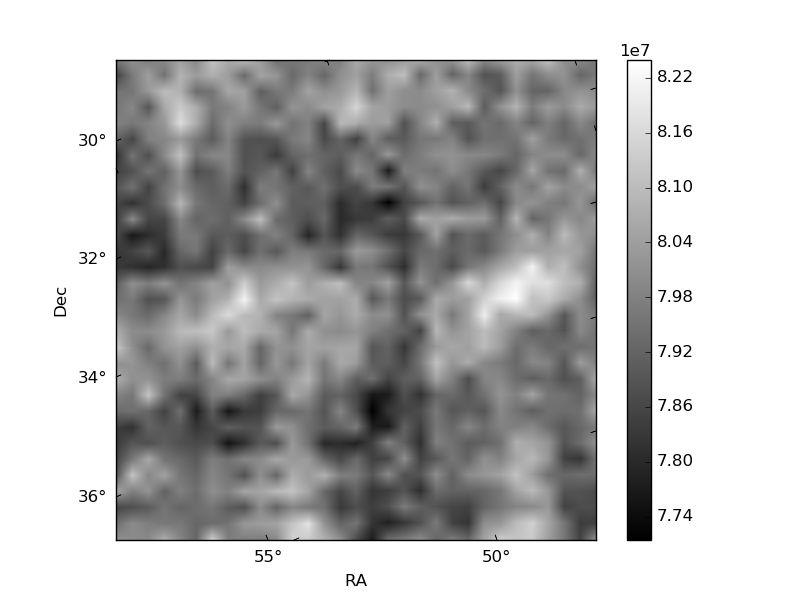
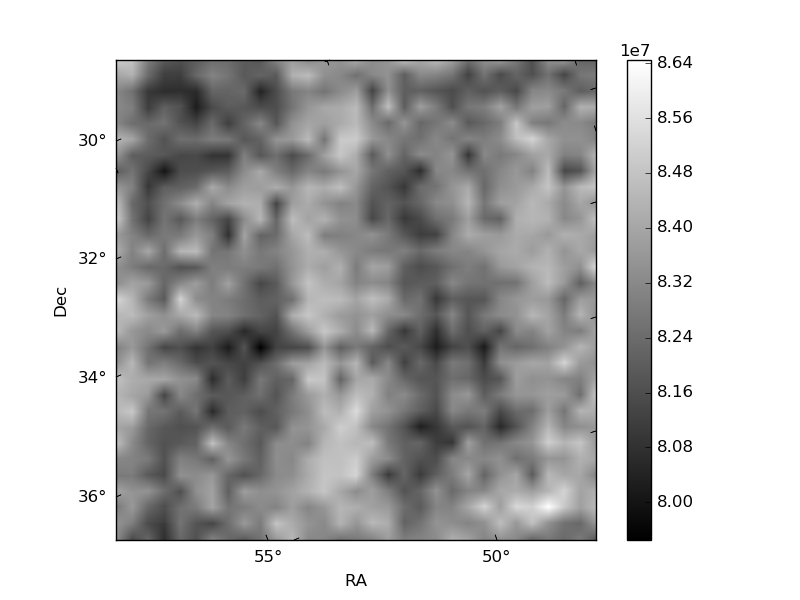
Histogram calculated using DETX and DETY for each event in the final _common_clean file
| Quadrant A | 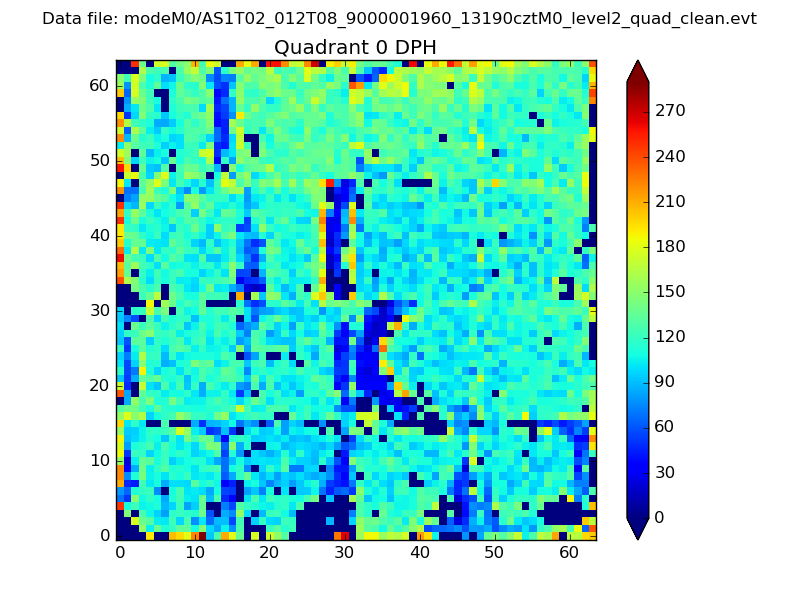 |
 |
Quadrant B |
|---|---|---|---|
| Quadrant D | 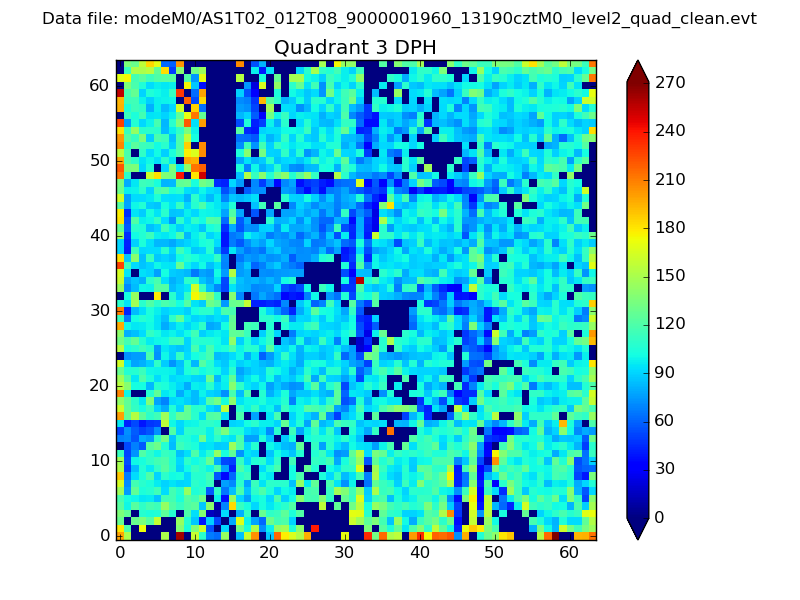 |
 |
Quadrant C |
| Plot type | Count rate plots | Images |
|---|---|---|
| Comparison with Poisson distribution Blue bars denote a histogram of data divided into 1 sec bins. Red curve is a Poisson curve with rate = median count rate of data. |
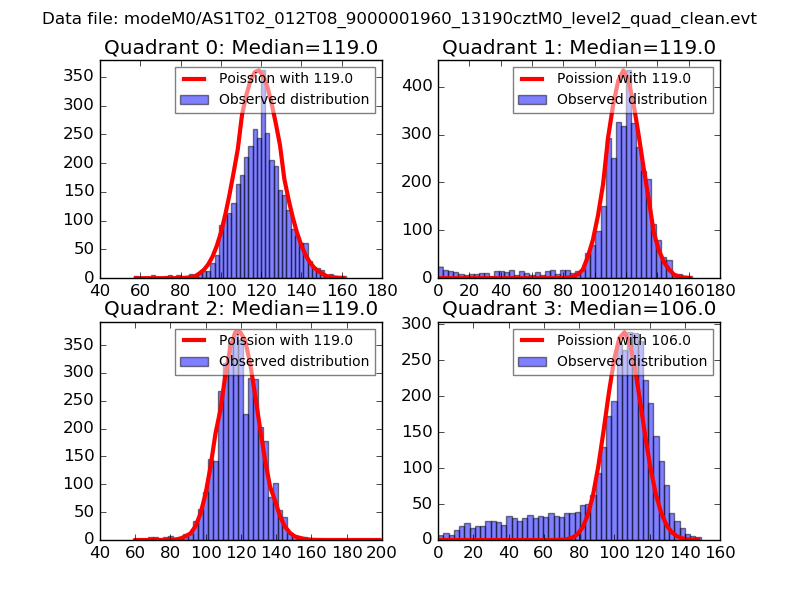 |
 |
| Quadrant-wise count rates Data is divided into 100 sec bins |
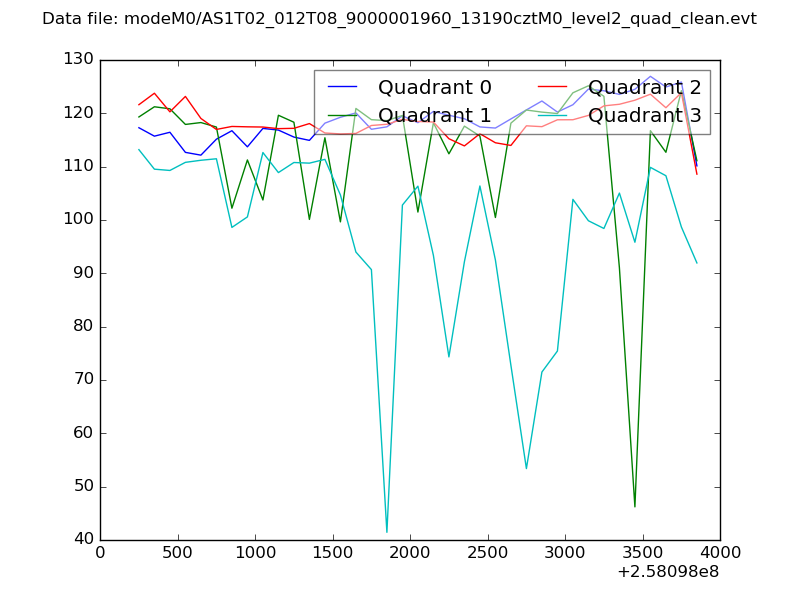 |
|
| Module-wise count rates for Quadrant A Data is divided into 100 sec bins |
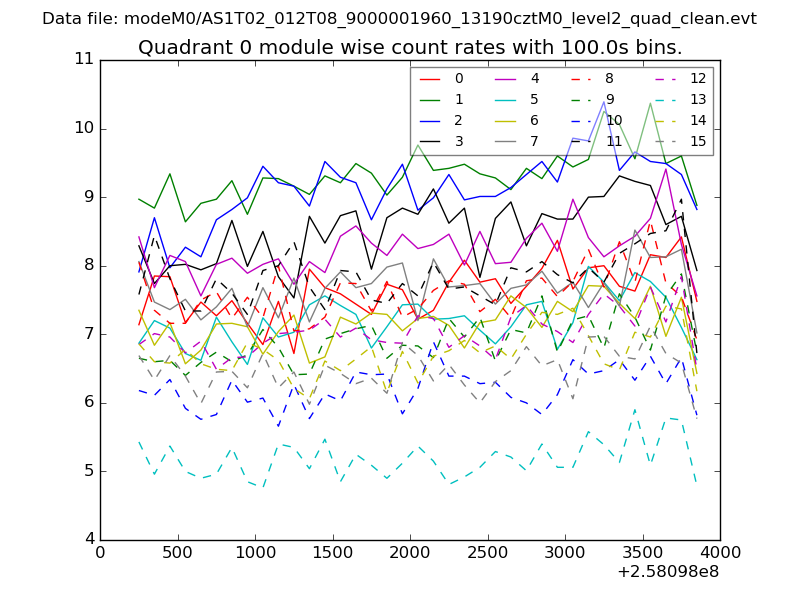 |
 |
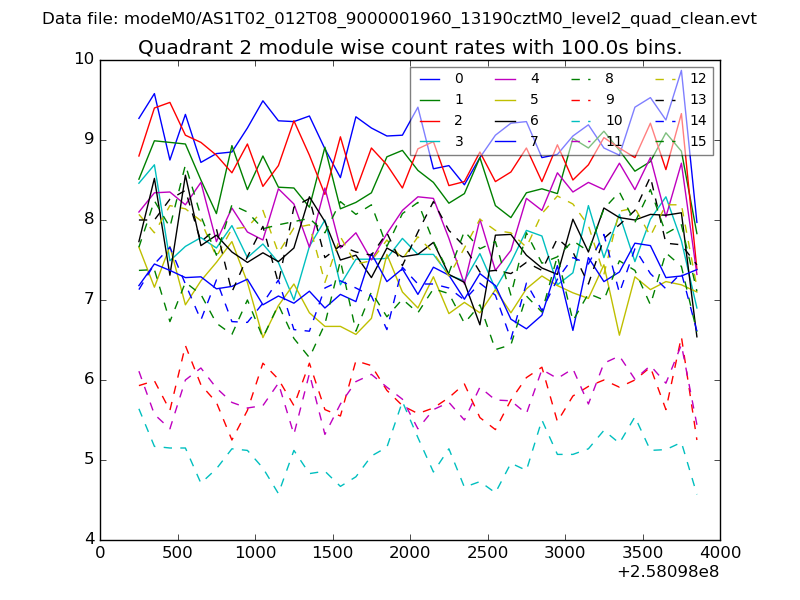
| Module-wise count rates for Quadrant B Data is divided into 100 sec bins |
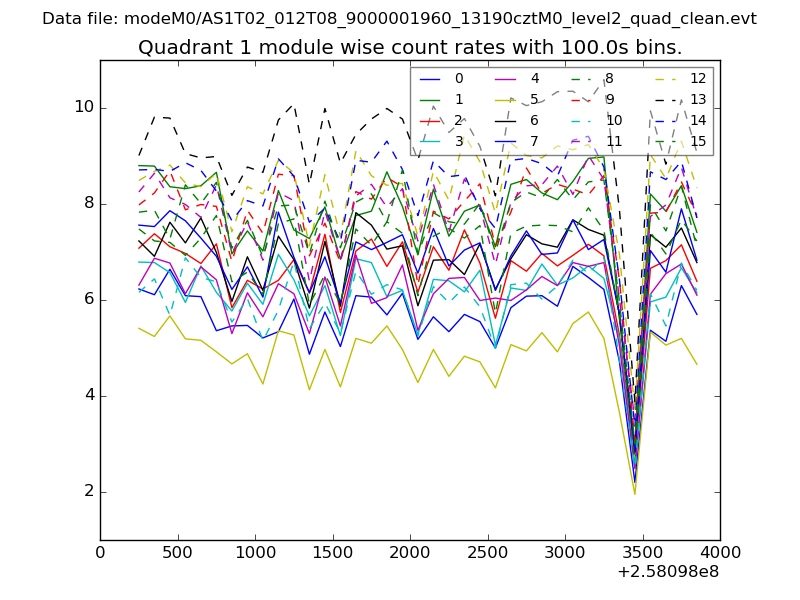 |
 |
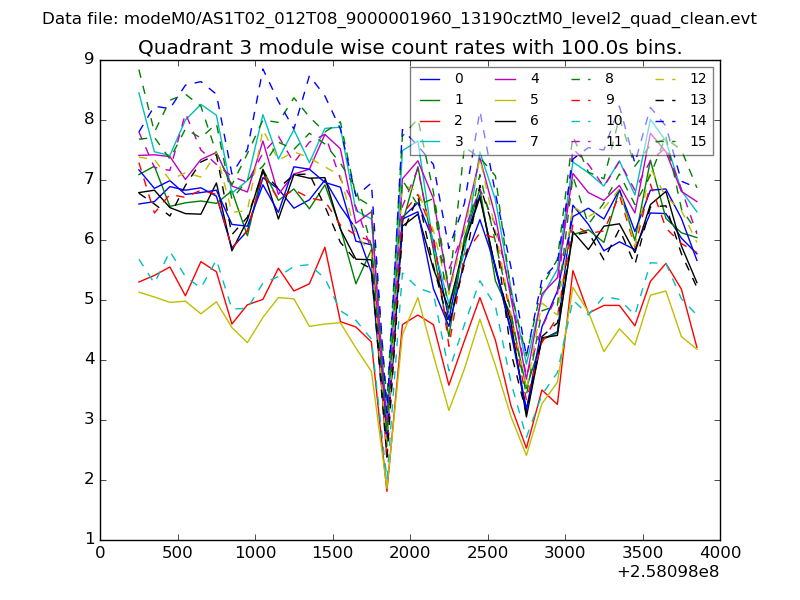
| Module-wise count rates for Quadrant C Data is divided into 100 sec bins |
 |
 |
| Module-wise count rates for Quadrant D Data is divided into 100 sec bins |
 |
 |
| Parameter | Plot |
|---|---|
| CZT HV Monitor | 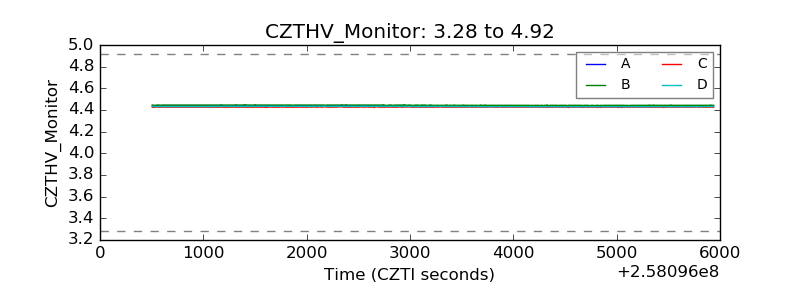 |
| D_VDD | 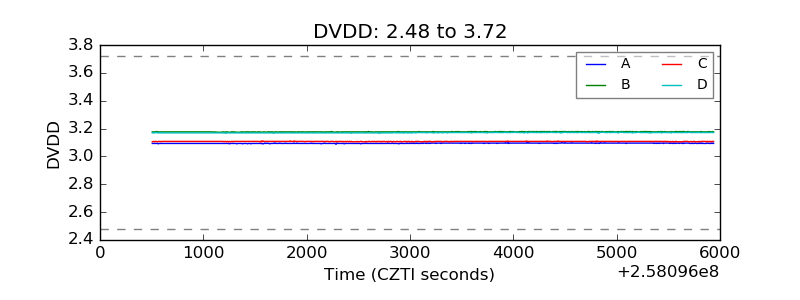 |
| Temperature 1 | 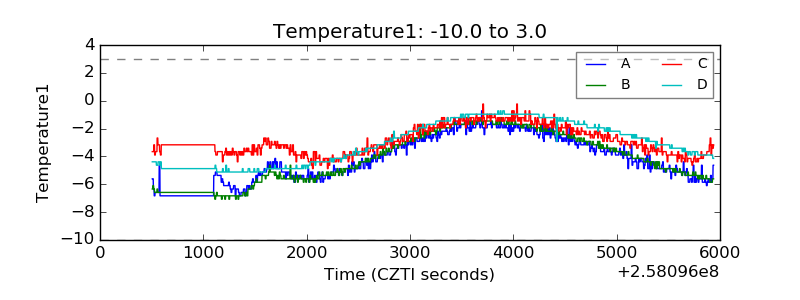 |
| Veto HV Monitor | 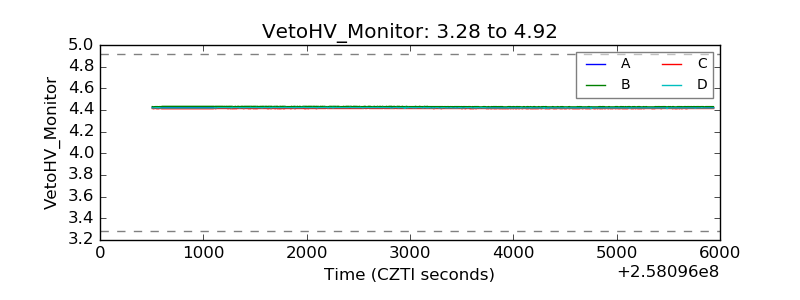 |
| Veto LLD | 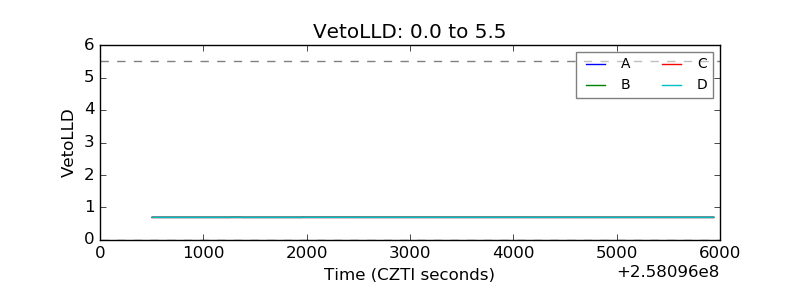 |
| Alpha Counter | 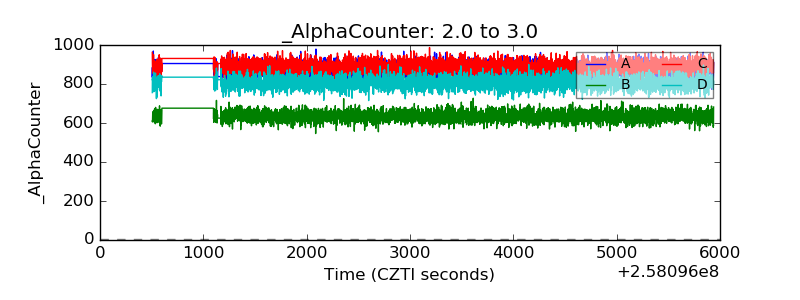 |
| _CPM_Rate | 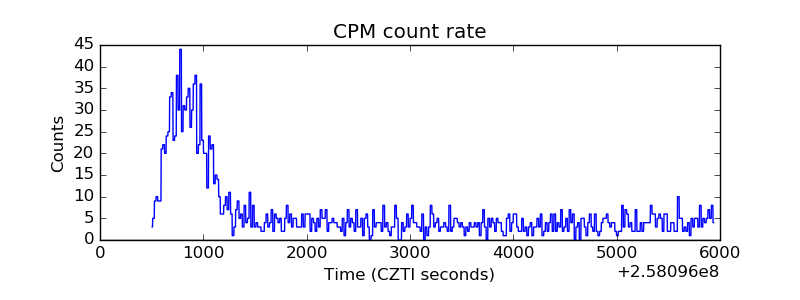 |
| CZT Counter | 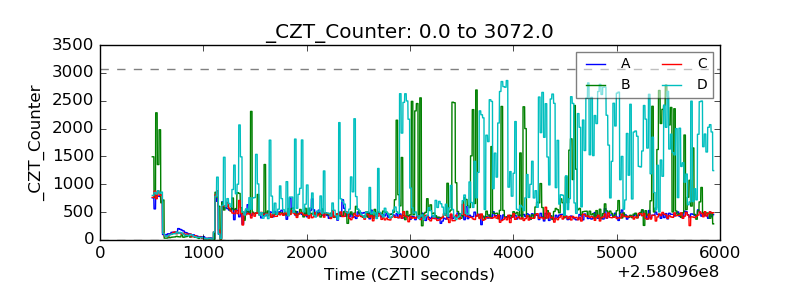 |
| +2.5 Volts monitor |  |
| +5 Volts monitor | 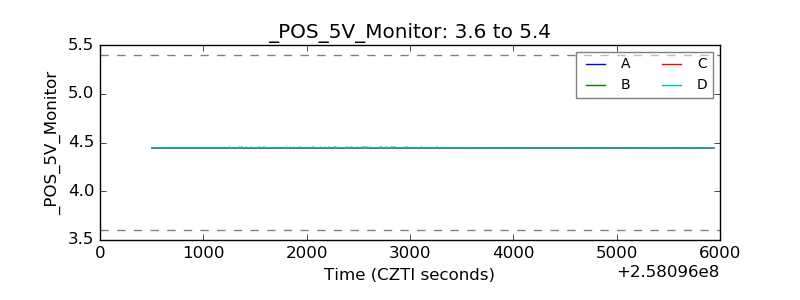 |
| _ROLL_ROT | 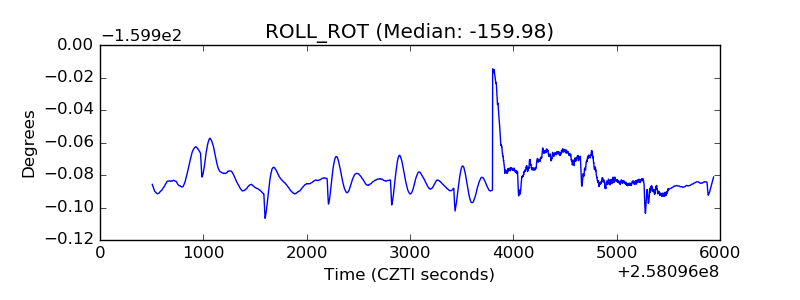 |
| _Roll_DEC | 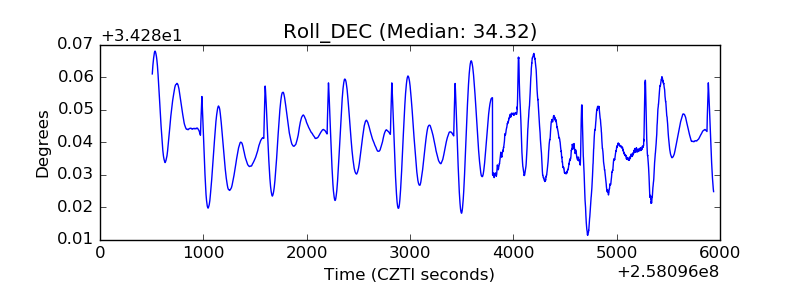 |
| _Roll_RA | 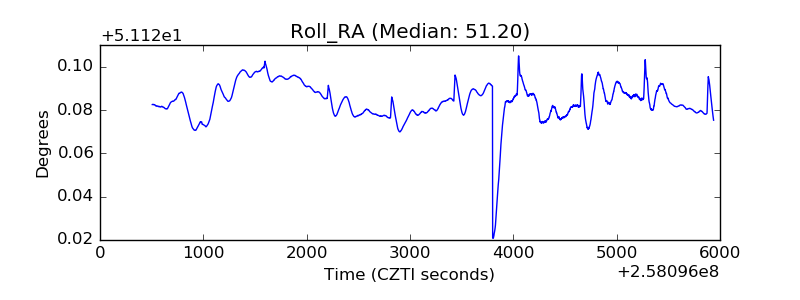 |
| Veto Counter | 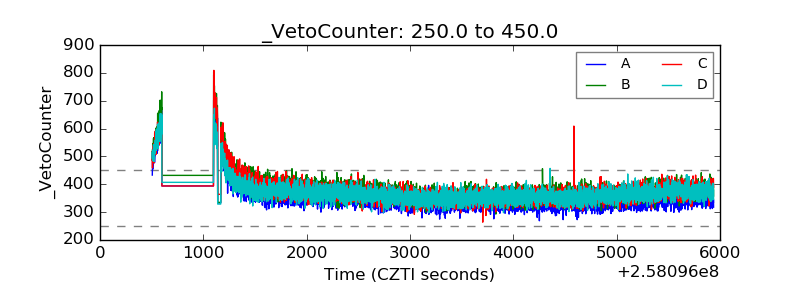 |