| Param | Original file | Final file |
|---|---|---|
| Filename | modeM0/AS1A04_216T01_9000001968cztM0_level2.fits | modeM0/AS1A04_216T01_9000001968cztM0_level2_quad_clean.evt |
| Size (bytes) | 1,108,221,120 | 1,154,698,560 |
| Size | 1.0 GB | 1.1 GB |
| Events in quadrant A | 6,743,616 | 7,184,376 |
| Events in quadrant B | 6,212,038 | 6,528,282 |
| Events in quadrant C | 6,739,196 | 6,899,229 |
| Events in quadrant D | 5,706,300 | 6,205,267 |
| Mode M0 | |||
|---|---|---|---|
| Quadrant | BADHDUFLAG | Total packets | Discarded packets |
| A | 0 | 252556 | 0 |
| B | 0 | 332608 | 0 |
| C | 0 | 245440 | 0 |
| D | 0 | 291624 | 0 |
| Mode M9 | |||
|---|---|---|---|
| Quadrant | BADHDUFLAG | Total packets | Discarded packets |
| A | 0 | 205 | 0 |
| B | 0 | 205 | 0 |
| C | 0 | 205 | 0 |
| D | 0 | 205 | 0 |
| Mode SS | |||
|---|---|---|---|
| Quadrant | BADHDUFLAG | Total packets | Discarded packets |
| A | 0 | 2422 | 0 |
| B | 0 | 2422 | 0 |
| C | 0 | 2422 | 0 |
| D | 0 | 2422 | 0 |
| Quadrant | Total seconds | Saturated seconds | Saturation percentage |
|---|---|---|---|
| A | 119015 | 1934 | 1.625005% |
| B | 119015 | 13233 | 11.118767% |
| C | 119015 | 1385 | 1.163719% |
| D | 119015 | 3734 | 3.137420% |
Noise dominated data is calculated using 1-second bins in cleaned event files. If a bin has >2000 counts, and if more than 50% of those come from <1% of pixels, then it is considered to be noise-dominated and hence unusable.
| Quadrant | # 1 sec bins | Bins with >0 counts | Bins with >2000 counts | High rate bins dominated by noise | Noise dominated (total time) | Noise dominated (detector-on time) | Marked lightcurve |
|---|---|---|---|---|---|---|---|
| A | 139200 | 119011 | 0 | 0 | 0.00% | 0.00% |  |
| B | 139200 | 117895 | 0 | 0 | 0.00% | 0.00% |  |
| C | 139200 | 119015 | 0 | 0 | 0.00% | 0.00% |  |
| D | 139200 | 119010 | 0 | 0 | 0.00% | 0.00% |  |
Top three noisy pixels from each quadrant. If the there are fewer than three noisy pixels in the level2.evt file, extra rows are filled as -1
| Pixel properties | Quadrant properties | ||||||
|---|---|---|---|---|---|---|---|
| Quadrant | DetID | PixID | Counts | Sigma | Mean | Median | Sigma |
| A | 0 | 29 | 6560 | 11.34 | 1756 | 1647 | 433.4 |
| A | 7 | 110 | 5596 | 9.11 | 1756 | 1647 | 433.4 |
| A | 0 | 30 | 5060 | 7.87 | 1756 | 1647 | 433.4 |
| B | 2 | 9 | 5418 | 12.2 | 1637 | 1566 | 315.8 |
| B | 3 | 17 | 4127 | 8.11 | 1637 | 1566 | 315.8 |
| B | 14 | 254 | 4072 | 7.94 | 1637 | 1566 | 315.8 |
| C | 12 | 241 | 4886 | 7.04 | 1780 | 1666 | 457.1 |
| C | 2 | 191 | 4605 | 6.43 | 1780 | 1666 | 457.1 |
| C | 7 | 111 | 4464 | 6.12 | 1780 | 1666 | 457.1 |
| D | 3 | 14 | 4286 | 6.47 | 1627 | 1481 | 433.7 |
| D | 6 | 231 | 4099 | 6.04 | 1627 | 1481 | 433.7 |
| D | 10 | 189 | 4020 | 5.85 | 1627 | 1481 | 433.7 |
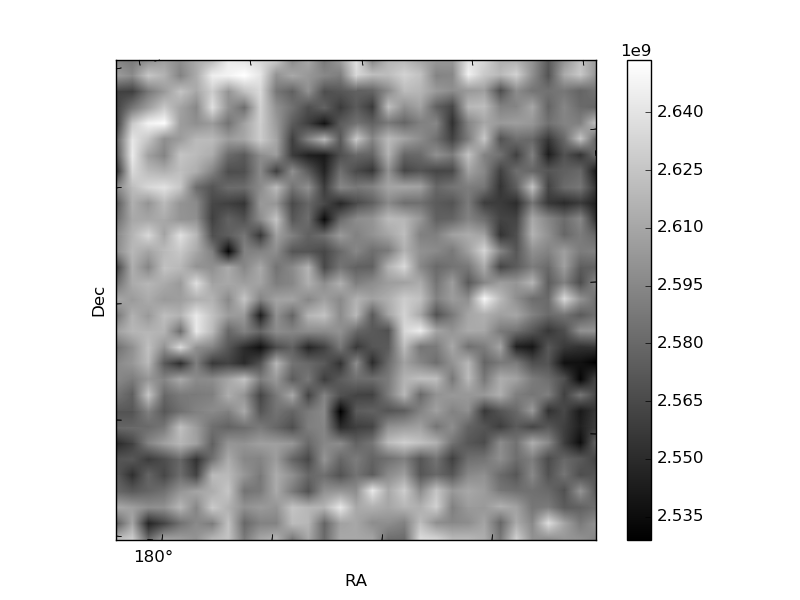
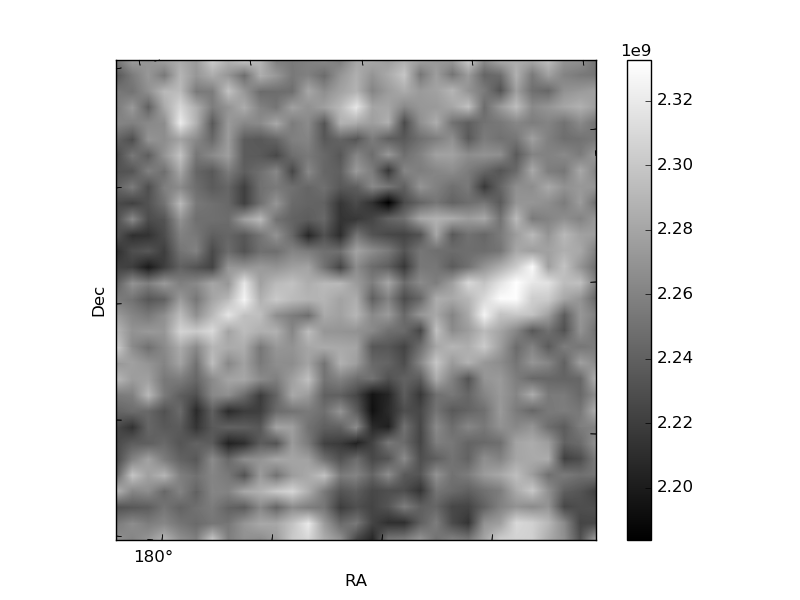
Histogram calculated using DETX and DETY for each event in the final _common_clean file
| Quadrant A | 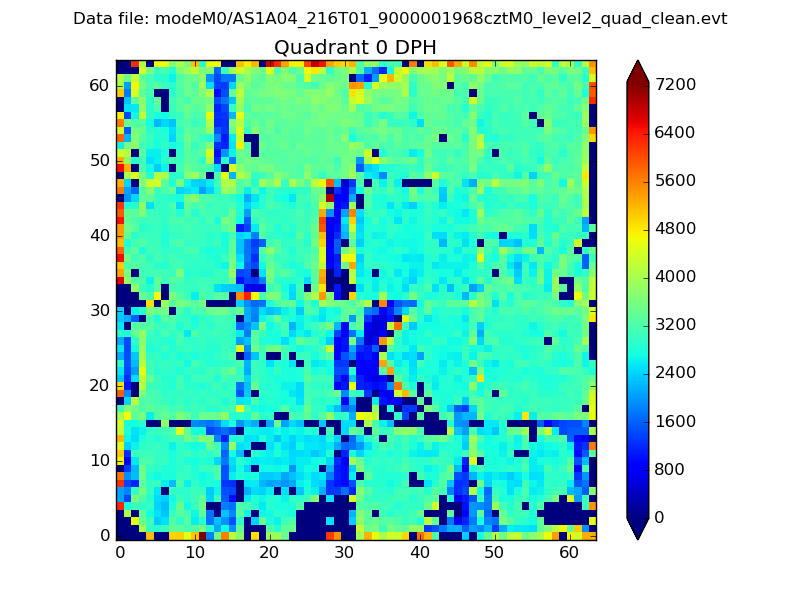 |
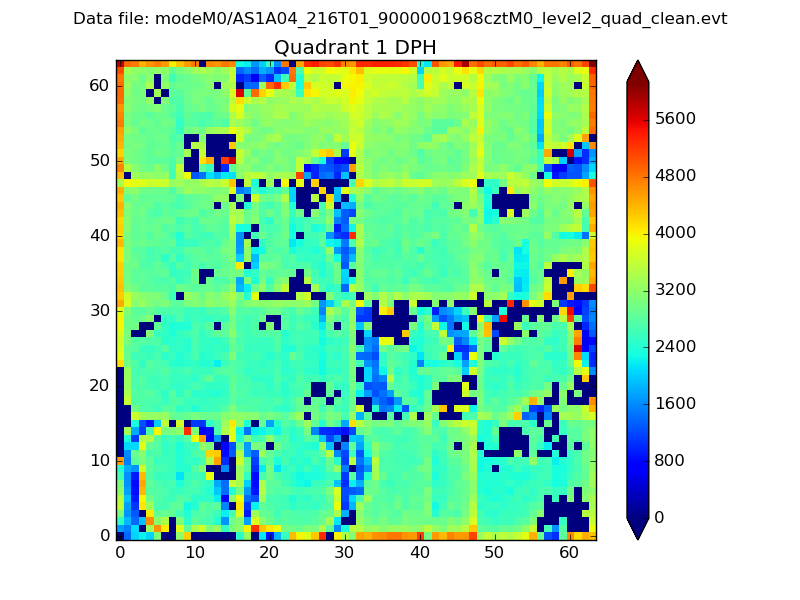 |
Quadrant B |
|---|---|---|---|
| Quadrant D |  |
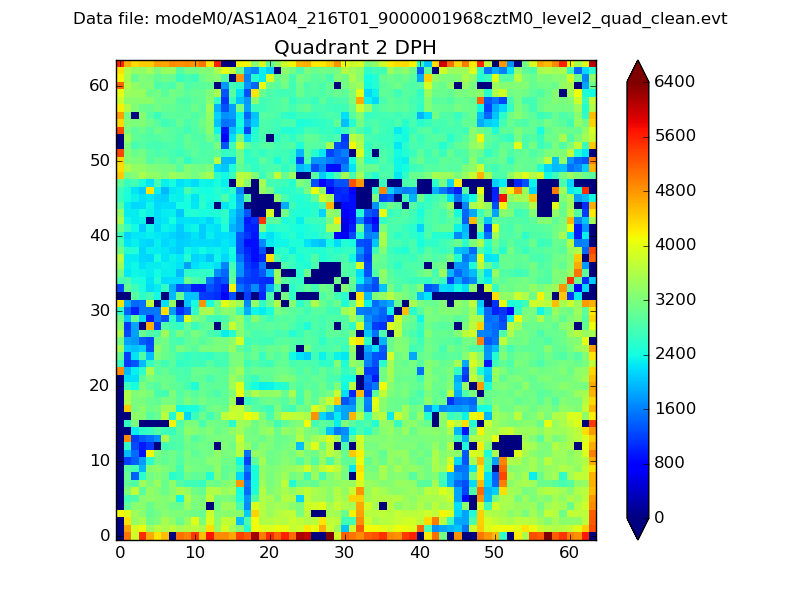 |
Quadrant C |
| Plot type | Count rate plots | Images |
|---|---|---|
| Comparison with Poisson distribution Blue bars denote a histogram of data divided into 1 sec bins. Red curve is a Poisson curve with rate = median count rate of data. |
 |
 |
| Quadrant-wise count rates Data is divided into 100 sec bins |
 |
|
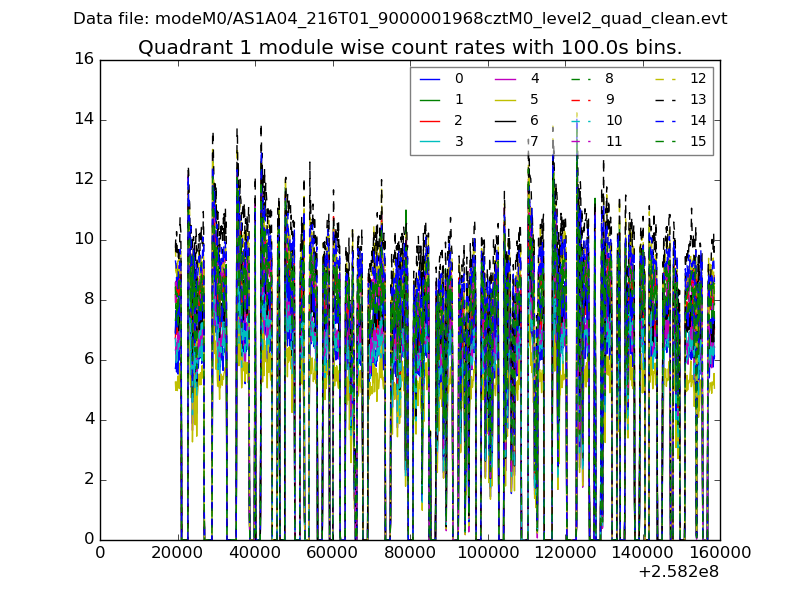
| Module-wise count rates for Quadrant A Data is divided into 100 sec bins |
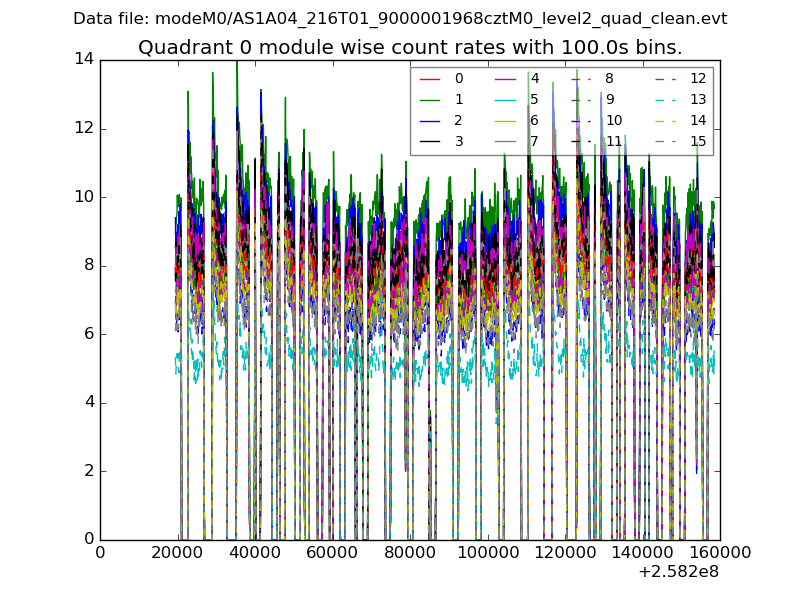 |
 |
| Module-wise count rates for Quadrant B Data is divided into 100 sec bins |
 |
 |
| Module-wise count rates for Quadrant C Data is divided into 100 sec bins |
 |
 |
| Module-wise count rates for Quadrant D Data is divided into 100 sec bins |
 |
 |
| Parameter | Plot |
|---|---|
| CZT HV Monitor | 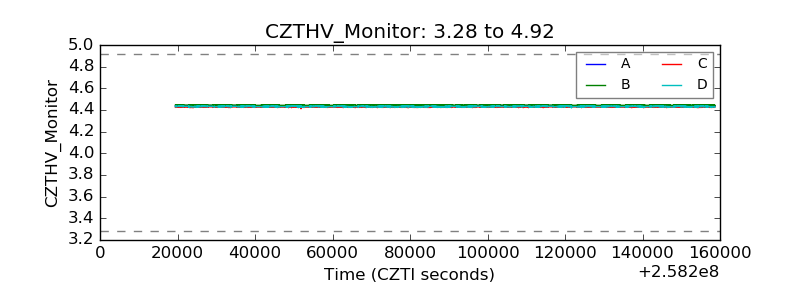 |
| D_VDD | 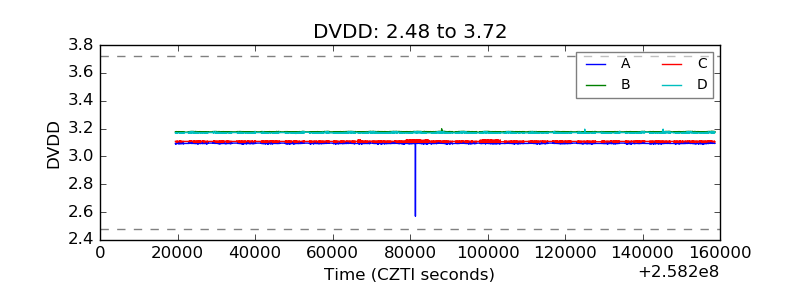 |
| Temperature 1 |  |
| Veto HV Monitor |  |
| Veto LLD | 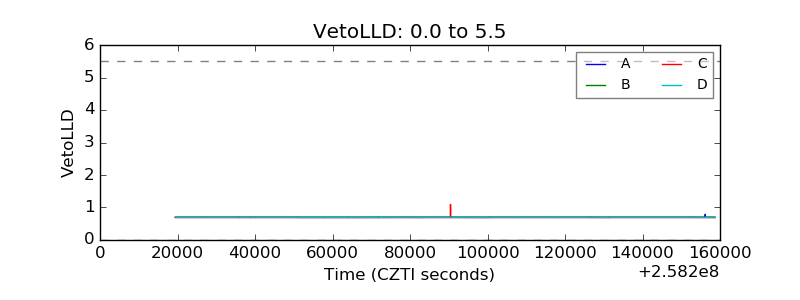 |
| Alpha Counter |  |
| _CPM_Rate | 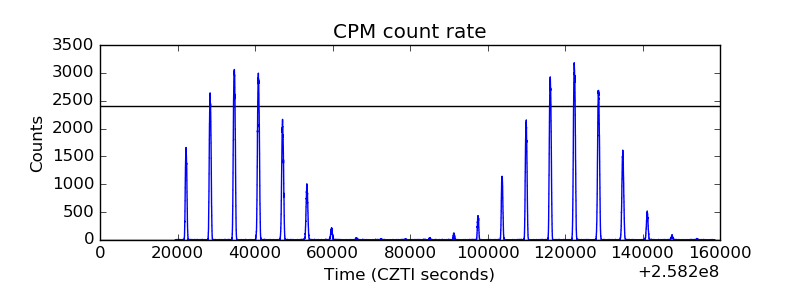 |
| CZT Counter |  |
| +2.5 Volts monitor | 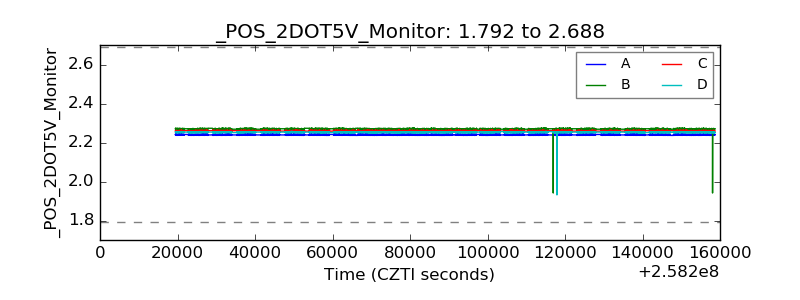 |
| +5 Volts monitor | 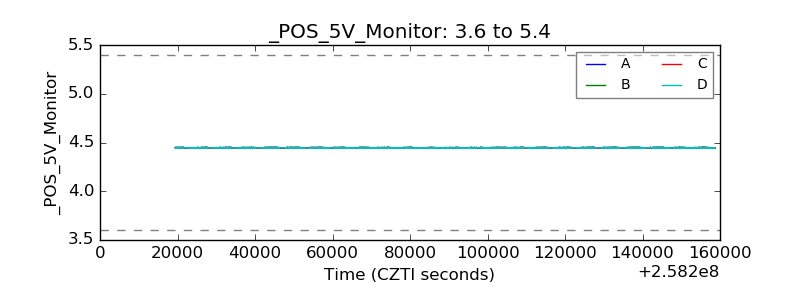 |
| _ROLL_ROT |  |
| _Roll_DEC | 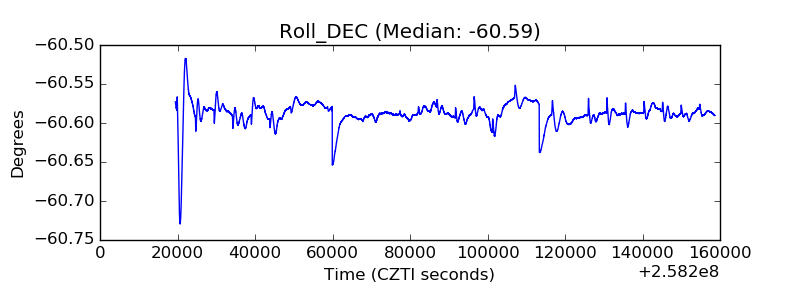 |
| _Roll_RA | 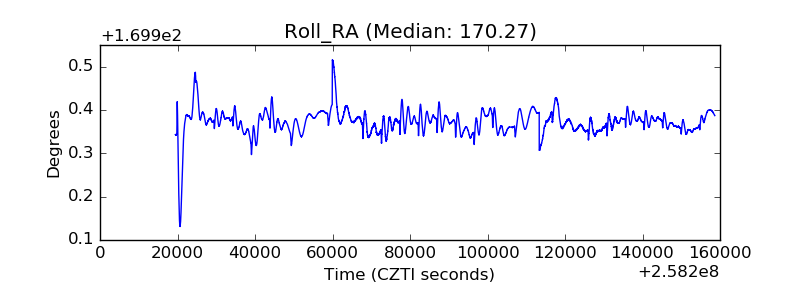 |
| Veto Counter | 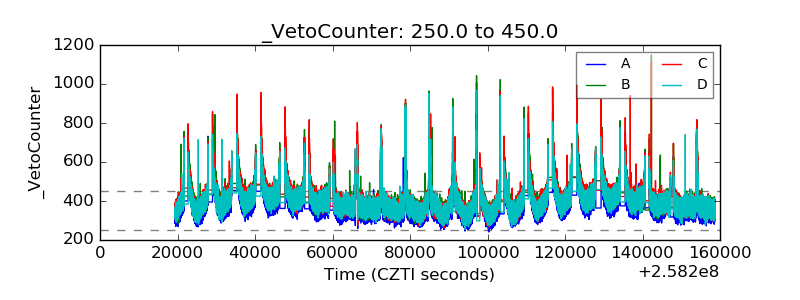 |