| Param | Original file | Final file |
|---|---|---|
| Filename | modeM0/AS1A04_216T01_9000001968_13210cztM0_level2.evt | modeM0/AS1A04_216T01_9000001968_13210cztM0_level2_quad_clean.evt |
| Size (bytes) | 282,058,560 | 61,755,840 |
| Size | 269.0 MB | 58.9 MB |
| Events in quadrant A | 1,845,961 | 411,585 |
| Events in quadrant B | 2,651,694 | 397,943 |
| Events in quadrant C | 1,797,021 | 405,045 |
| Events in quadrant D | 1,985,381 | 384,331 |
| Mode M0 | |||
|---|---|---|---|
| Quadrant | BADHDUFLAG | Total packets | Discarded packets |
| A | 0 | 7996 | 2 |
| B | 0 | 10457 | 1 |
| C | 0 | 7901 | 1 |
| D | 0 | 8352 | 1 |
| Mode M9 | |||
|---|---|---|---|
| Quadrant | BADHDUFLAG | Total packets | Discarded packets |
| A | 0 | 10 | 0 |
| B | 0 | 10 | 0 |
| C | 0 | 10 | 0 |
| D | 0 | 10 | 0 |
| Mode SS | |||
|---|---|---|---|
| Quadrant | BADHDUFLAG | Total packets | Discarded packets |
| A | 0 | 80 | 0 |
| B | 0 | 80 | 0 |
| C | 0 | 80 | 0 |
| D | 0 | 80 | 0 |
| Quadrant | Total seconds | Saturated seconds | Saturation percentage |
|---|---|---|---|
| A | 3831 | 52 | 1.357348% |
| B | 3831 | 311 | 8.117985% |
| C | 3831 | 28 | 0.730880% |
| D | 3831 | 55 | 1.435656% |
Noise dominated data is calculated using 1-second bins in cleaned event files. If a bin has >2000 counts, and if more than 50% of those come from <1% of pixels, then it is considered to be noise-dominated and hence unusable.
| Quadrant | # 1 sec bins | Bins with >0 counts | Bins with >2000 counts | High rate bins dominated by noise | Noise dominated (total time) | Noise dominated (detector-on time) | Marked lightcurve |
|---|---|---|---|---|---|---|---|
| A | 4877 | 3833 | 0 | 0 | 0.00% | 0.00% | 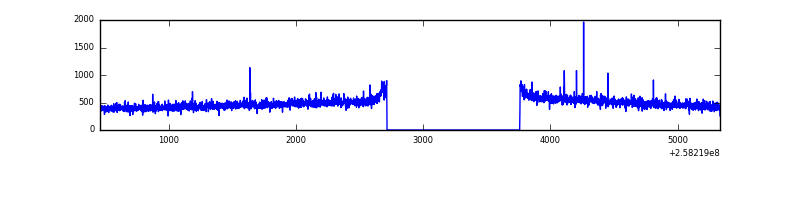 |
| B | 4877 | 3833 | 179 | 179 | 3.67% | 4.67% | 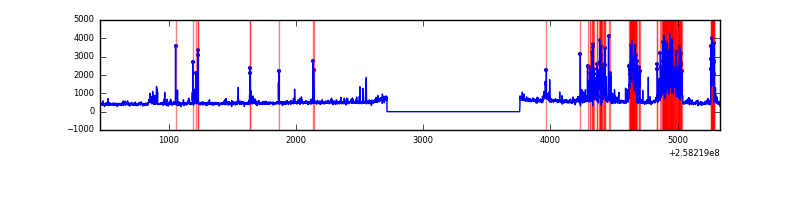 |
| C | 4877 | 3833 | 0 | 0 | 0.00% | 0.00% | 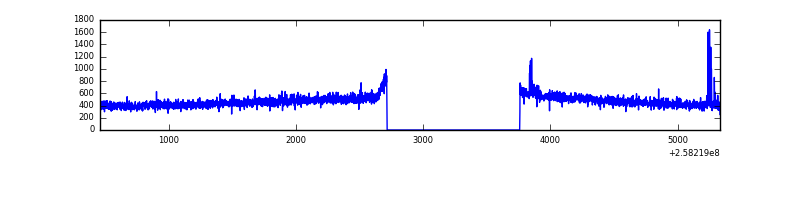 |
| D | 4877 | 3833 | 19 | 19 | 0.39% | 0.50% | 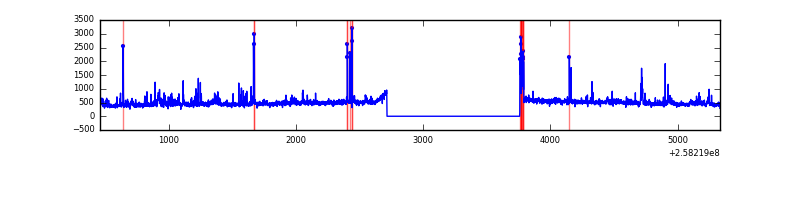 |
Top three noisy pixels from each quadrant. If the there are fewer than three noisy pixels in the level2.evt file, extra rows are filled as -1
| Pixel properties | Quadrant properties | ||||||
|---|---|---|---|---|---|---|---|
| Quadrant | DetID | PixID | Counts | Sigma | Mean | Median | Sigma |
| A | 8 | 15 | 31681 | 327.35 | 467 | 457 | 95.4 |
| A | 4 | 2 | 8534 | 84.68 | 467 | 457 | 95.4 |
| A | 1 | 162 | 6471 | 63.05 | 467 | 457 | 95.4 |
| B | 4 | 239 | 752617 | 8610.33 | 456 | 444 | 87.4 |
| B | 3 | 64 | 48684 | 552.22 | 456 | 444 | 87.4 |
| B | 3 | 209 | 14680 | 162.96 | 456 | 444 | 87.4 |
| C | 15 | 208 | 21814 | 201.74 | 454 | 457 | 105.9 |
| C | 13 | 61 | 3413 | 27.92 | 454 | 457 | 105.9 |
| C | 8 | 222 | 2142 | 15.92 | 454 | 457 | 105.9 |
| D | 1 | 52 | 197481 | 1823.33 | 448 | 434 | 108.1 |
| D | 10 | 157 | 36434 | 333.12 | 448 | 434 | 108.1 |
| D | 8 | 195 | 30258 | 275.97 | 448 | 434 | 108.1 |
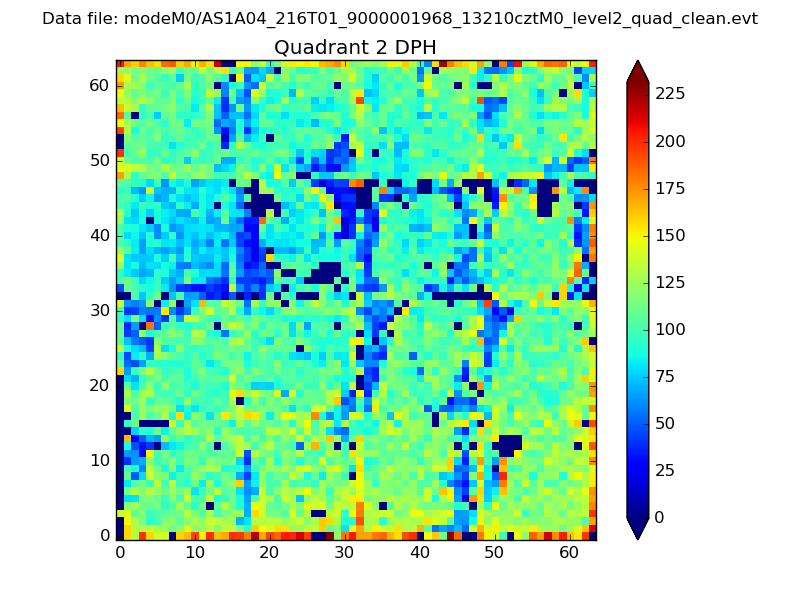
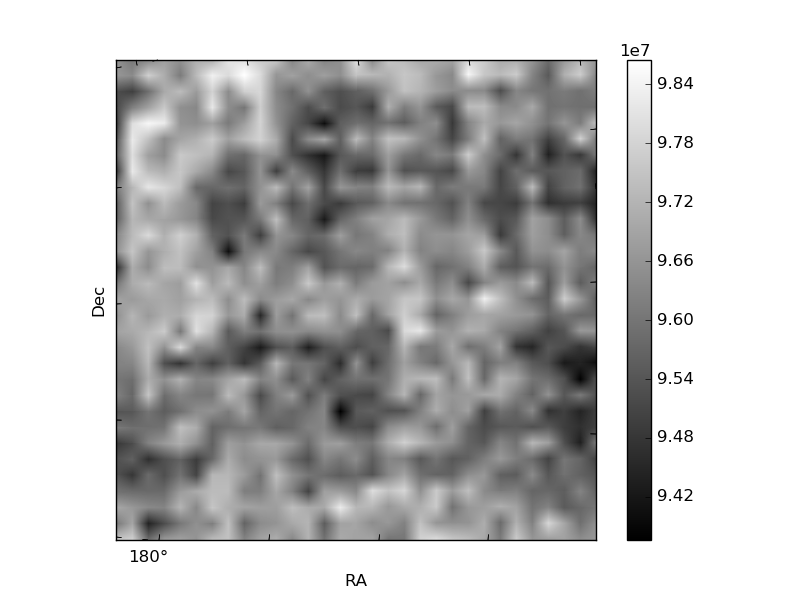
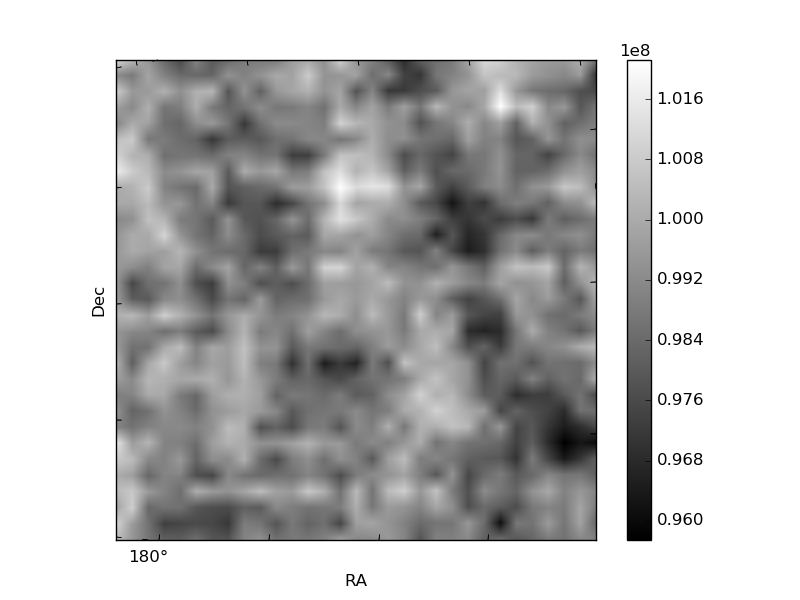
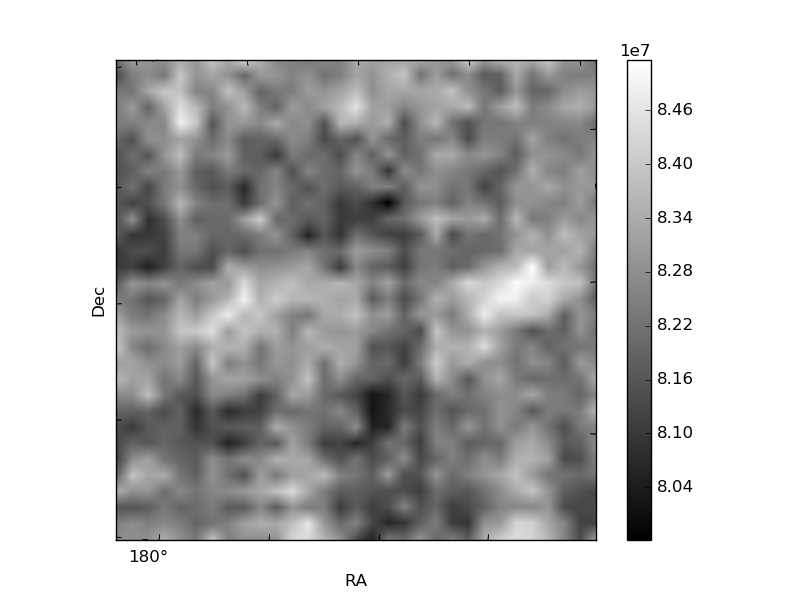
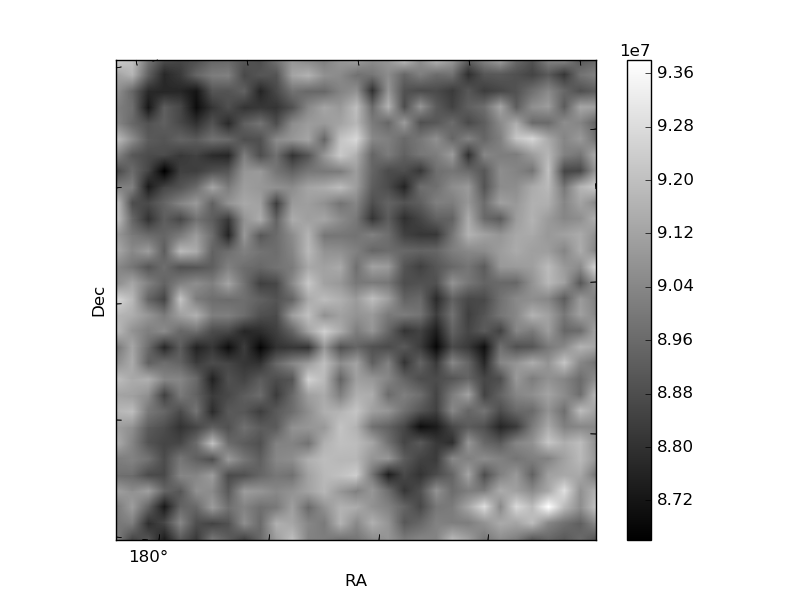
Histogram calculated using DETX and DETY for each event in the final _common_clean file
| Quadrant A |  |
 |
Quadrant B |
|---|---|---|---|
| Quadrant D | 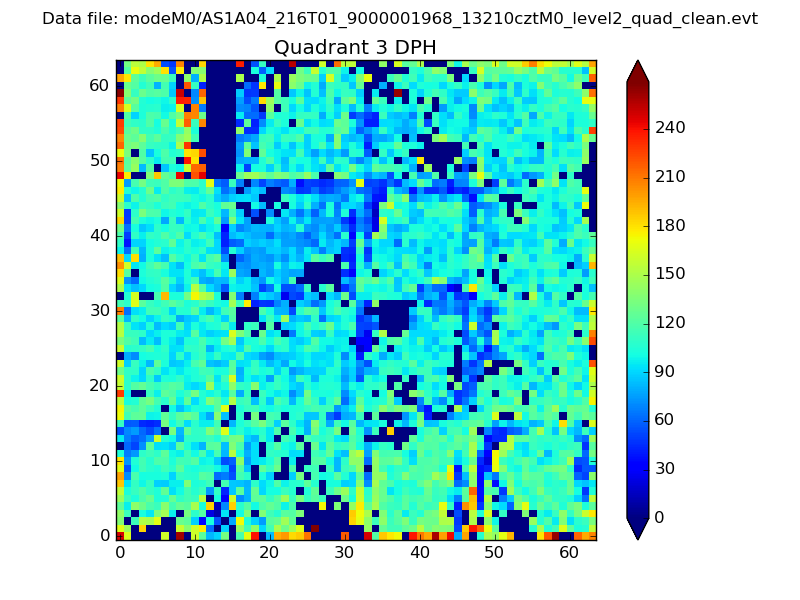 |
 |
Quadrant C |
| Plot type | Count rate plots | Images |
|---|---|---|
| Comparison with Poisson distribution Blue bars denote a histogram of data divided into 1 sec bins. Red curve is a Poisson curve with rate = median count rate of data. |
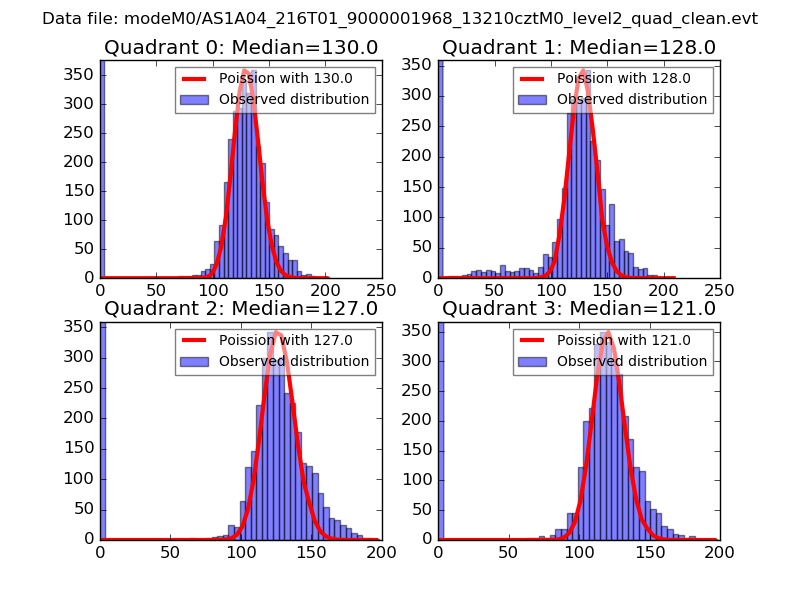 |
 |
| Quadrant-wise count rates Data is divided into 100 sec bins |
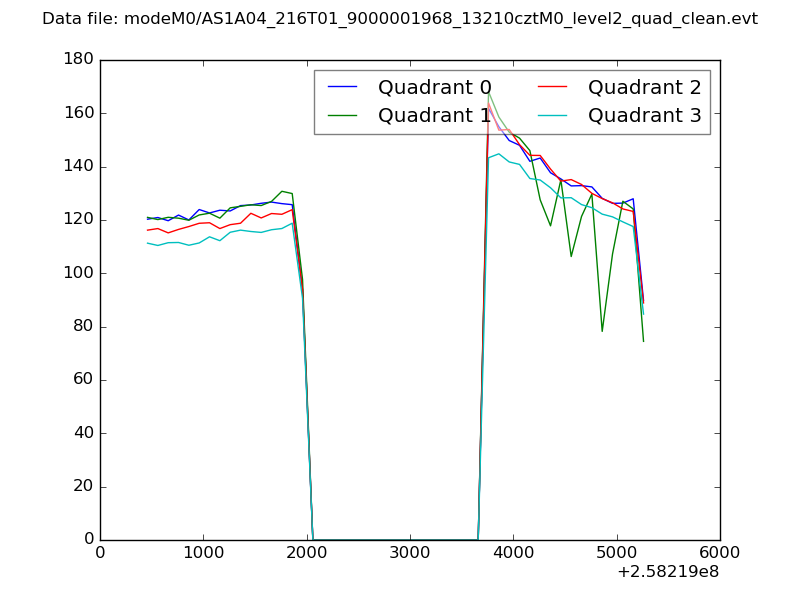 |
|
| Module-wise count rates for Quadrant A Data is divided into 100 sec bins |
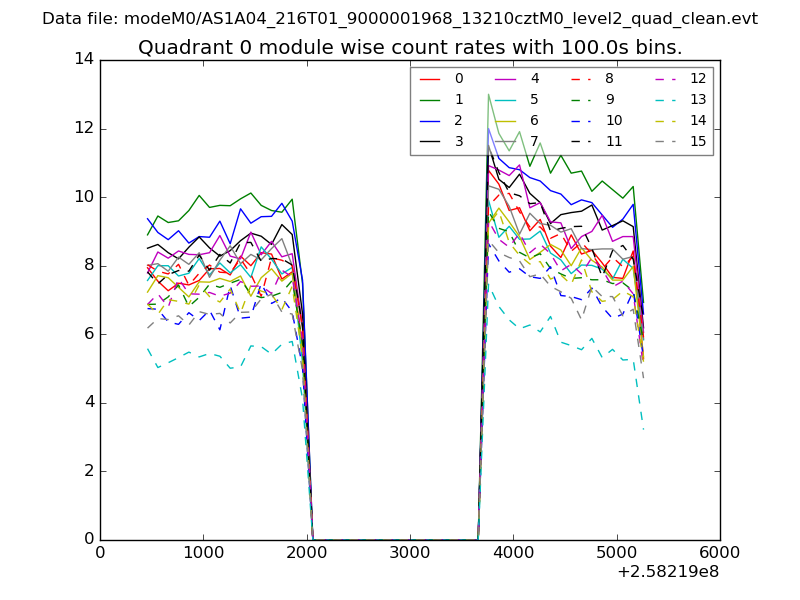 |
 |
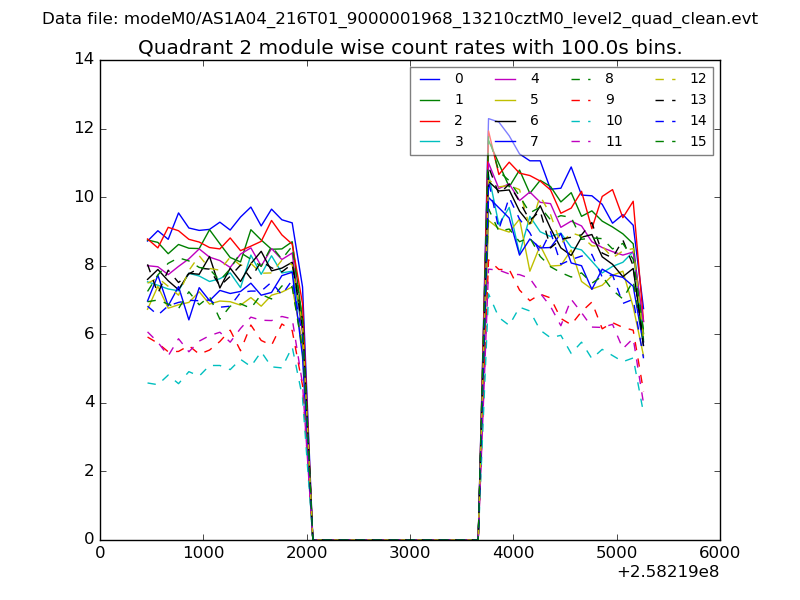
| Module-wise count rates for Quadrant B Data is divided into 100 sec bins |
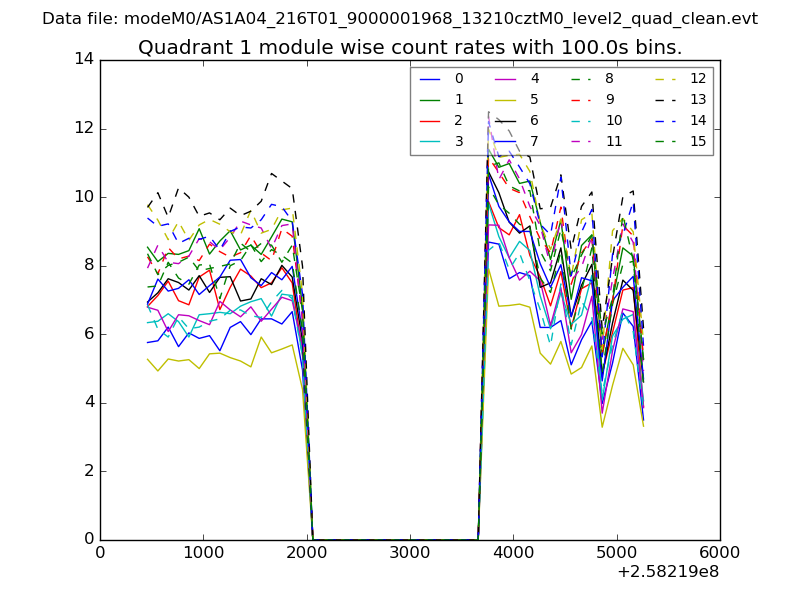 |
 |
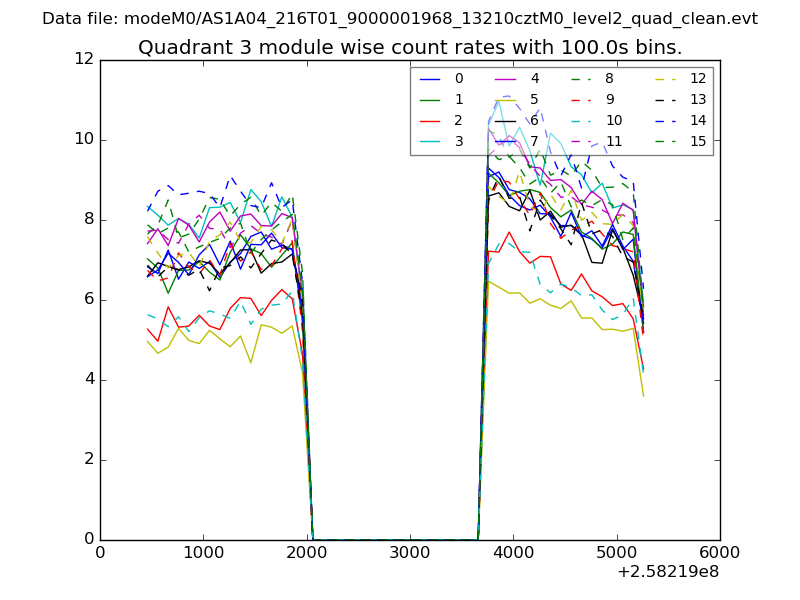
| Module-wise count rates for Quadrant C Data is divided into 100 sec bins |
 |
 |
| Module-wise count rates for Quadrant D Data is divided into 100 sec bins |
 |
 |
| Parameter | Plot |
|---|---|
| CZT HV Monitor | 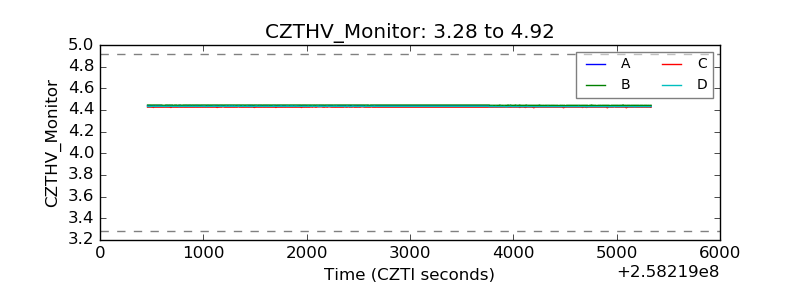 |
| D_VDD | 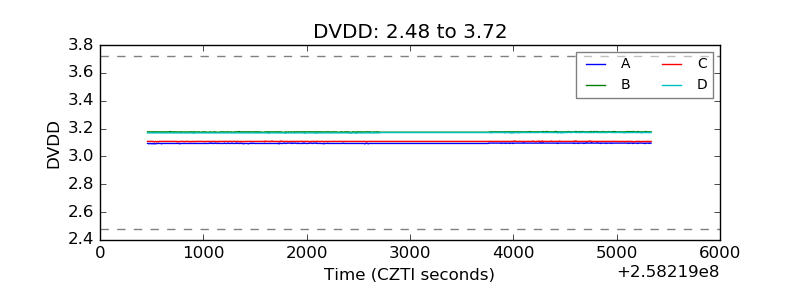 |
| Temperature 1 | 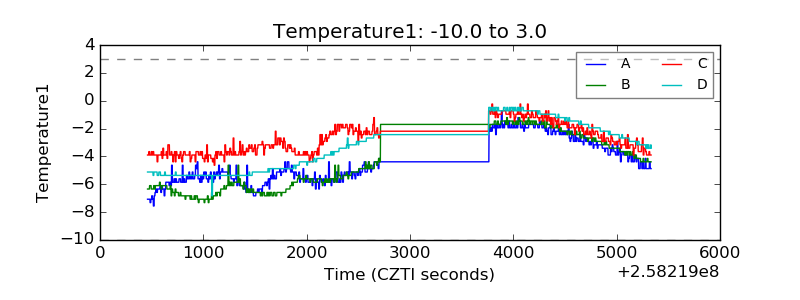 |
| Veto HV Monitor | 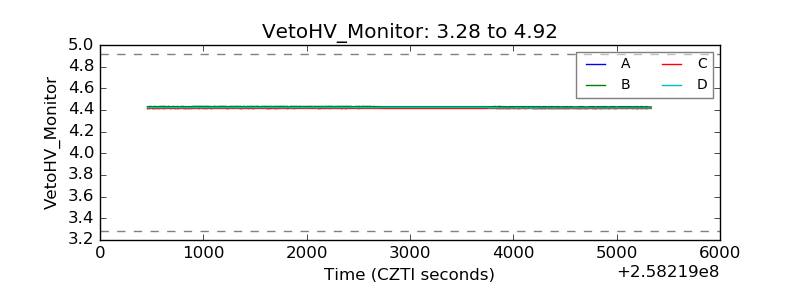 |
| Veto LLD | 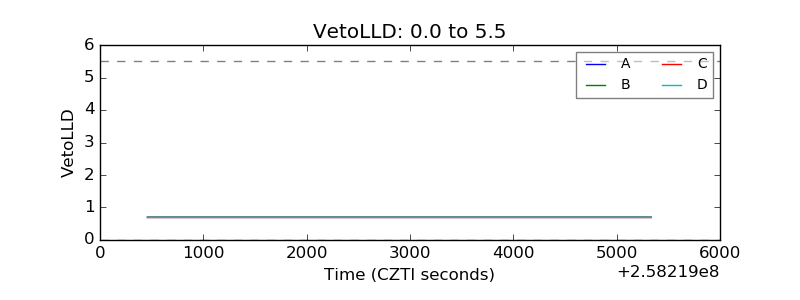 |
| Alpha Counter | 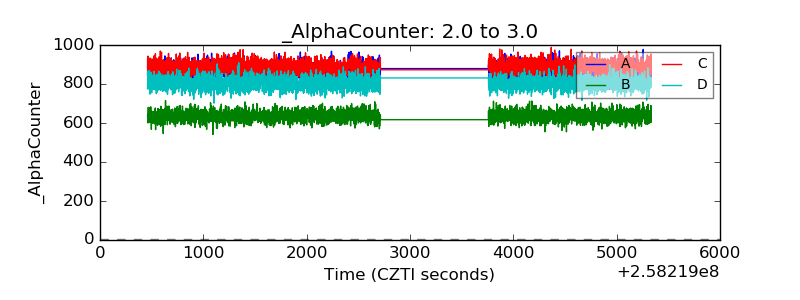 |
| _CPM_Rate | 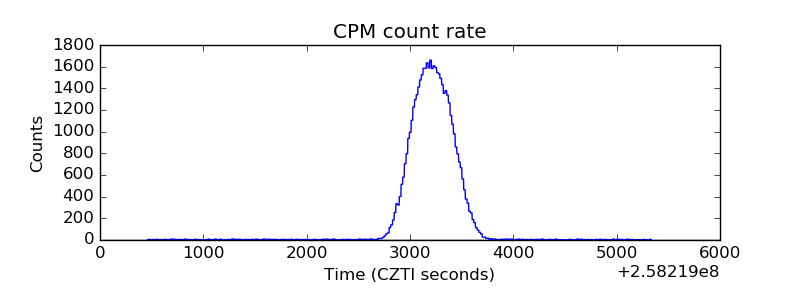 |
| CZT Counter | 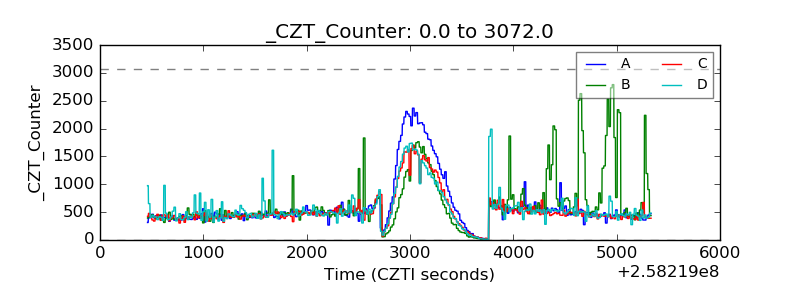 |
| +2.5 Volts monitor |  |
| +5 Volts monitor | 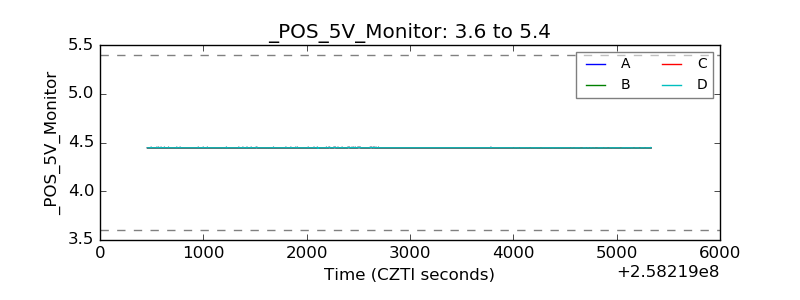 |
| _ROLL_ROT | 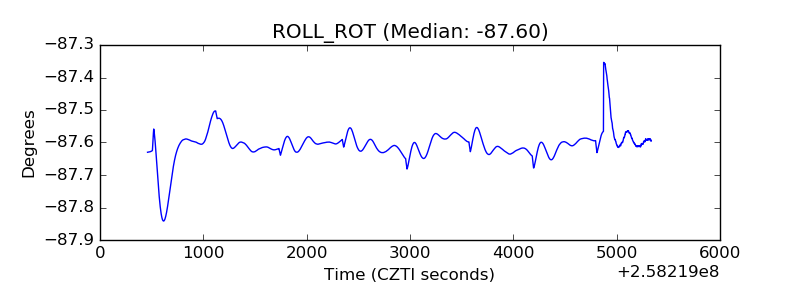 |
| _Roll_DEC | 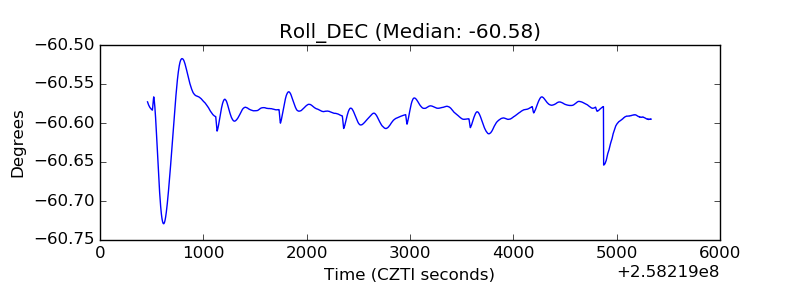 |
| _Roll_RA | 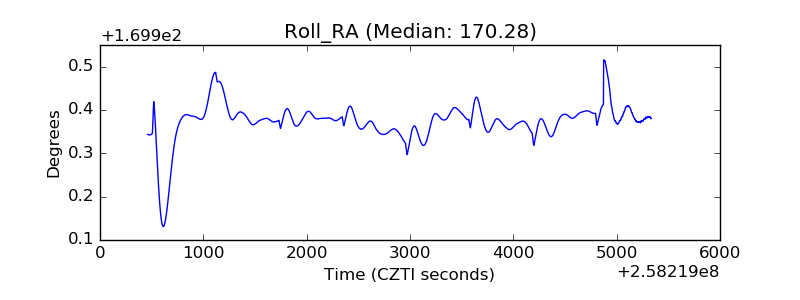 |
| Veto Counter | 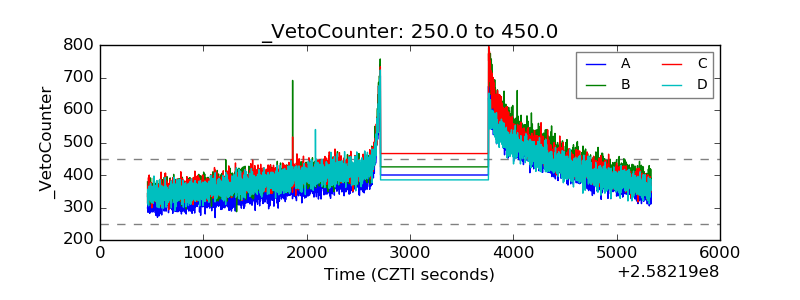 |