| Param | Original file | Final file |
|---|---|---|
| Filename | modeM0/AS1A04_216T01_9000001968_13213cztM0_level2.evt | modeM0/AS1A04_216T01_9000001968_13213cztM0_level2_quad_clean.evt |
| Size (bytes) | 435,144,960 | 96,327,360 |
| Size | 415.0 MB | 91.9 MB |
| Events in quadrant A | 2,870,074 | 641,918 |
| Events in quadrant B | 3,400,258 | 652,119 |
| Events in quadrant C | 2,737,608 | 635,507 |
| Events in quadrant D | 3,766,136 | 572,182 |
| Mode M0 | |||
|---|---|---|---|
| Quadrant | BADHDUFLAG | Total packets | Discarded packets |
| A | 0 | 12423 | 1 |
| B | 0 | 13953 | 0 |
| C | 0 | 12152 | 0 |
| D | 0 | 15406 | 0 |
| Mode M9 | |||
|---|---|---|---|
| Quadrant | BADHDUFLAG | Total packets | Discarded packets |
| A | 0 | 13 | 0 |
| B | 0 | 13 | 0 |
| C | 0 | 13 | 0 |
| D | 0 | 13 | 0 |
| Mode SS | |||
|---|---|---|---|
| Quadrant | BADHDUFLAG | Total packets | Discarded packets |
| A | 0 | 122 | 0 |
| B | 0 | 122 | 0 |
| C | 0 | 122 | 0 |
| D | 0 | 122 | 0 |
| Quadrant | Total seconds | Saturated seconds | Saturation percentage |
|---|---|---|---|
| A | 5943 | 14 | 0.235571% |
| B | 5943 | 142 | 2.389366% |
| C | 5943 | 5 | 0.084133% |
| D | 5943 | 271 | 4.559987% |
Noise dominated data is calculated using 1-second bins in cleaned event files. If a bin has >2000 counts, and if more than 50% of those come from <1% of pixels, then it is considered to be noise-dominated and hence unusable.
| Quadrant | # 1 sec bins | Bins with >0 counts | Bins with >2000 counts | High rate bins dominated by noise | Noise dominated (total time) | Noise dominated (detector-on time) | Marked lightcurve |
|---|---|---|---|---|---|---|---|
| A | 7239 | 5945 | 1 | 1 | 0.01% | 0.02% | 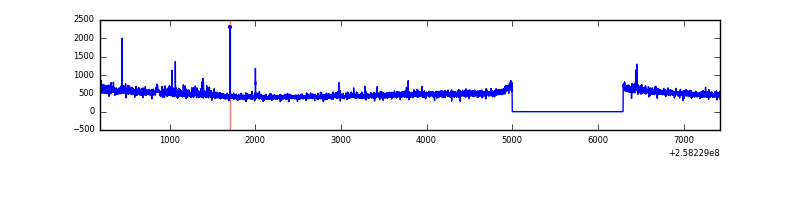 |
| B | 7239 | 5945 | 89 | 89 | 1.23% | 1.50% | 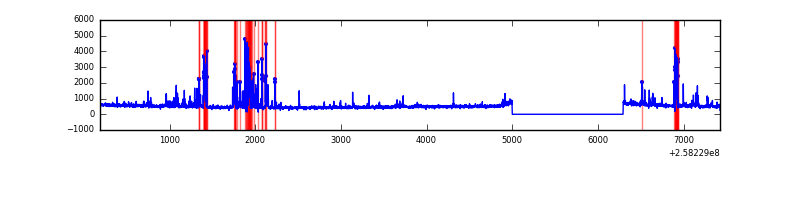 |
| C | 7239 | 5945 | 0 | 0 | 0.00% | 0.00% |  |
| D | 7239 | 5945 | 214 | 214 | 2.96% | 3.60% | 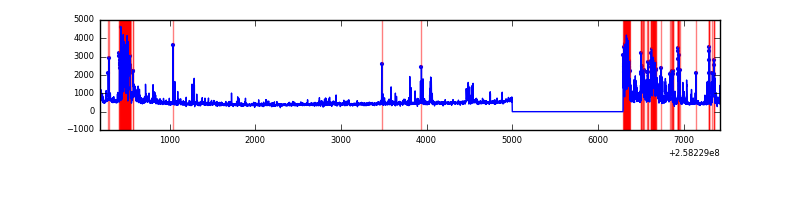 |
Top three noisy pixels from each quadrant. If the there are fewer than three noisy pixels in the level2.evt file, extra rows are filled as -1
| Pixel properties | Quadrant properties | ||||||
|---|---|---|---|---|---|---|---|
| Quadrant | DetID | PixID | Counts | Sigma | Mean | Median | Sigma |
| A | 8 | 15 | 45529 | 308.0 | 719 | 706 | 145.5 |
| A | 1 | 162 | 29711 | 199.31 | 719 | 706 | 145.5 |
| A | 1 | 178 | 9538 | 60.69 | 719 | 706 | 145.5 |
| B | 4 | 239 | 461268 | 3399.8 | 725 | 710 | 135.5 |
| B | 3 | 209 | 46761 | 339.94 | 725 | 710 | 135.5 |
| B | 0 | 189 | 15071 | 106.01 | 725 | 710 | 135.5 |
| C | 15 | 208 | 15744 | 94.56 | 696 | 702 | 159.1 |
| C | 14 | 234 | 6043 | 33.57 | 696 | 702 | 159.1 |
| C | 13 | 61 | 5209 | 28.33 | 696 | 702 | 159.1 |
| D | 13 | 122 | 759707 | 4770.39 | 666 | 647 | 159.1 |
| D | 1 | 52 | 319425 | 2003.39 | 666 | 647 | 159.1 |
| D | 9 | 85 | 59515 | 369.96 | 666 | 647 | 159.1 |
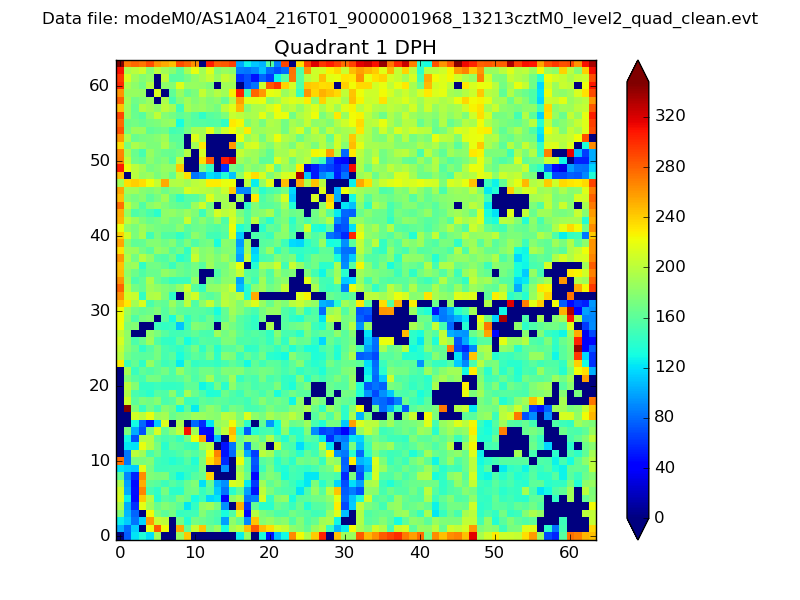
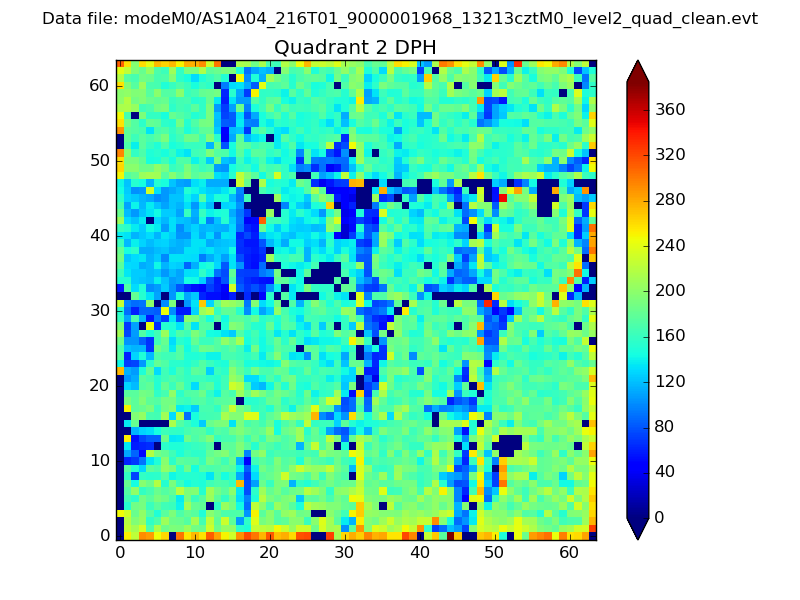
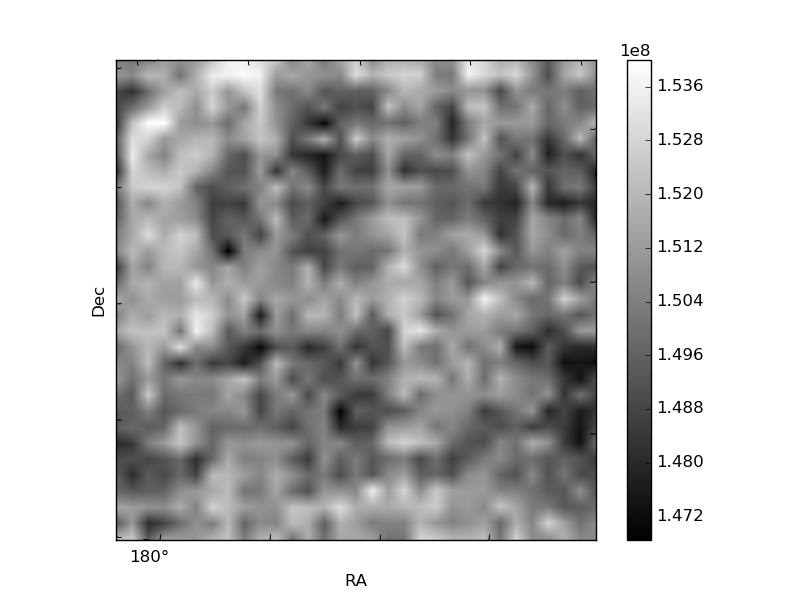
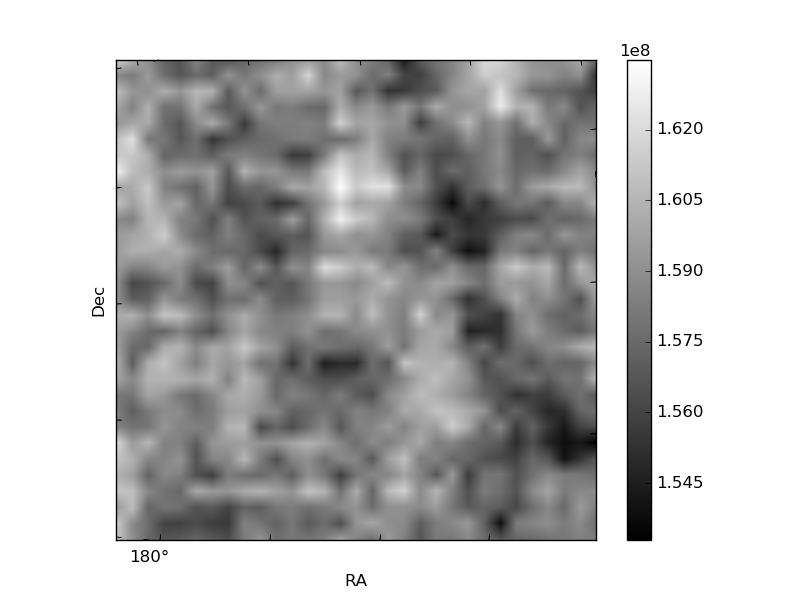
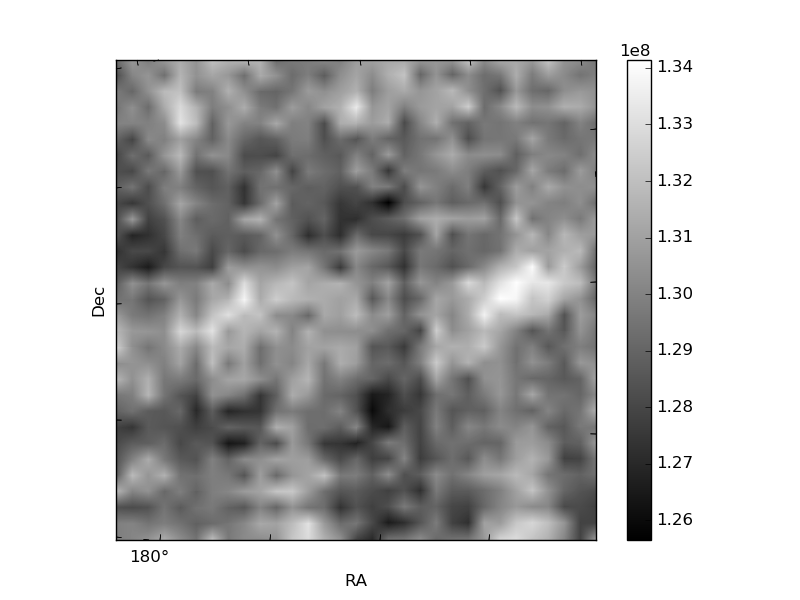
Histogram calculated using DETX and DETY for each event in the final _common_clean file
| Quadrant A | 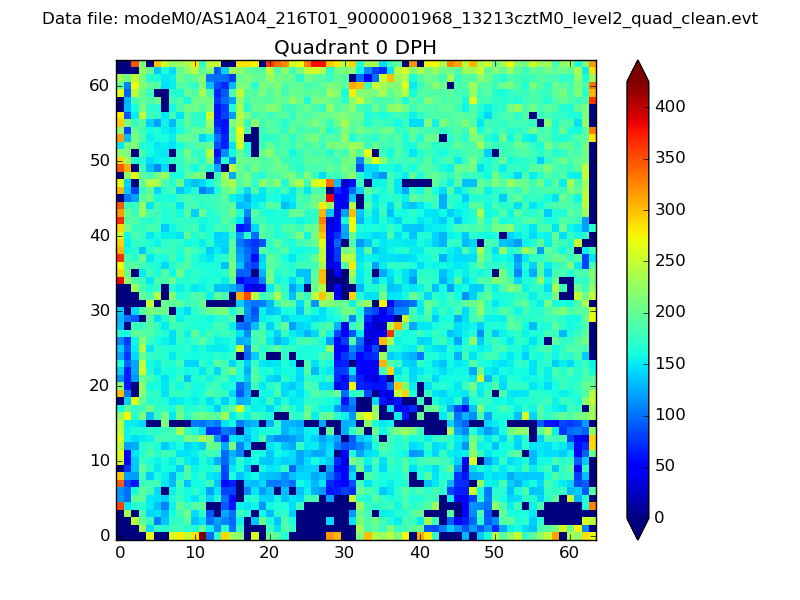 |
 |
Quadrant B |
|---|---|---|---|
| Quadrant D |  |
 |
Quadrant C |
| Plot type | Count rate plots | Images |
|---|---|---|
| Comparison with Poisson distribution Blue bars denote a histogram of data divided into 1 sec bins. Red curve is a Poisson curve with rate = median count rate of data. |
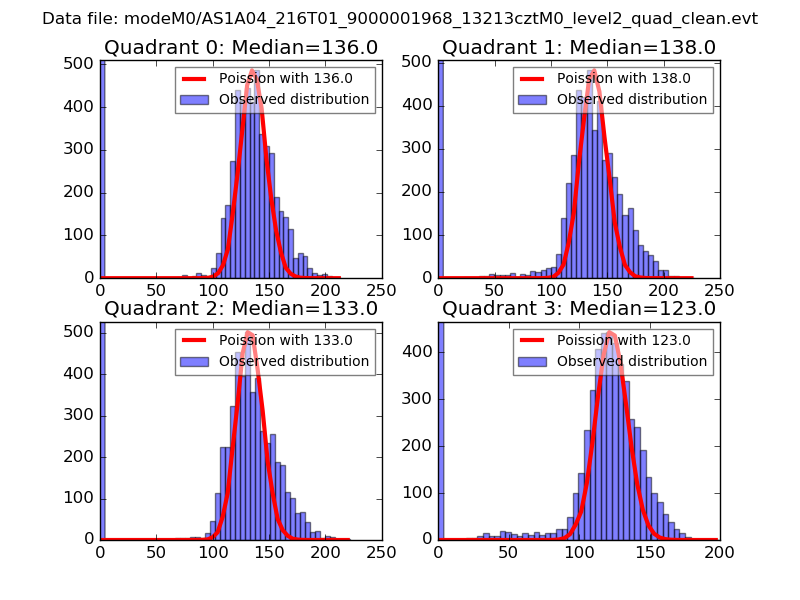 |
 |
| Quadrant-wise count rates Data is divided into 100 sec bins |
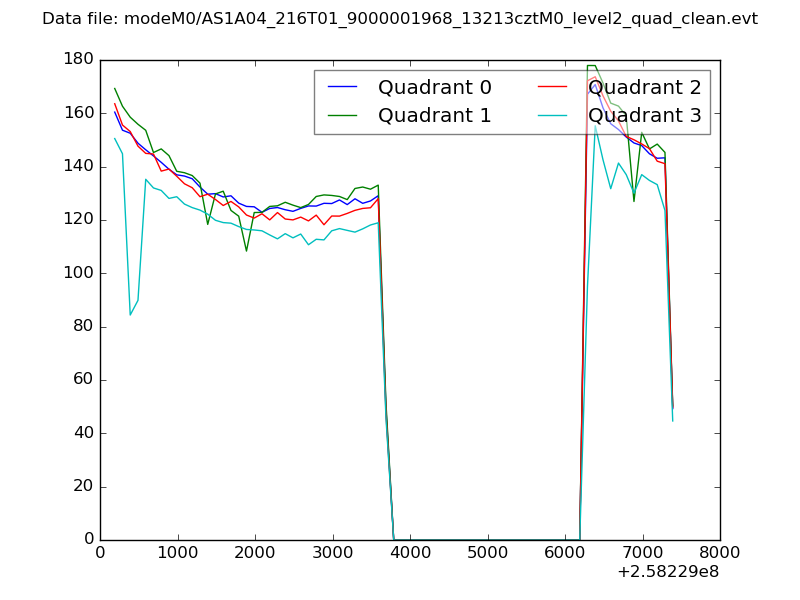 |
|
| Module-wise count rates for Quadrant A Data is divided into 100 sec bins |
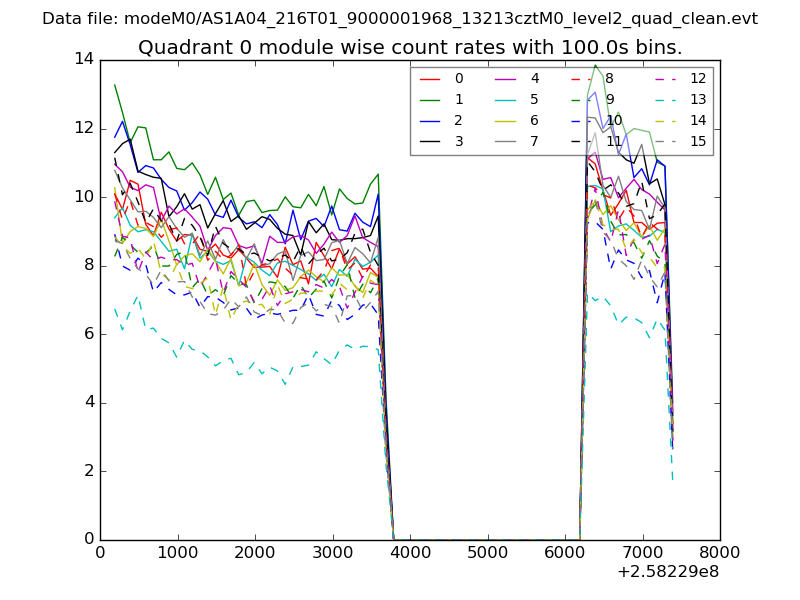 |
 |
| Module-wise count rates for Quadrant B Data is divided into 100 sec bins |
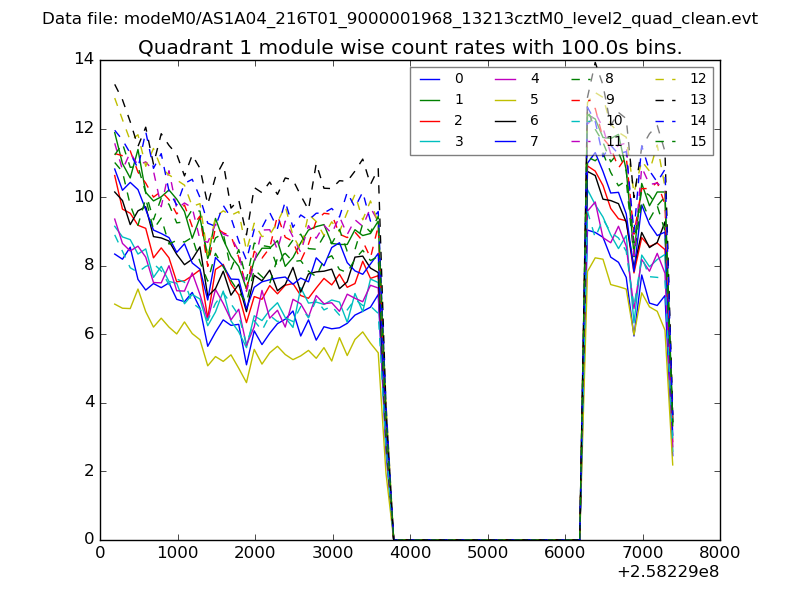 |
 |
| Module-wise count rates for Quadrant C Data is divided into 100 sec bins |
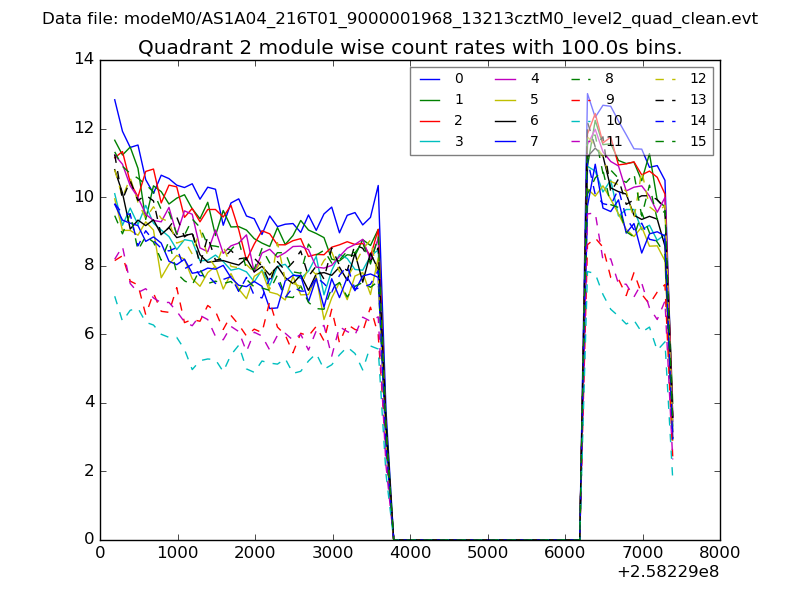 |
 |
| Module-wise count rates for Quadrant D Data is divided into 100 sec bins |
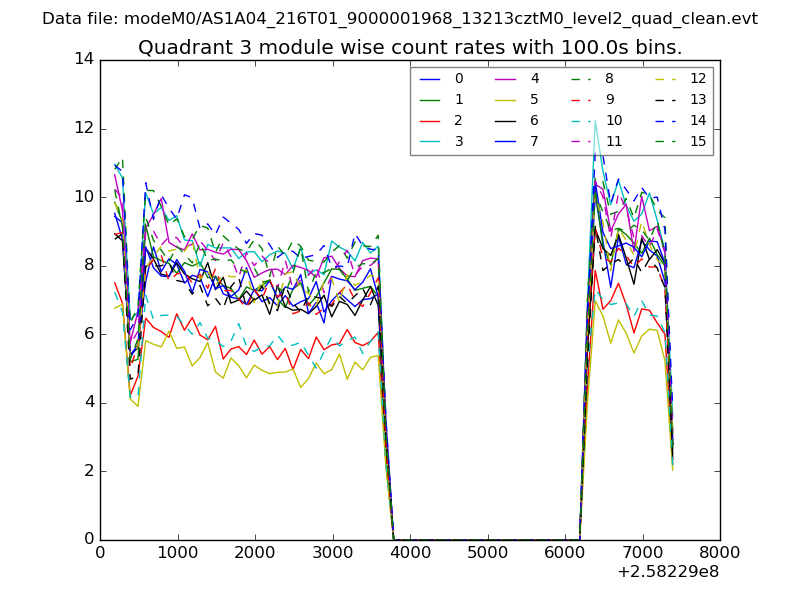 |
 |
| Parameter | Plot |
|---|---|
| CZT HV Monitor | 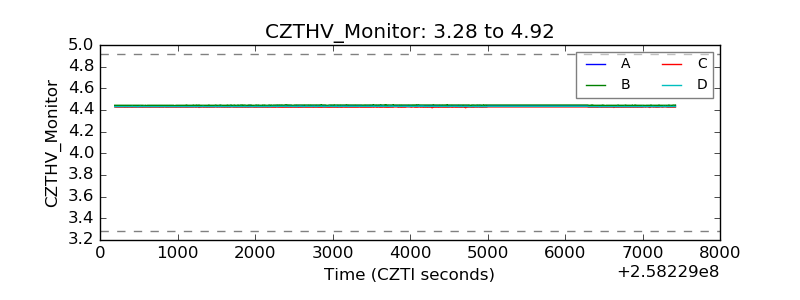 |
| D_VDD | 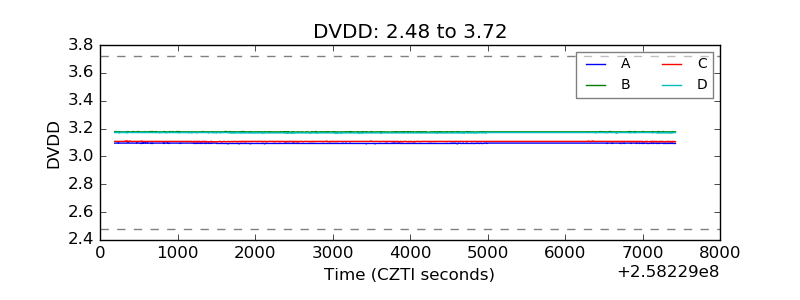 |
| Temperature 1 | 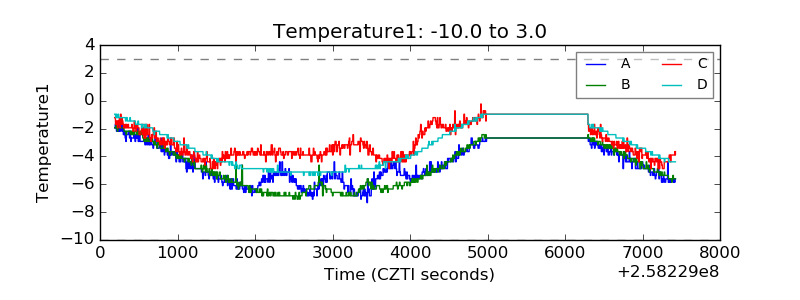 |
| Veto HV Monitor | 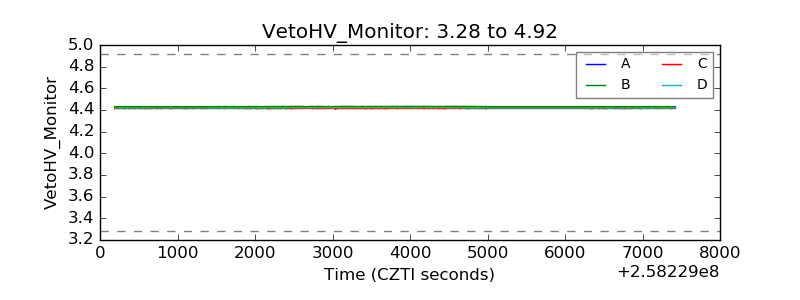 |
| Veto LLD | 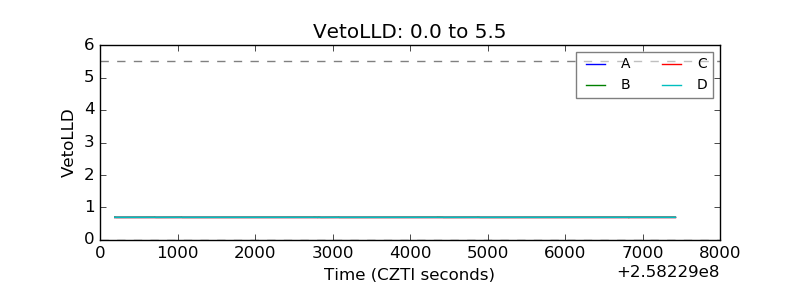 |
| Alpha Counter | 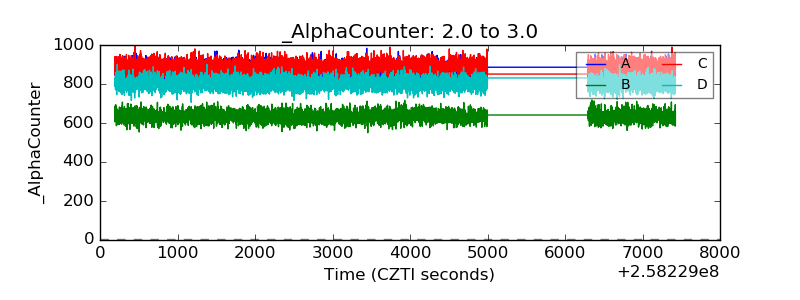 |
| _CPM_Rate | 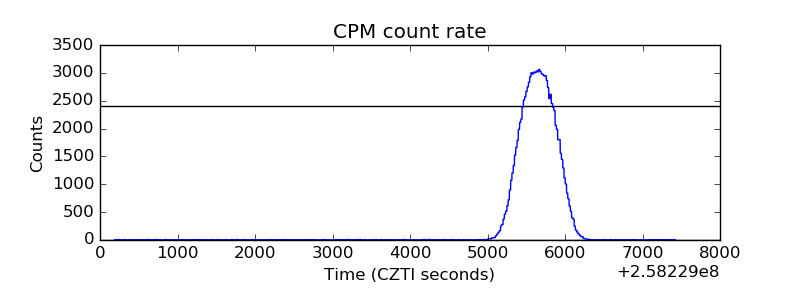 |
| CZT Counter | 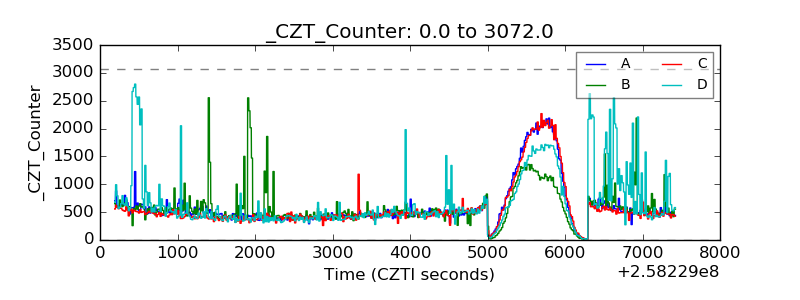 |
| +2.5 Volts monitor |  |
| +5 Volts monitor |  |
| _ROLL_ROT |  |
| _Roll_DEC | 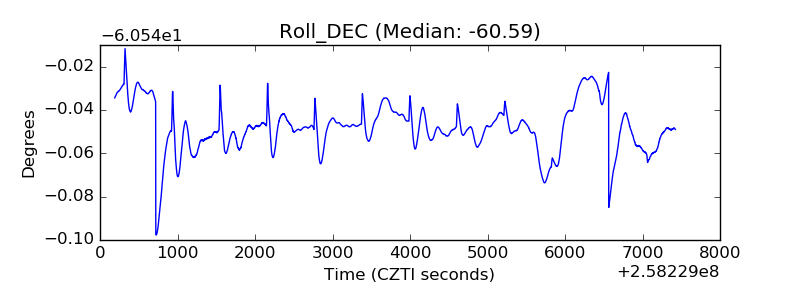 |
| _Roll_RA |  |
| Veto Counter | 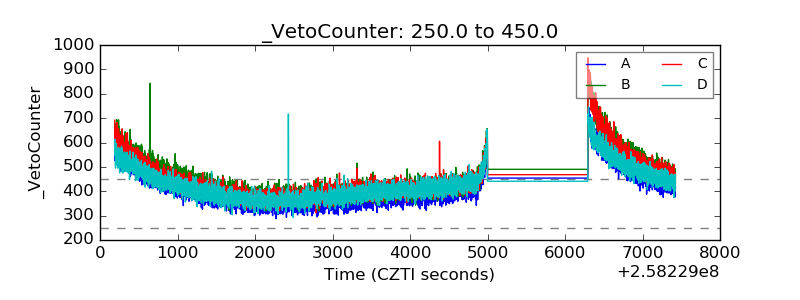 |