| Param | Original file | Final file |
|---|---|---|
| Filename | modeM0/AS1A04_216T01_9000001968_13214cztM0_level2.evt | modeM0/AS1A04_216T01_9000001968_13214cztM0_level2_quad_clean.evt |
| Size (bytes) | 469,267,200 | 98,449,920 |
| Size | 447.5 MB | 93.9 MB |
| Events in quadrant A | 2,939,841 | 656,100 |
| Events in quadrant B | 3,842,010 | 661,247 |
| Events in quadrant C | 2,943,630 | 654,110 |
| Events in quadrant D | 4,077,509 | 589,593 |
| Mode M0 | |||
|---|---|---|---|
| Quadrant | BADHDUFLAG | Total packets | Discarded packets |
| A | 0 | 12704 | 2 |
| B | 0 | 15341 | 1 |
| C | 0 | 12682 | 1 |
| D | 0 | 16181 | 1 |
| Mode M9 | |||
|---|---|---|---|
| Quadrant | BADHDUFLAG | Total packets | Discarded packets |
| A | 0 | 23 | 0 |
| B | 0 | 23 | 0 |
| C | 0 | 23 | 0 |
| D | 0 | 24 | 0 |
| Mode SS | |||
|---|---|---|---|
| Quadrant | BADHDUFLAG | Total packets | Discarded packets |
| A | 0 | 120 | 0 |
| B | 0 | 120 | 0 |
| C | 0 | 120 | 0 |
| D | 0 | 120 | 0 |
| Quadrant | Total seconds | Saturated seconds | Saturation percentage |
|---|---|---|---|
| A | 6027 | 22 | 0.365024% |
| B | 6027 | 279 | 4.629169% |
| C | 6027 | 22 | 0.365024% |
| D | 6027 | 240 | 3.982081% |
Noise dominated data is calculated using 1-second bins in cleaned event files. If a bin has >2000 counts, and if more than 50% of those come from <1% of pixels, then it is considered to be noise-dominated and hence unusable.
| Quadrant | # 1 sec bins | Bins with >0 counts | Bins with >2000 counts | High rate bins dominated by noise | Noise dominated (total time) | Noise dominated (detector-on time) | Marked lightcurve |
|---|---|---|---|---|---|---|---|
| A | 7393 | 6029 | 1 | 1 | 0.01% | 0.02% |  |
| B | 7393 | 6029 | 174 | 174 | 2.35% | 2.89% | 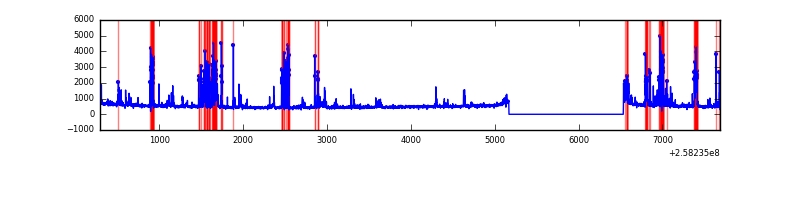 |
| C | 7393 | 6029 | 13 | 13 | 0.18% | 0.22% |  |
| D | 7393 | 6029 | 194 | 194 | 2.62% | 3.22% |  |
Top three noisy pixels from each quadrant. If the there are fewer than three noisy pixels in the level2.evt file, extra rows are filled as -1
| Pixel properties | Quadrant properties | ||||||
|---|---|---|---|---|---|---|---|
| Quadrant | DetID | PixID | Counts | Sigma | Mean | Median | Sigma |
| A | 8 | 15 | 33168 | 217.38 | 739 | 724 | 149.3 |
| A | 12 | 96 | 19548 | 126.12 | 739 | 724 | 149.3 |
| A | 1 | 162 | 18341 | 118.04 | 739 | 724 | 149.3 |
| B | 4 | 239 | 890034 | 6474.57 | 741 | 725 | 137.4 |
| B | 0 | 219 | 19277 | 135.07 | 741 | 725 | 137.4 |
| B | 0 | 214 | 17748 | 123.94 | 741 | 725 | 137.4 |
| C | 15 | 208 | 69592 | 417.38 | 722 | 729 | 165.0 |
| C | 14 | 234 | 56595 | 338.6 | 722 | 729 | 165.0 |
| C | 13 | 61 | 5323 | 27.84 | 722 | 729 | 165.0 |
| D | 1 | 52 | 788244 | 4775.25 | 693 | 675 | 164.9 |
| D | 13 | 122 | 522217 | 3162.25 | 693 | 675 | 164.9 |
| D | 8 | 195 | 71902 | 431.87 | 693 | 675 | 164.9 |
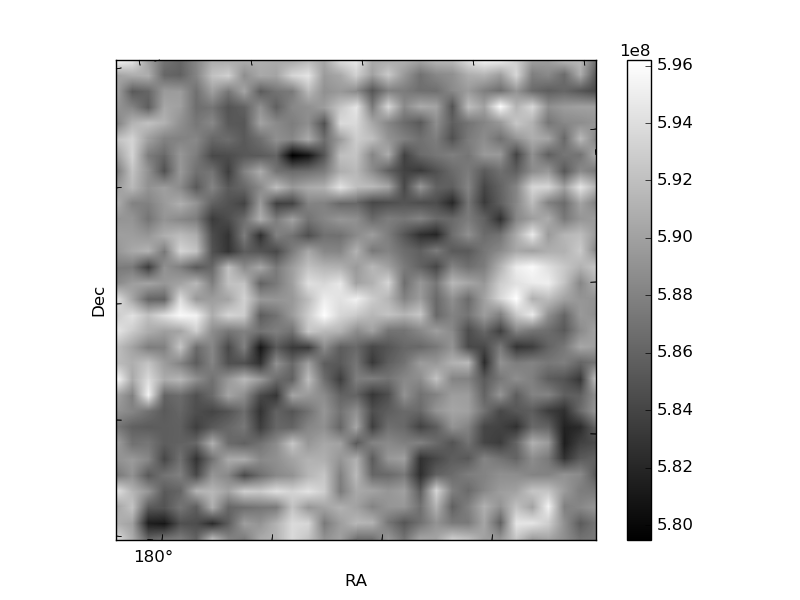
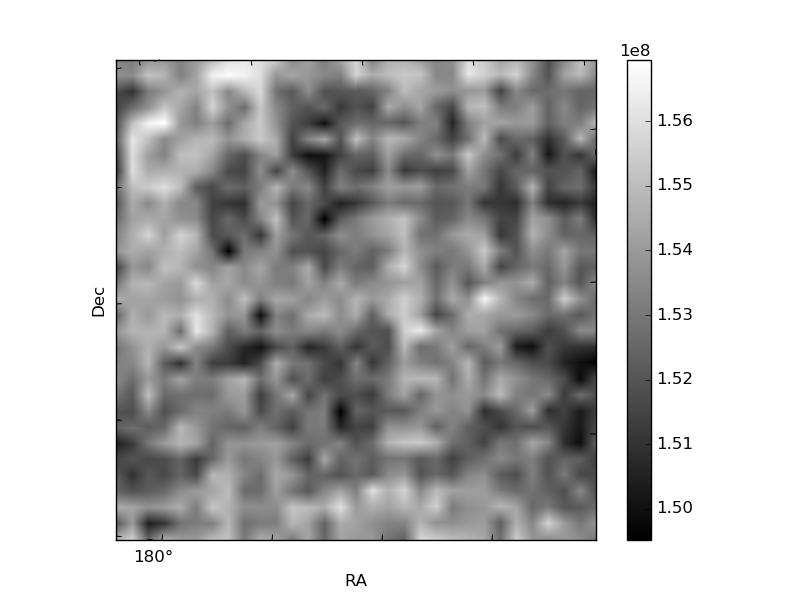
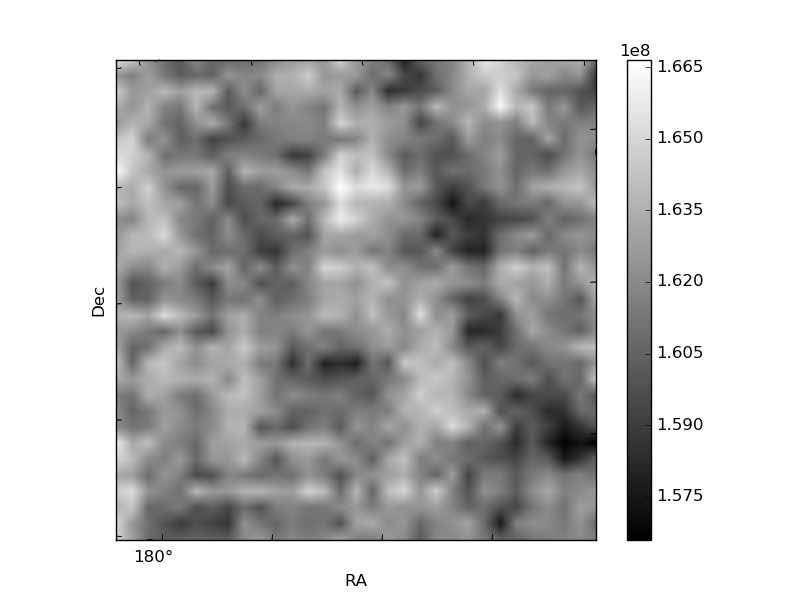
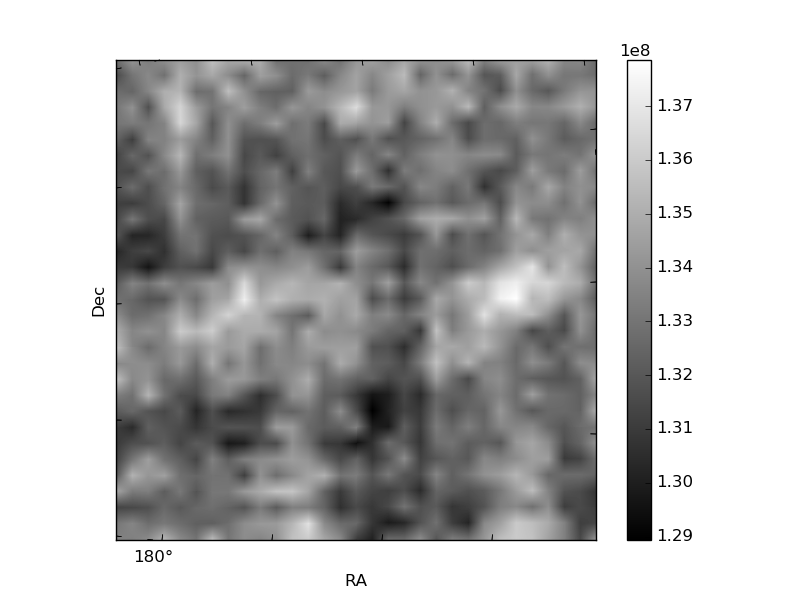
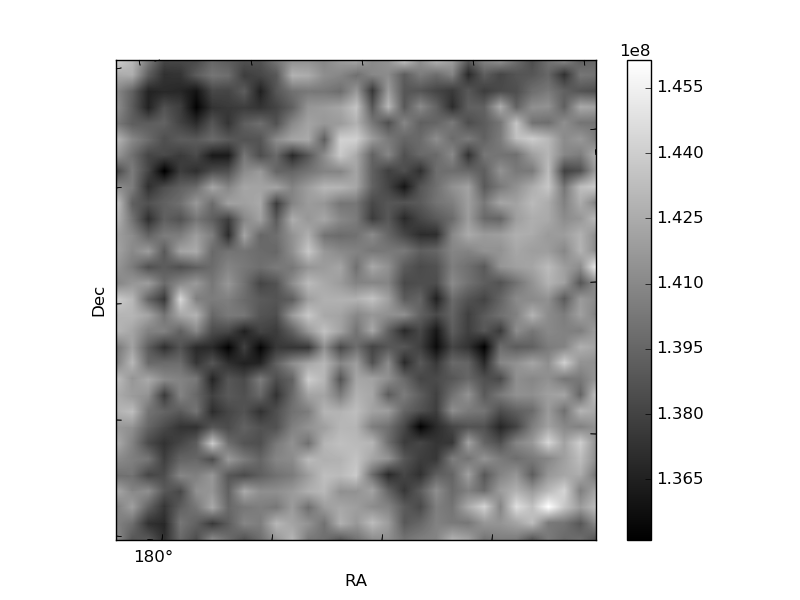
Histogram calculated using DETX and DETY for each event in the final _common_clean file
| Quadrant A | 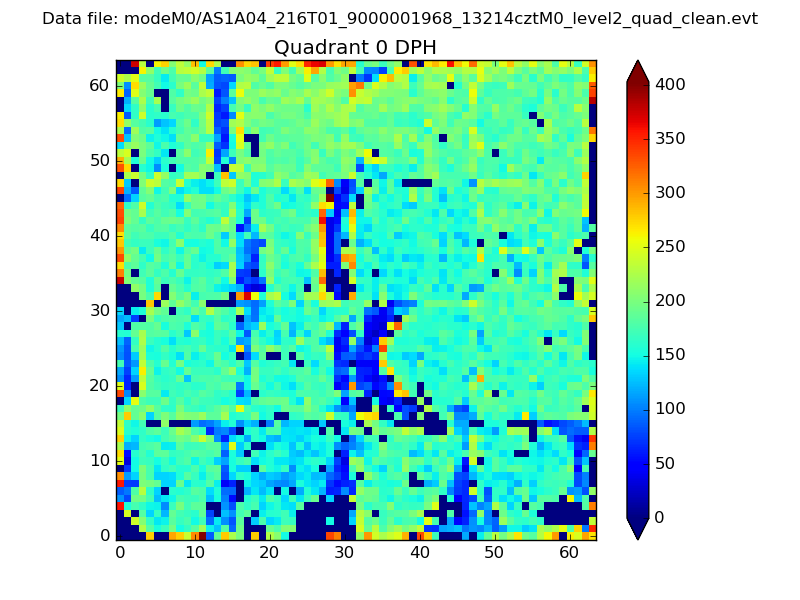 |
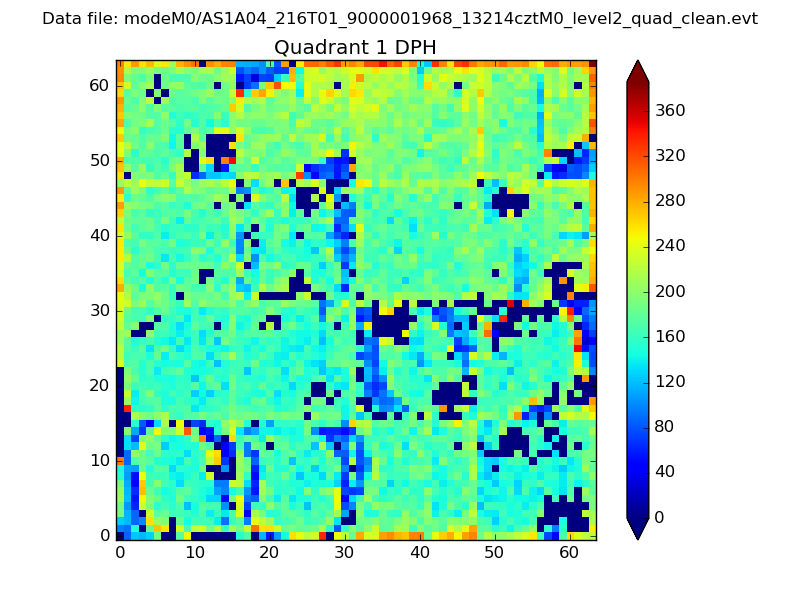 |
Quadrant B |
|---|---|---|---|
| Quadrant D |  |
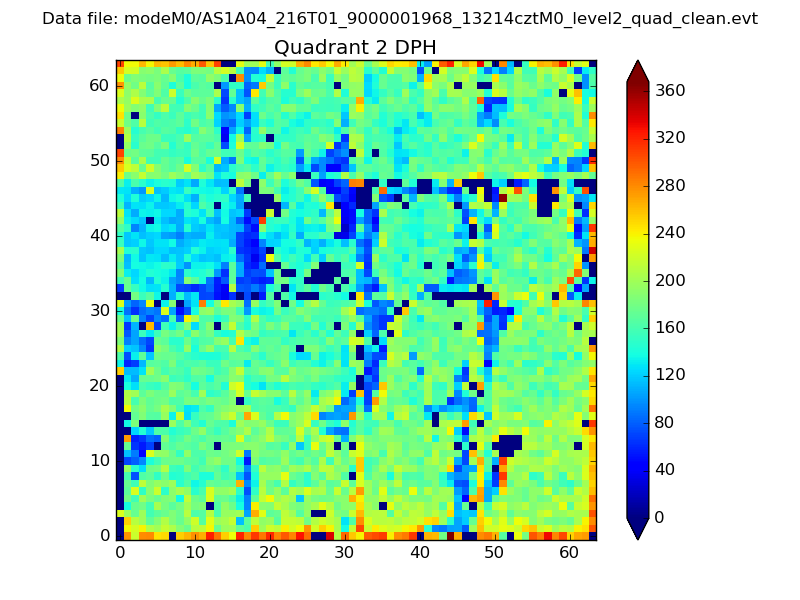 |
Quadrant C |
| Plot type | Count rate plots | Images |
|---|---|---|
| Comparison with Poisson distribution Blue bars denote a histogram of data divided into 1 sec bins. Red curve is a Poisson curve with rate = median count rate of data. |
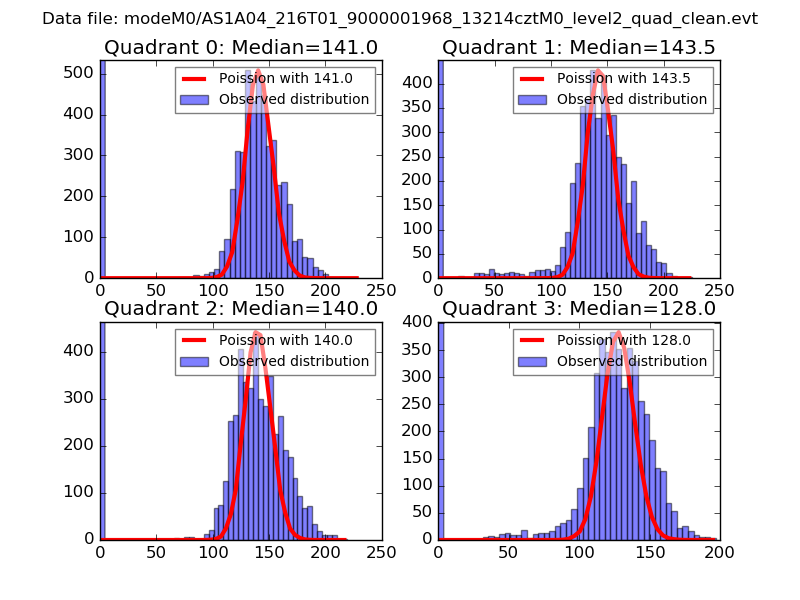 |
 |
| Quadrant-wise count rates Data is divided into 100 sec bins |
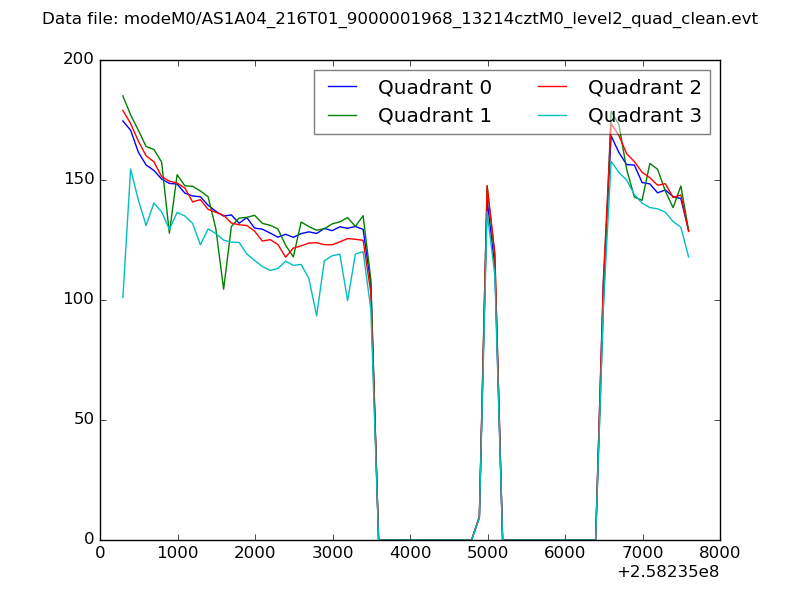 |
|
| Module-wise count rates for Quadrant A Data is divided into 100 sec bins |
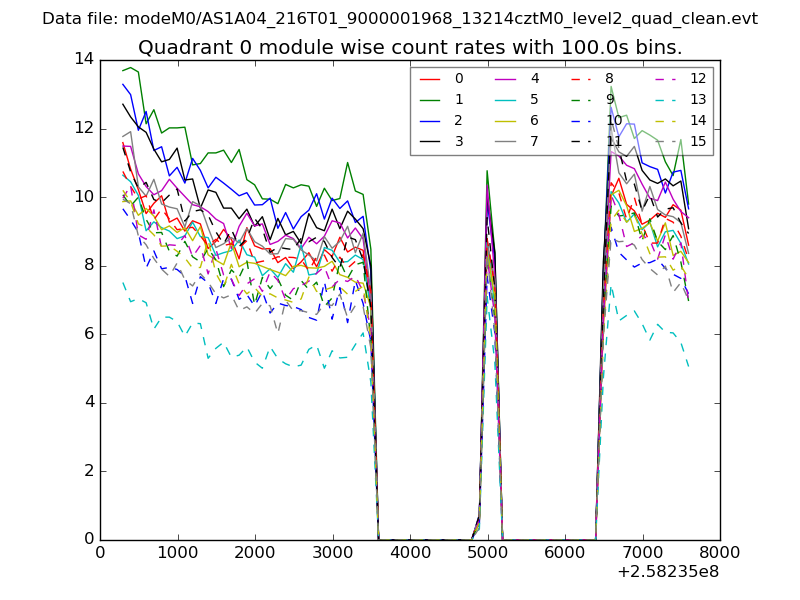 |
 |
| Module-wise count rates for Quadrant B Data is divided into 100 sec bins |
 |
 |
| Module-wise count rates for Quadrant C Data is divided into 100 sec bins |
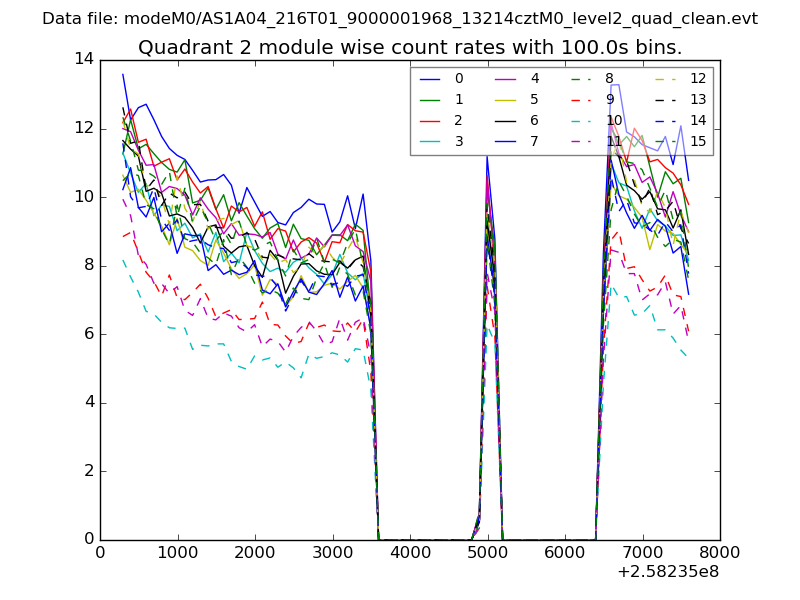 |
 |
| Module-wise count rates for Quadrant D Data is divided into 100 sec bins |
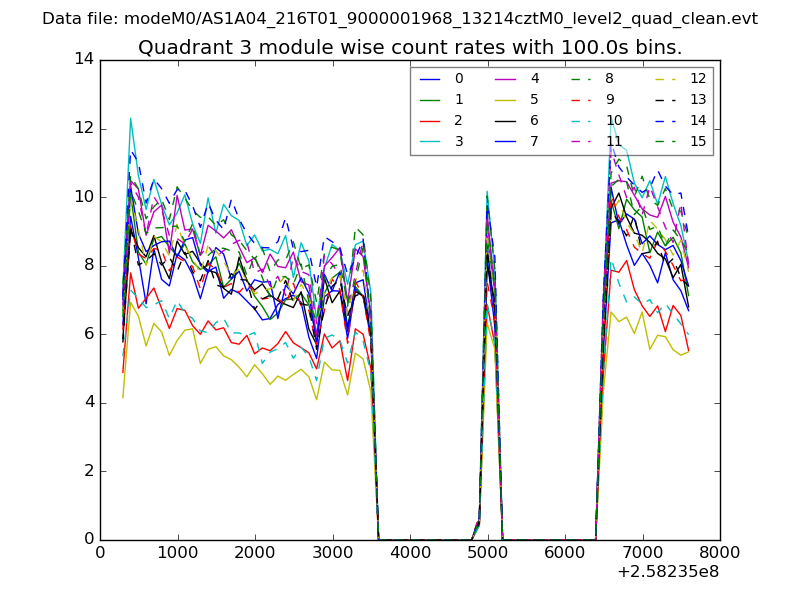 |
 |
| Parameter | Plot |
|---|---|
| CZT HV Monitor | 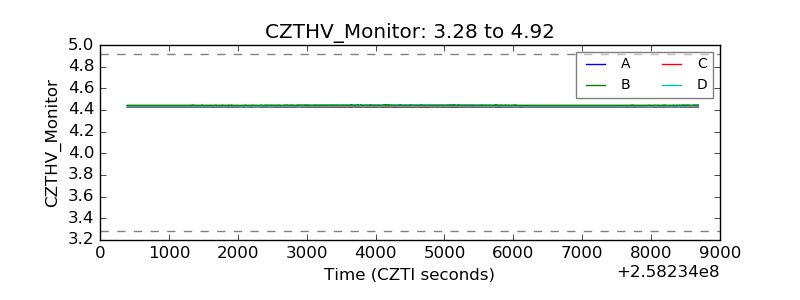 |
| D_VDD | 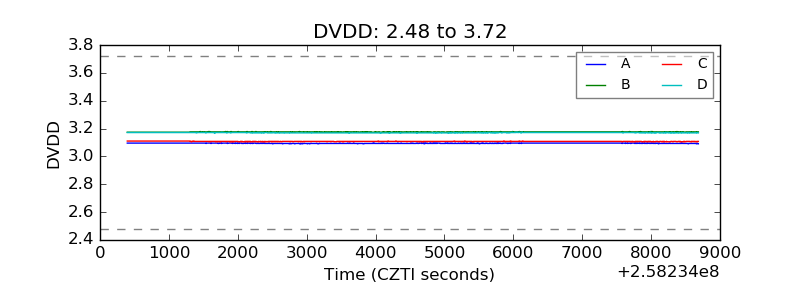 |
| Temperature 1 | 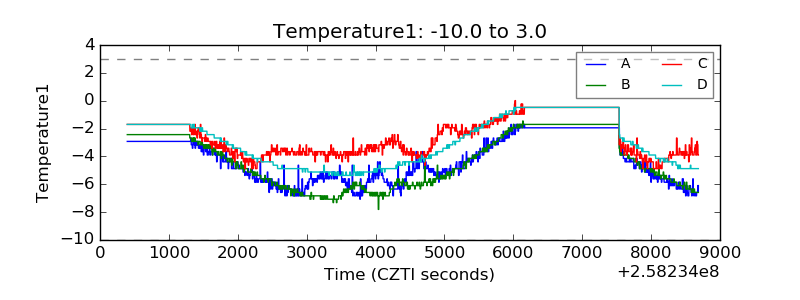 |
| Veto HV Monitor | 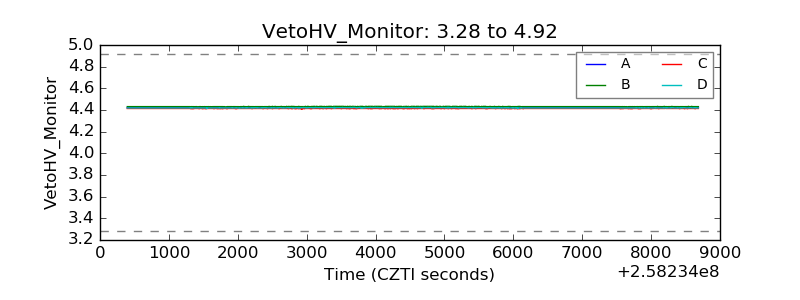 |
| Veto LLD | 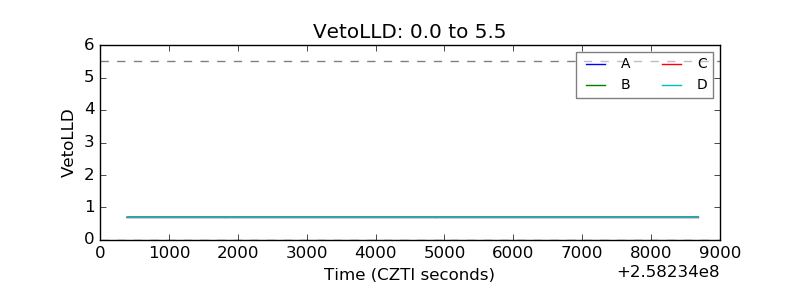 |
| Alpha Counter | 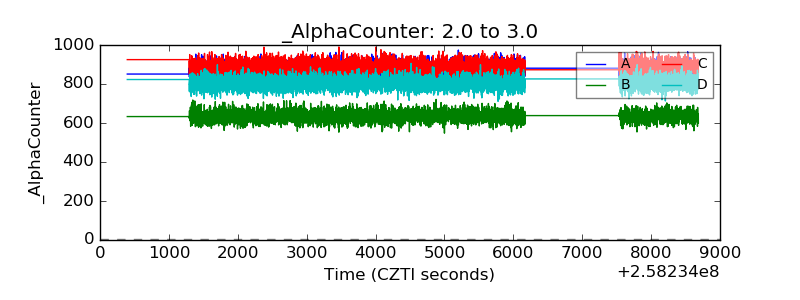 |
| _CPM_Rate | 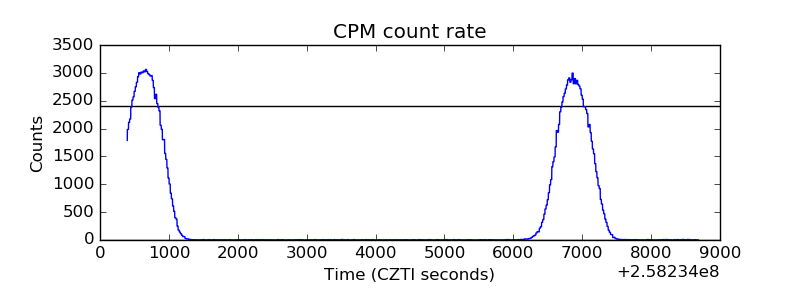 |
| CZT Counter | 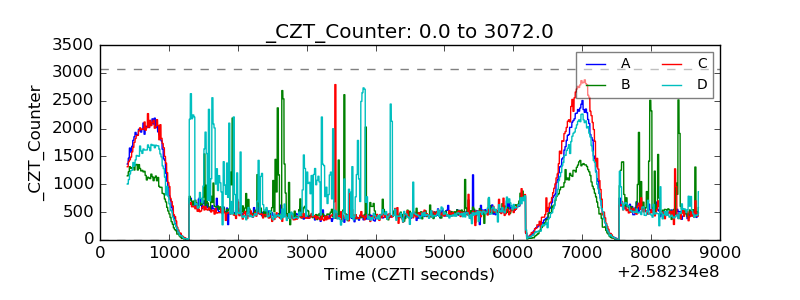 |
| +2.5 Volts monitor |  |
| +5 Volts monitor |  |
| _ROLL_ROT | 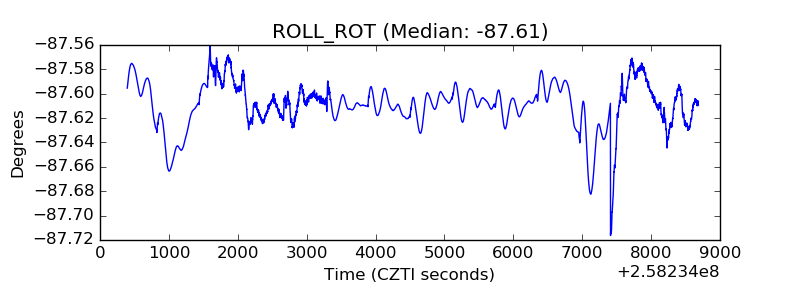 |
| _Roll_DEC | 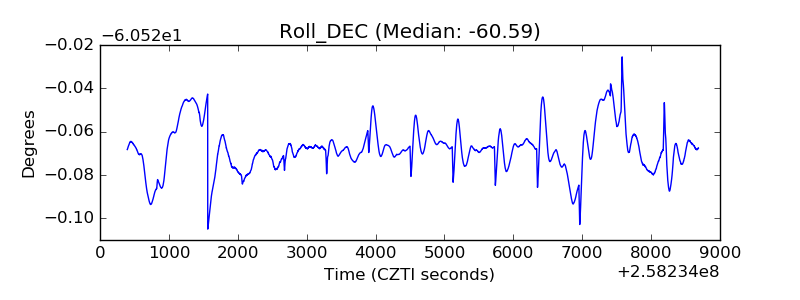 |
| _Roll_RA | 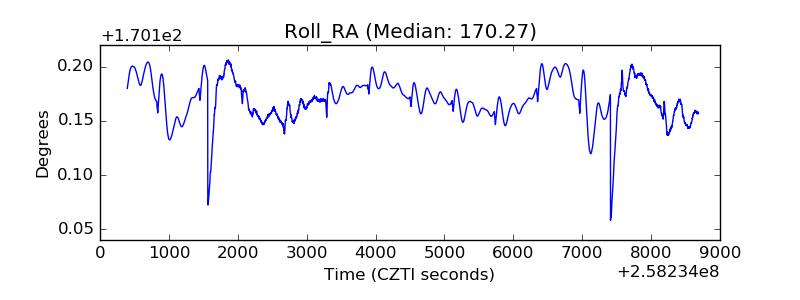 |
| Veto Counter | 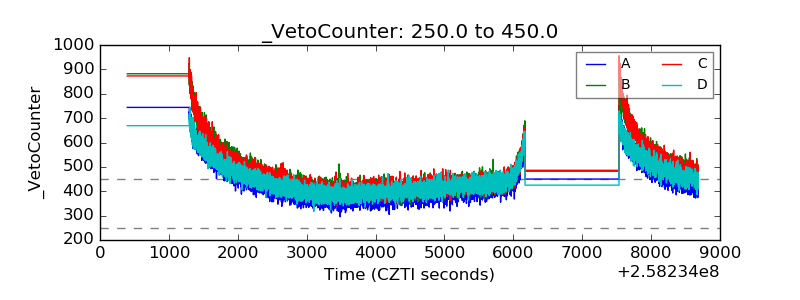 |