| Param | Original file | Final file |
|---|---|---|
| Filename | modeM0/AS1A04_216T01_9000001968_13215cztM0_level2.evt | modeM0/AS1A04_216T01_9000001968_13215cztM0_level2_quad_clean.evt |
| Size (bytes) | 454,412,160 | 104,771,520 |
| Size | 433.4 MB | 99.9 MB |
| Events in quadrant A | 3,095,356 | 689,008 |
| Events in quadrant B | 3,896,573 | 700,274 |
| Events in quadrant C | 3,029,005 | 695,614 |
| Events in quadrant D | 3,311,119 | 646,741 |
| Mode M0 | |||
|---|---|---|---|
| Quadrant | BADHDUFLAG | Total packets | Discarded packets |
| A | 0 | 13394 | 3 |
| B | 0 | 15599 | 2 |
| C | 0 | 13143 | 2 |
| D | 0 | 13994 | 2 |
| Mode M9 | |||
|---|---|---|---|
| Quadrant | BADHDUFLAG | Total packets | Discarded packets |
| A | 0 | 25 | 0 |
| B | 0 | 25 | 0 |
| C | 0 | 25 | 0 |
| D | 0 | 26 | 0 |
| Mode SS | |||
|---|---|---|---|
| Quadrant | BADHDUFLAG | Total packets | Discarded packets |
| A | 0 | 128 | 0 |
| B | 0 | 128 | 0 |
| C | 0 | 128 | 0 |
| D | 0 | 128 | 0 |
| Quadrant | Total seconds | Saturated seconds | Saturation percentage |
|---|---|---|---|
| A | 6328 | 21 | 0.331858% |
| B | 6328 | 247 | 3.903287% |
| C | 6328 | 9 | 0.142225% |
| D | 6328 | 24 | 0.379267% |
Noise dominated data is calculated using 1-second bins in cleaned event files. If a bin has >2000 counts, and if more than 50% of those come from <1% of pixels, then it is considered to be noise-dominated and hence unusable.
| Quadrant | # 1 sec bins | Bins with >0 counts | Bins with >2000 counts | High rate bins dominated by noise | Noise dominated (total time) | Noise dominated (detector-on time) | Marked lightcurve |
|---|---|---|---|---|---|---|---|
| A | 7714 | 6330 | 1 | 1 | 0.01% | 0.02% |  |
| B | 7714 | 6330 | 151 | 151 | 1.96% | 2.39% |  |
| C | 7714 | 6330 | 4 | 4 | 0.05% | 0.06% | 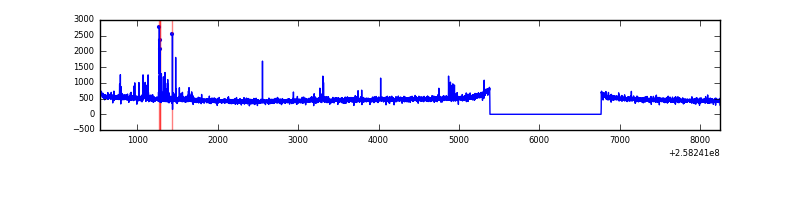 |
| D | 7714 | 6330 | 13 | 13 | 0.17% | 0.21% |  |
Top three noisy pixels from each quadrant. If the there are fewer than three noisy pixels in the level2.evt file, extra rows are filled as -1
| Pixel properties | Quadrant properties | ||||||
|---|---|---|---|---|---|---|---|
| Quadrant | DetID | PixID | Counts | Sigma | Mean | Median | Sigma |
| A | 8 | 15 | 37552 | 237.92 | 765 | 752 | 154.7 |
| A | 12 | 189 | 29804 | 187.83 | 765 | 752 | 154.7 |
| A | 1 | 162 | 27331 | 171.84 | 765 | 752 | 154.7 |
| B | 4 | 239 | 744485 | 5224.28 | 769 | 752 | 142.4 |
| B | 0 | 187 | 70258 | 488.24 | 769 | 752 | 142.4 |
| B | 4 | 173 | 19374 | 130.81 | 769 | 752 | 142.4 |
| C | 15 | 208 | 71206 | 408.67 | 756 | 761 | 172.4 |
| C | 14 | 234 | 5845 | 29.49 | 756 | 761 | 172.4 |
| C | 13 | 61 | 5473 | 27.34 | 756 | 761 | 172.4 |
| D | 14 | 34 | 187054 | 1068.95 | 734 | 714 | 174.3 |
| D | 8 | 195 | 112264 | 639.91 | 734 | 714 | 174.3 |
| D | 13 | 122 | 57333 | 324.8 | 734 | 714 | 174.3 |
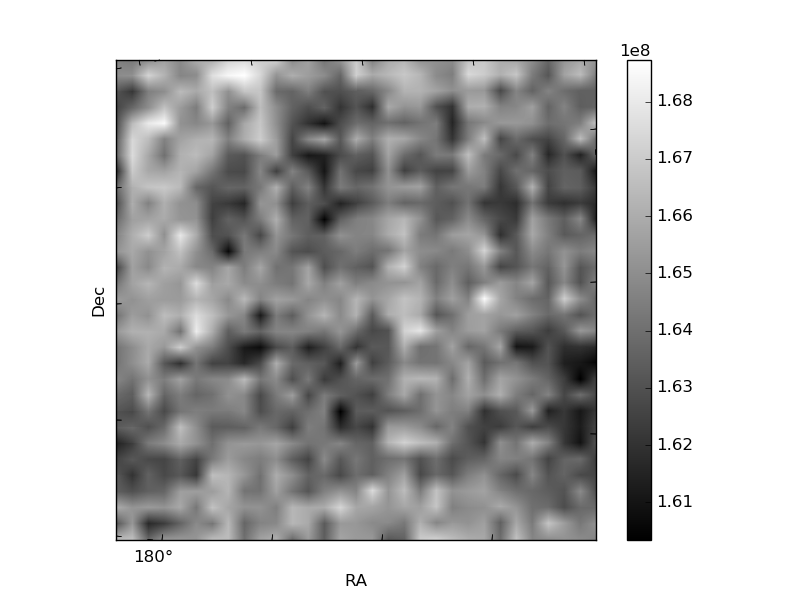
Histogram calculated using DETX and DETY for each event in the final _common_clean file
| Quadrant A | 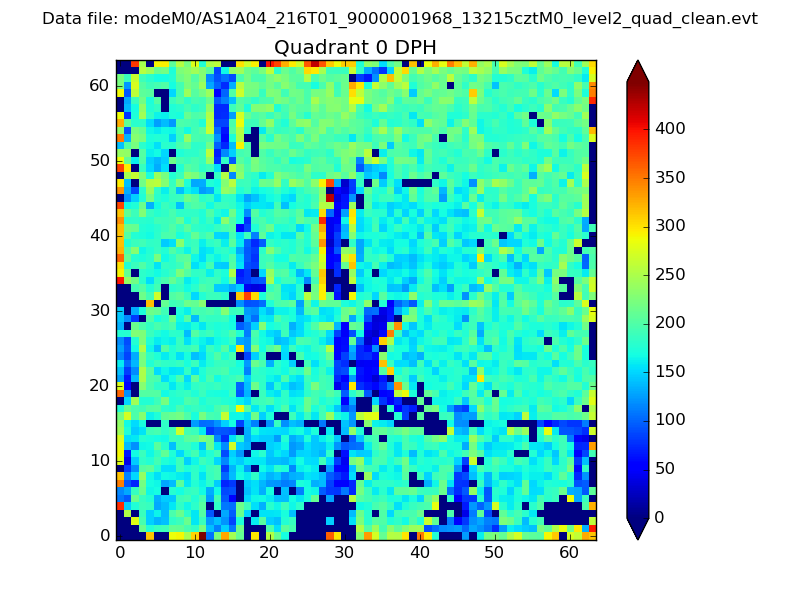 |
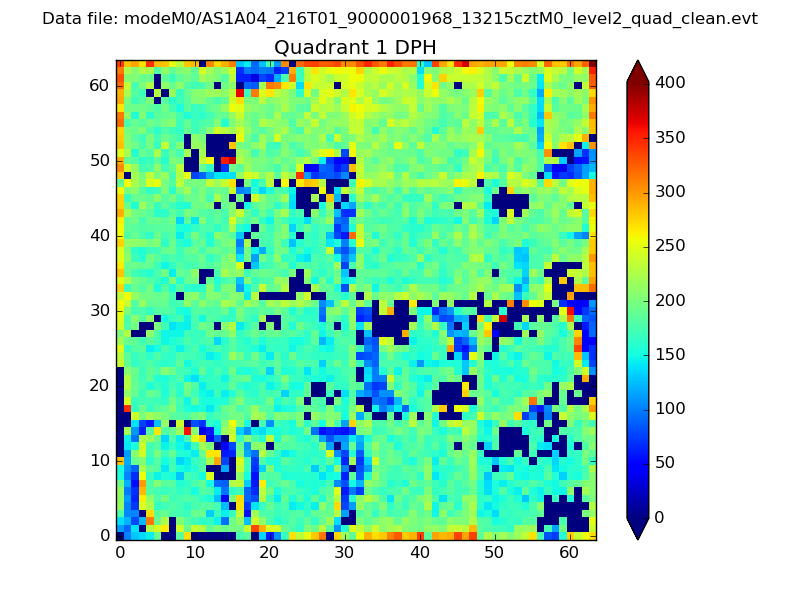 |
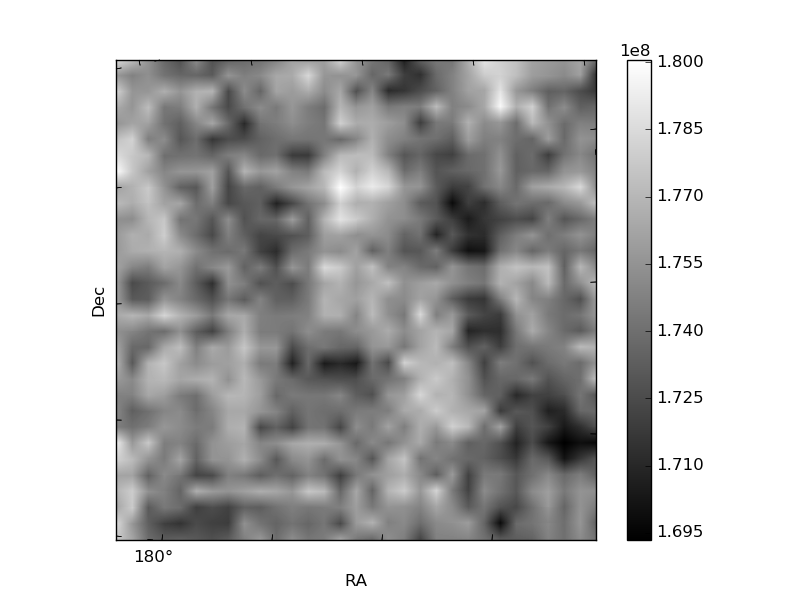
Quadrant B |
|---|---|---|---|
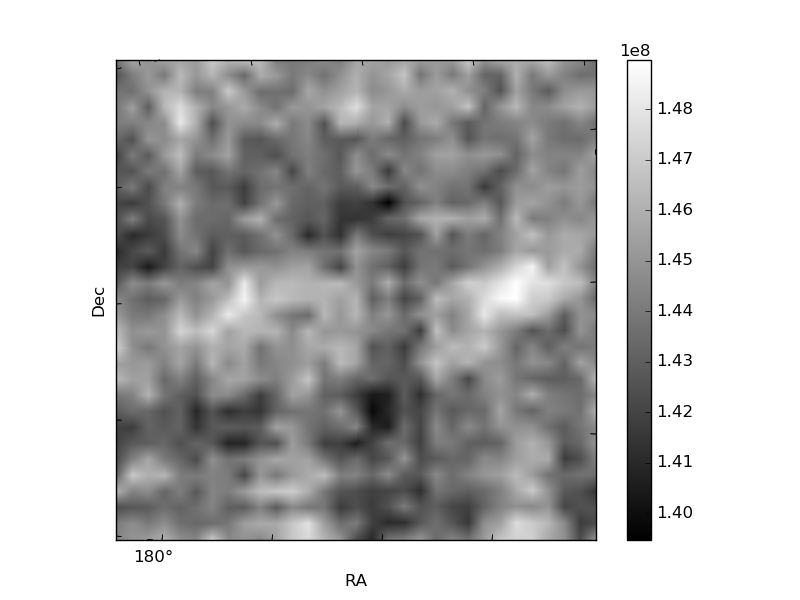
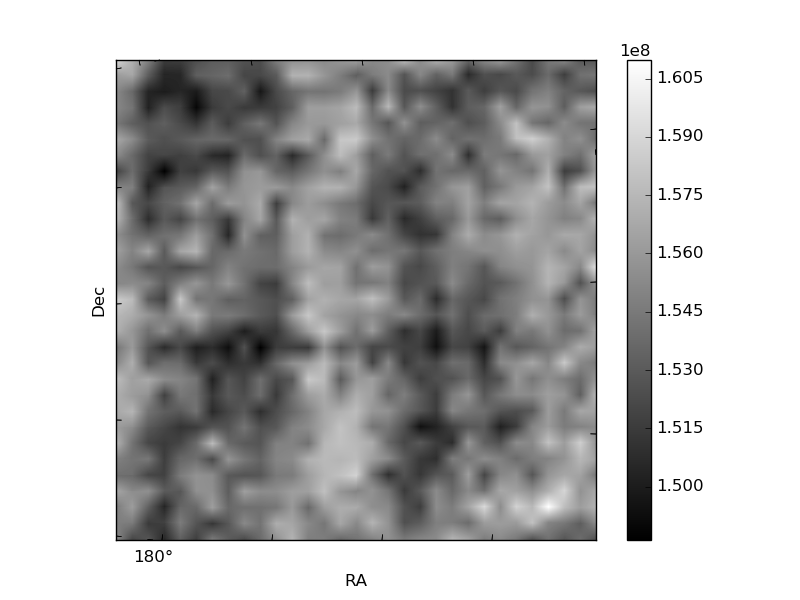
| Quadrant D | 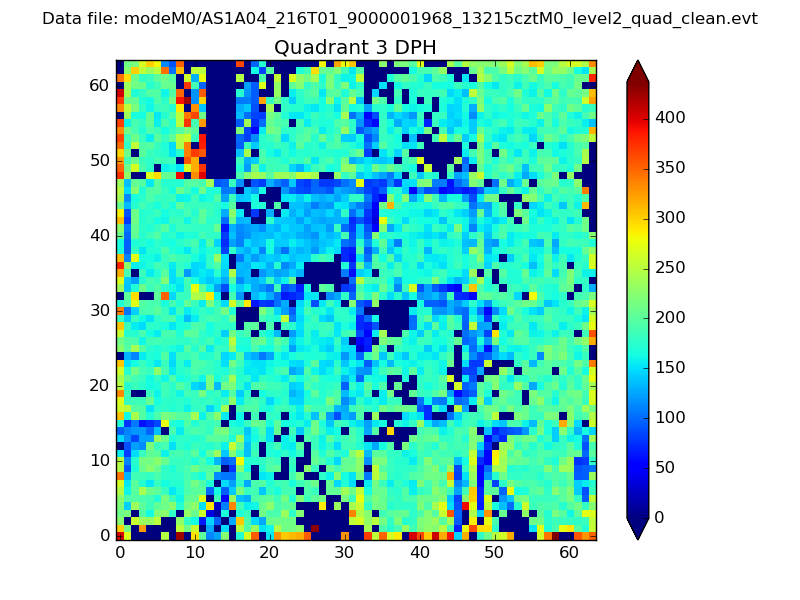 |
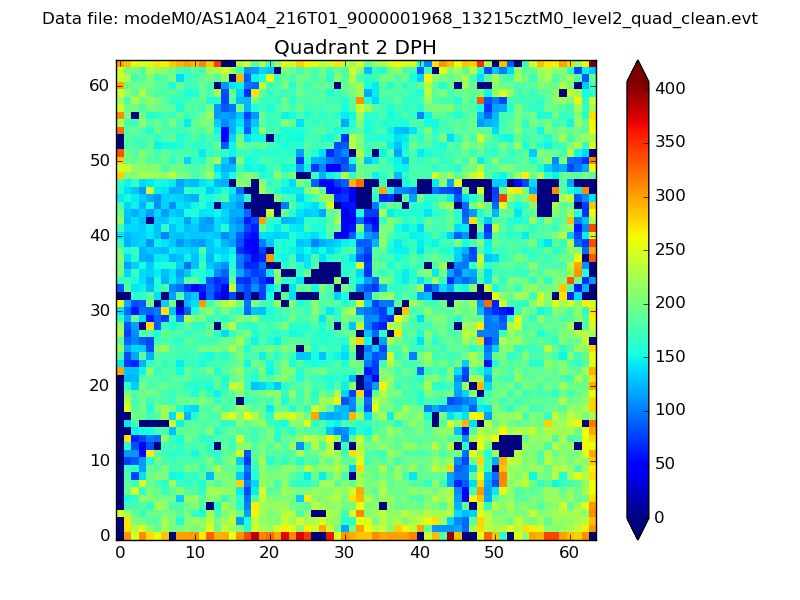 |
Quadrant C |
| Plot type | Count rate plots | Images |
|---|---|---|
| Comparison with Poisson distribution Blue bars denote a histogram of data divided into 1 sec bins. Red curve is a Poisson curve with rate = median count rate of data. |
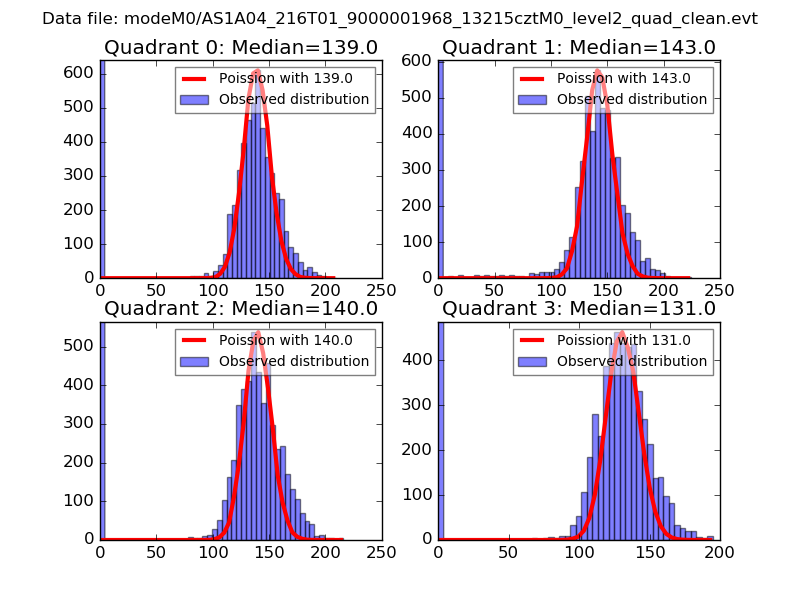 |
 |
| Quadrant-wise count rates Data is divided into 100 sec bins |
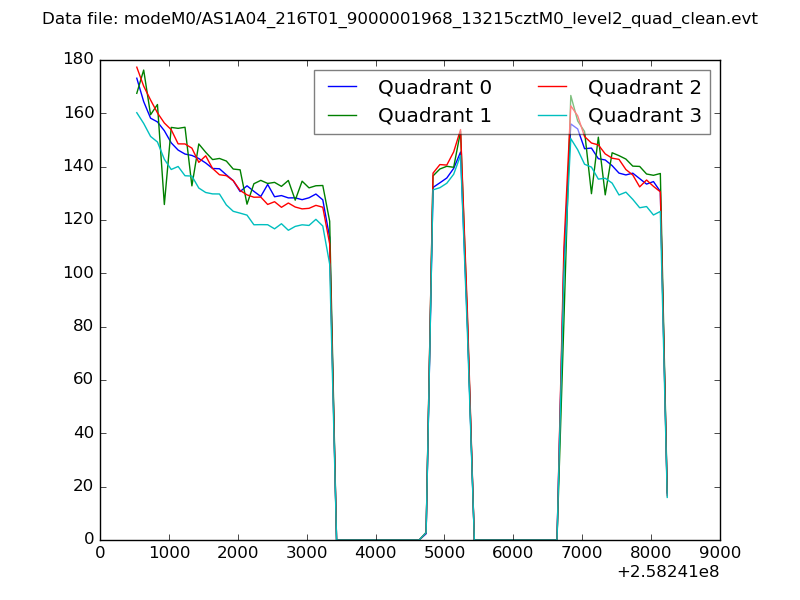 |
|
| Module-wise count rates for Quadrant A Data is divided into 100 sec bins |
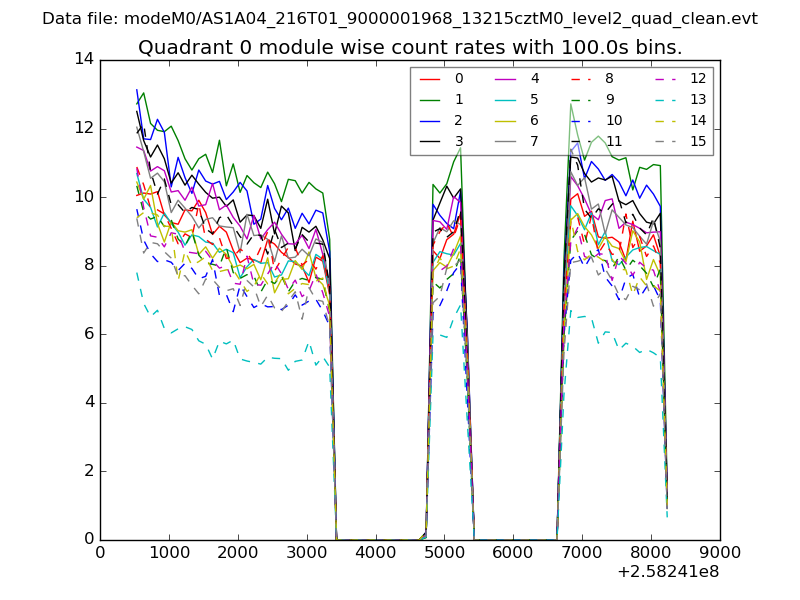 |
 |
| Module-wise count rates for Quadrant B Data is divided into 100 sec bins |
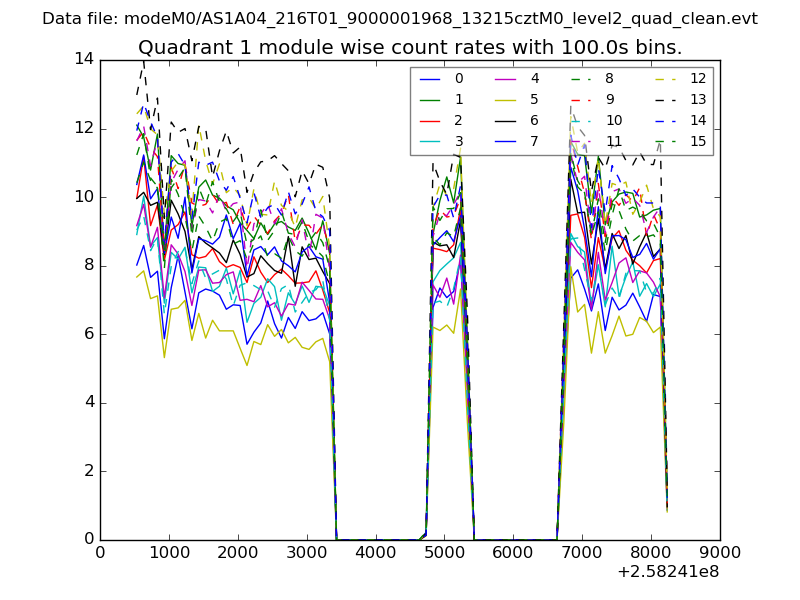 |
 |
| Module-wise count rates for Quadrant C Data is divided into 100 sec bins |
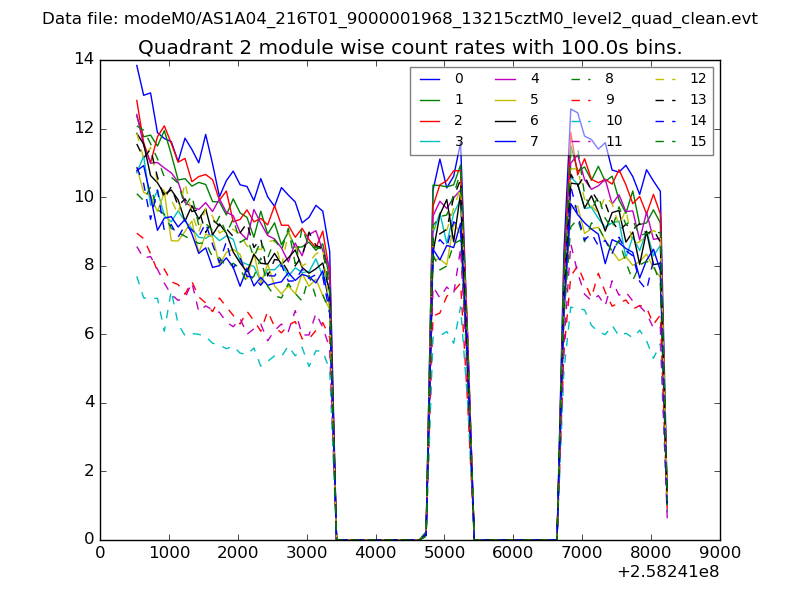 |
 |
| Module-wise count rates for Quadrant D Data is divided into 100 sec bins |
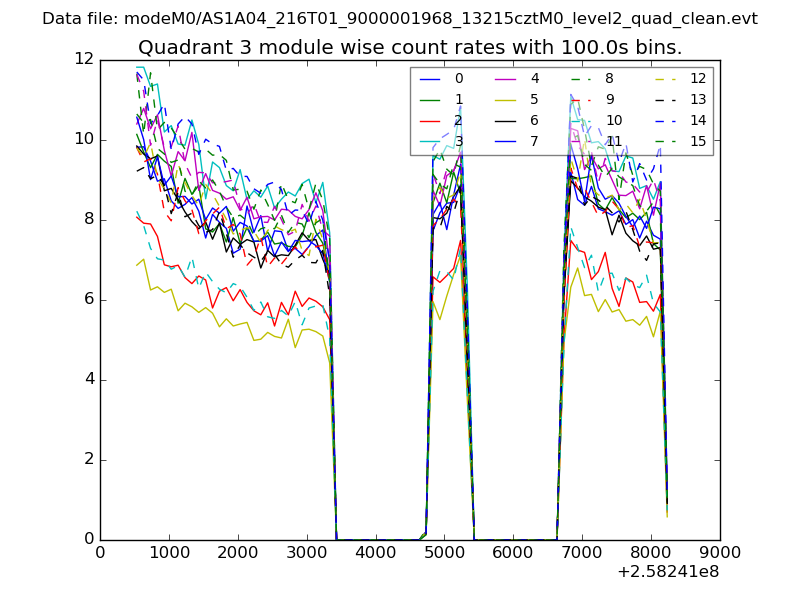 |
 |
| Parameter | Plot |
|---|---|
| CZT HV Monitor | 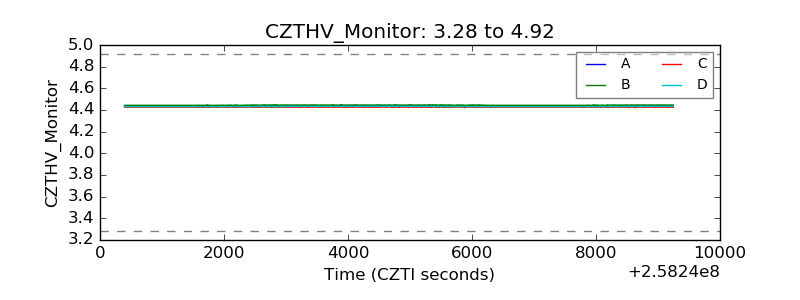 |
| D_VDD | 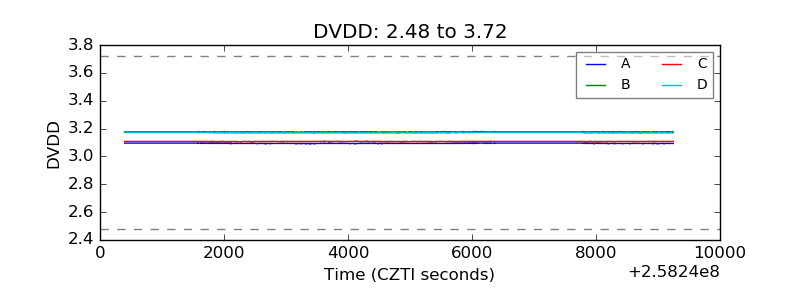 |
| Temperature 1 | 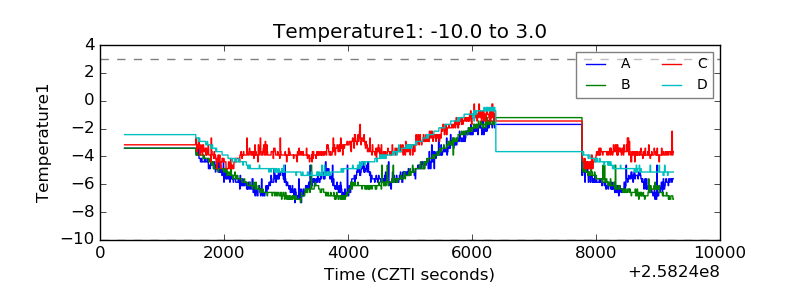 |
| Veto HV Monitor | 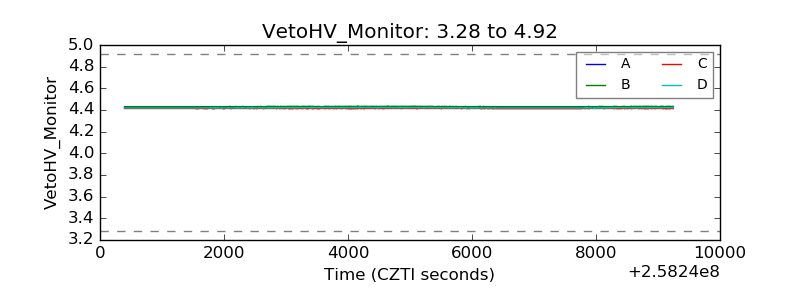 |
| Veto LLD | 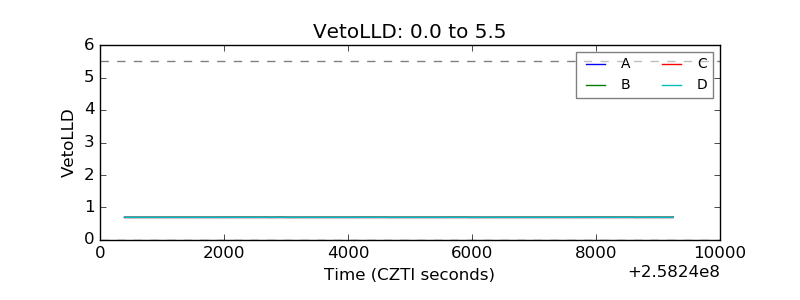 |
| Alpha Counter | 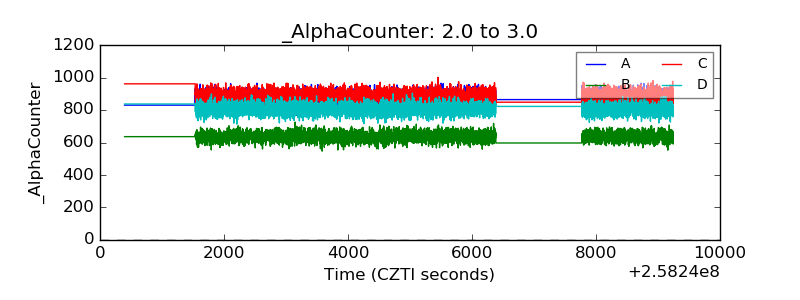 |
| _CPM_Rate | 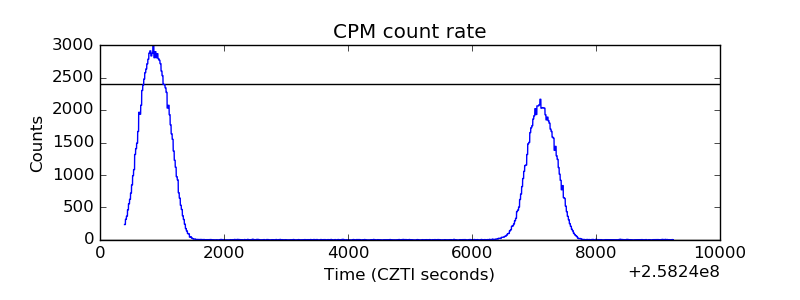 |
| CZT Counter | 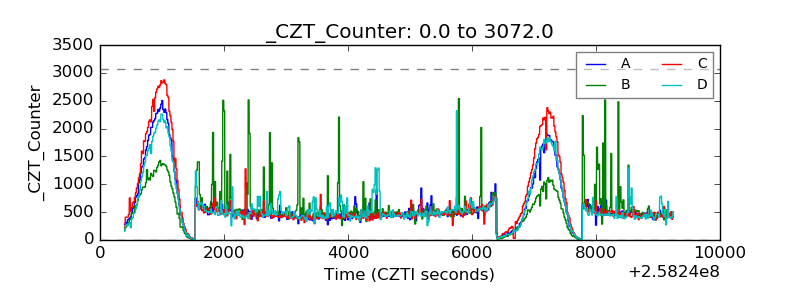 |
| +2.5 Volts monitor |  |
| +5 Volts monitor |  |
| _ROLL_ROT | 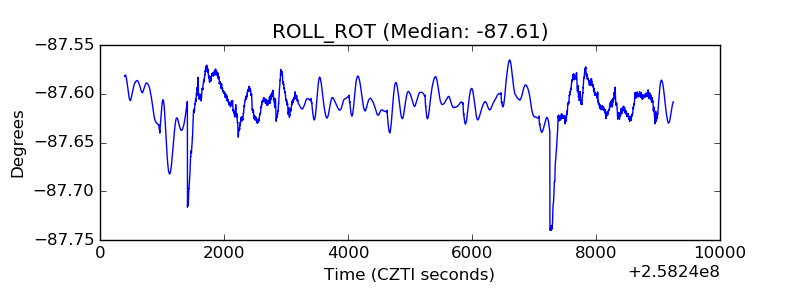 |
| _Roll_DEC | 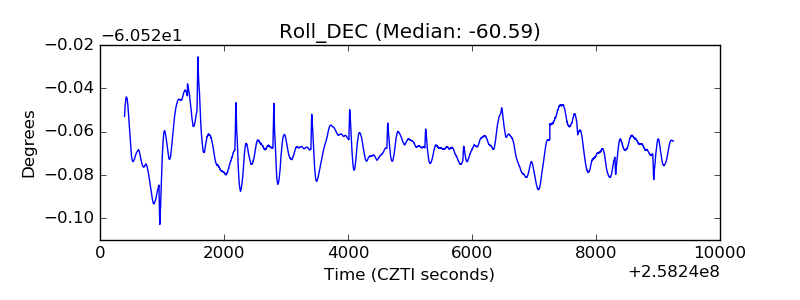 |
| _Roll_RA | 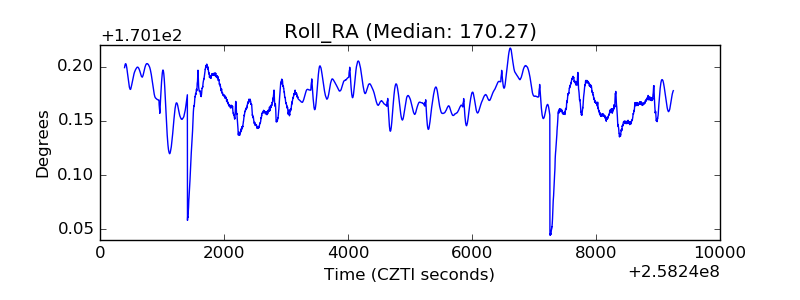 |
| Veto Counter | 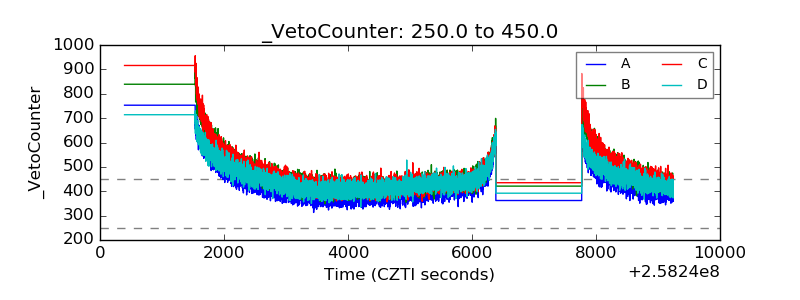 |