| Param | Original file | Final file |
|---|---|---|
| Filename | modeM0/AS1A04_216T01_9000001968_13216cztM0_level2.evt | modeM0/AS1A04_216T01_9000001968_13216cztM0_level2_quad_clean.evt |
| Size (bytes) | 485,867,520 | 106,079,040 |
| Size | 463.4 MB | 101.2 MB |
| Events in quadrant A | 3,236,811 | 699,010 |
| Events in quadrant B | 4,171,018 | 695,349 |
| Events in quadrant C | 3,081,555 | 706,718 |
| Events in quadrant D | 3,776,689 | 651,125 |
| Mode M0 | |||
|---|---|---|---|
| Quadrant | BADHDUFLAG | Total packets | Discarded packets |
| A | 0 | 13949 | 3 |
| B | 0 | 16743 | 2 |
| C | 0 | 13605 | 2 |
| D | 0 | 15844 | 2 |
| Mode M9 | |||
|---|---|---|---|
| Quadrant | BADHDUFLAG | Total packets | Discarded packets |
| A | 0 | 25 | 0 |
| B | 0 | 25 | 0 |
| C | 0 | 25 | 0 |
| D | 0 | 26 | 0 |
| Mode SS | |||
|---|---|---|---|
| Quadrant | BADHDUFLAG | Total packets | Discarded packets |
| A | 0 | 134 | 0 |
| B | 0 | 134 | 0 |
| C | 0 | 134 | 0 |
| D | 0 | 134 | 0 |
| Quadrant | Total seconds | Saturated seconds | Saturation percentage |
|---|---|---|---|
| A | 6602 | 32 | 0.484702% |
| B | 6602 | 437 | 6.619206% |
| C | 6602 | 26 | 0.393820% |
| D | 6602 | 155 | 2.347773% |
Noise dominated data is calculated using 1-second bins in cleaned event files. If a bin has >2000 counts, and if more than 50% of those come from <1% of pixels, then it is considered to be noise-dominated and hence unusable.
| Quadrant | # 1 sec bins | Bins with >0 counts | Bins with >2000 counts | High rate bins dominated by noise | Noise dominated (total time) | Noise dominated (detector-on time) | Marked lightcurve |
|---|---|---|---|---|---|---|---|
| A | 7828 | 6604 | 7 | 7 | 0.09% | 0.11% | 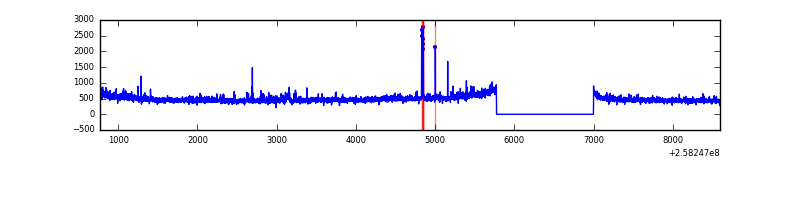 |
| B | 7828 | 6604 | 230 | 230 | 2.94% | 3.48% | 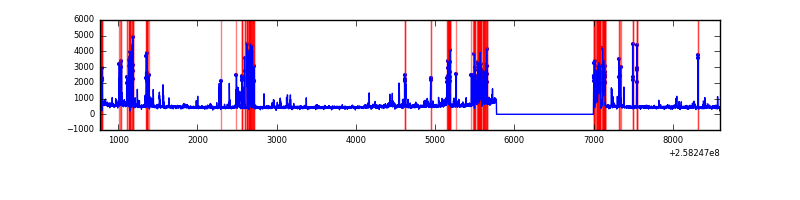 |
| C | 7828 | 6604 | 4 | 4 | 0.05% | 0.06% | 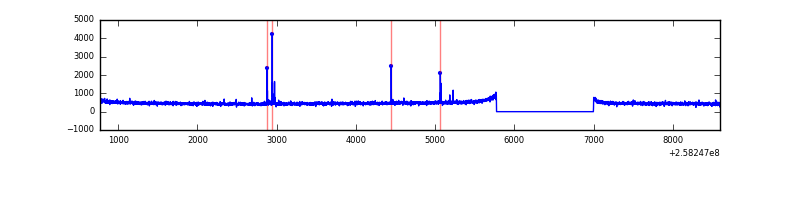 |
| D | 7828 | 6604 | 62 | 62 | 0.79% | 0.94% | 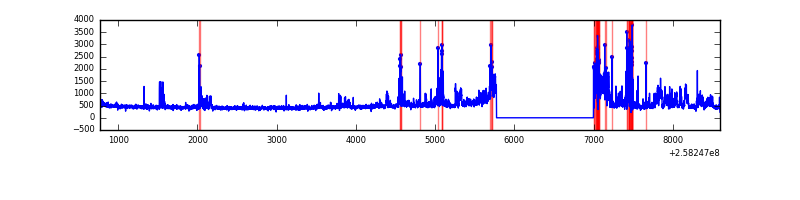 |
Top three noisy pixels from each quadrant. If the there are fewer than three noisy pixels in the level2.evt file, extra rows are filled as -1
| Pixel properties | Quadrant properties | ||||||
|---|---|---|---|---|---|---|---|
| Quadrant | DetID | PixID | Counts | Sigma | Mean | Median | Sigma |
| A | 8 | 15 | 74791 | 464.01 | 786 | 771 | 159.5 |
| A | 1 | 162 | 40639 | 249.92 | 786 | 771 | 159.5 |
| A | 15 | 69 | 31130 | 190.31 | 786 | 771 | 159.5 |
| B | 4 | 239 | 999042 | 6917.26 | 778 | 759 | 144.3 |
| B | 3 | 64 | 41618 | 283.12 | 778 | 759 | 144.3 |
| B | 4 | 173 | 25961 | 174.63 | 778 | 759 | 144.3 |
| C | 15 | 208 | 32564 | 178.68 | 779 | 782 | 177.9 |
| C | 13 | 61 | 5883 | 28.68 | 779 | 782 | 177.9 |
| C | 14 | 234 | 5216 | 24.93 | 779 | 782 | 177.9 |
| D | 8 | 195 | 314245 | 1741.2 | 754 | 733 | 180.1 |
| D | 1 | 52 | 304636 | 1687.83 | 754 | 733 | 180.1 |
| D | 13 | 122 | 223223 | 1235.68 | 754 | 733 | 180.1 |
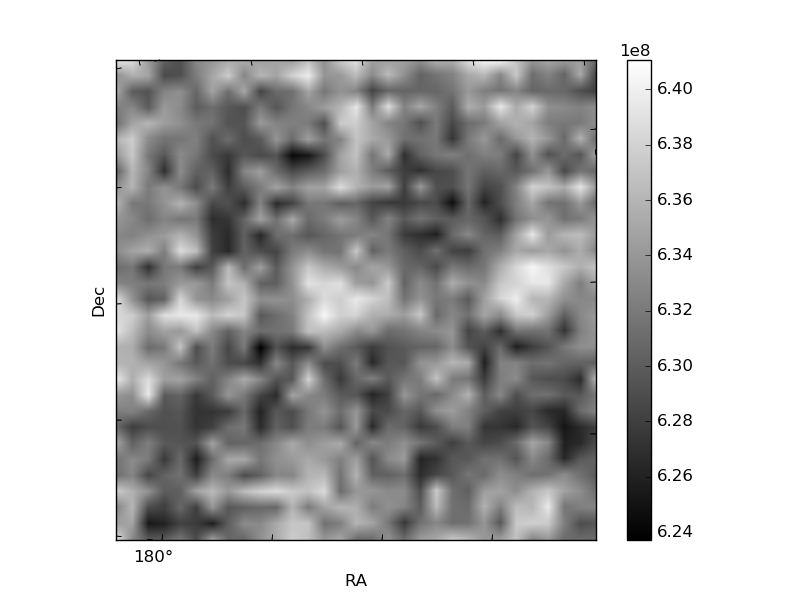
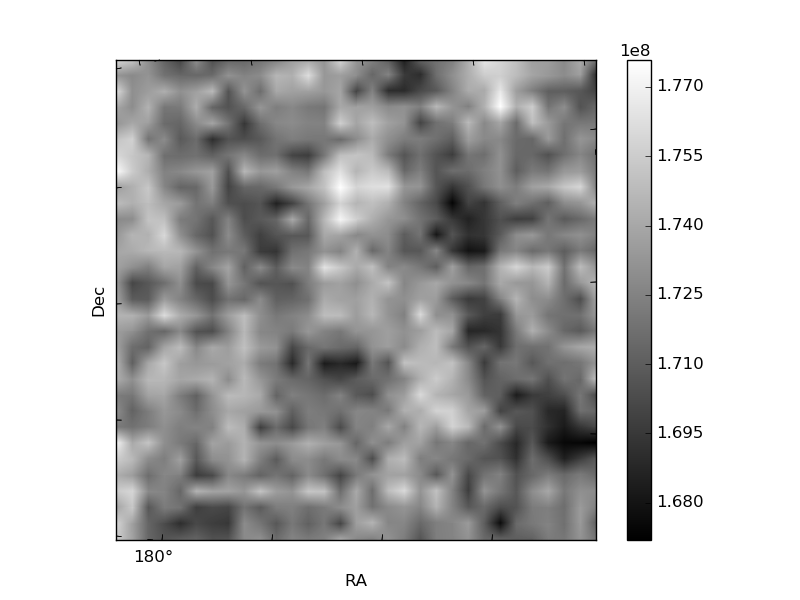
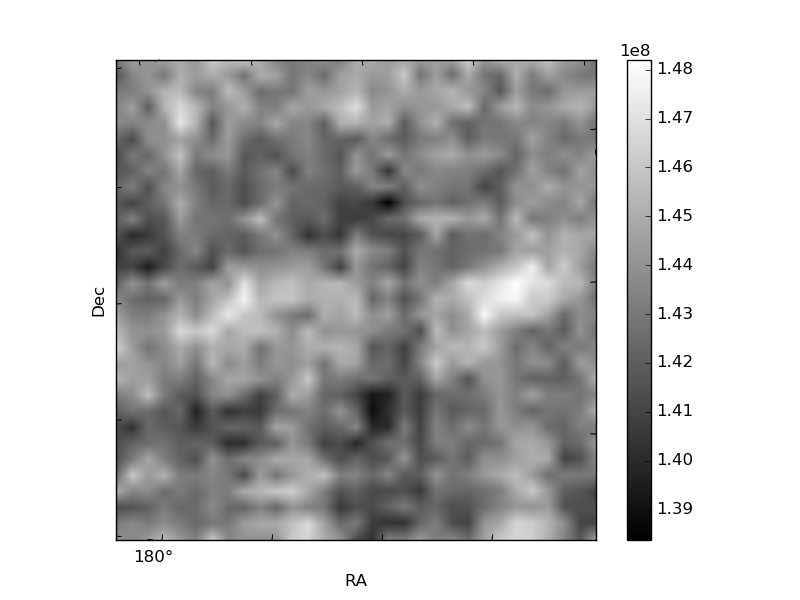
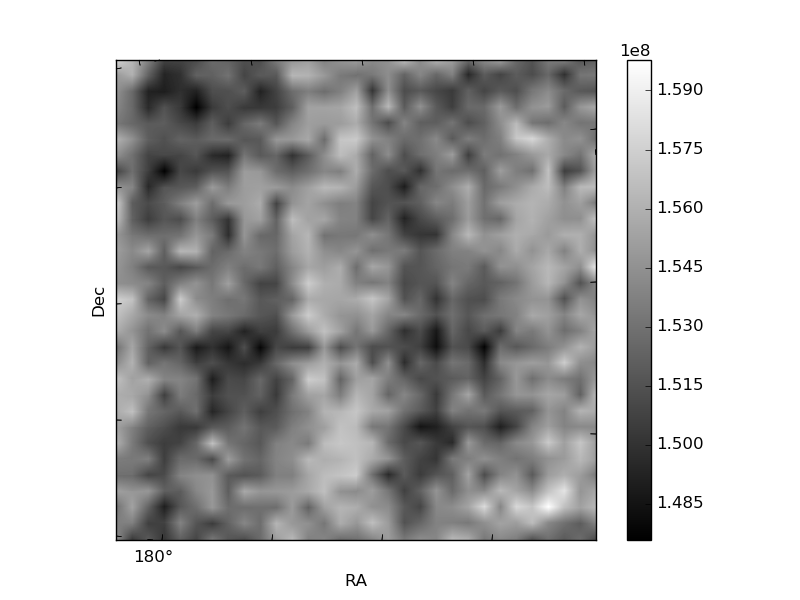
Histogram calculated using DETX and DETY for each event in the final _common_clean file
| Quadrant A |  |
 |
Quadrant B |
|---|---|---|---|
| Quadrant D |  |
 |
Quadrant C |
| Plot type | Count rate plots | Images |
|---|---|---|
| Comparison with Poisson distribution Blue bars denote a histogram of data divided into 1 sec bins. Red curve is a Poisson curve with rate = median count rate of data. |
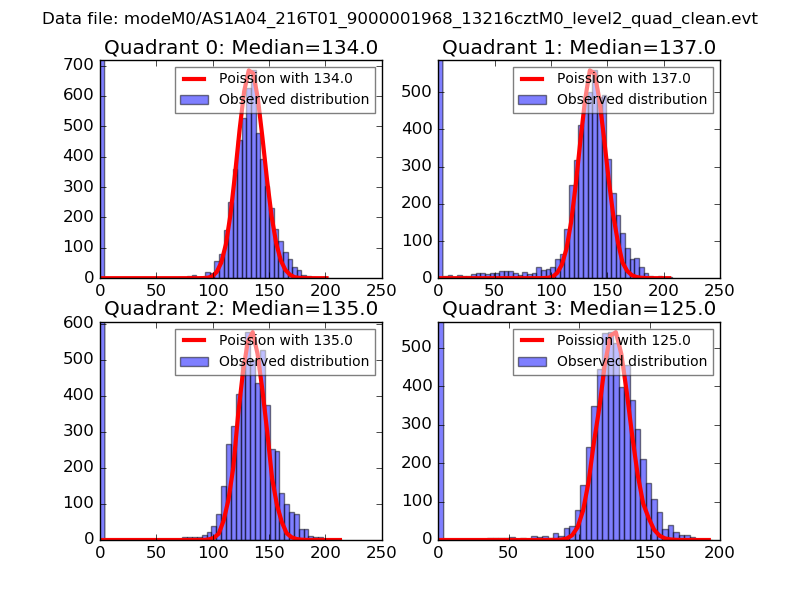 |
 |
| Quadrant-wise count rates Data is divided into 100 sec bins |
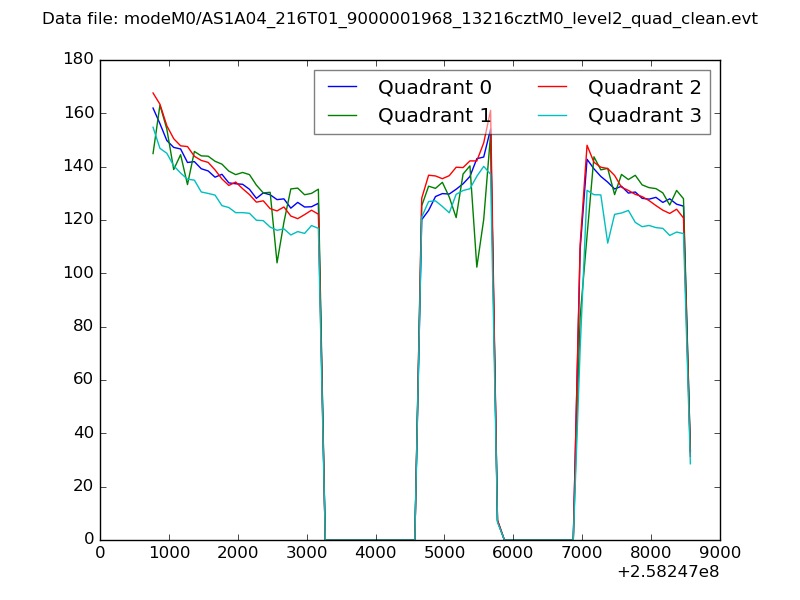 |
|
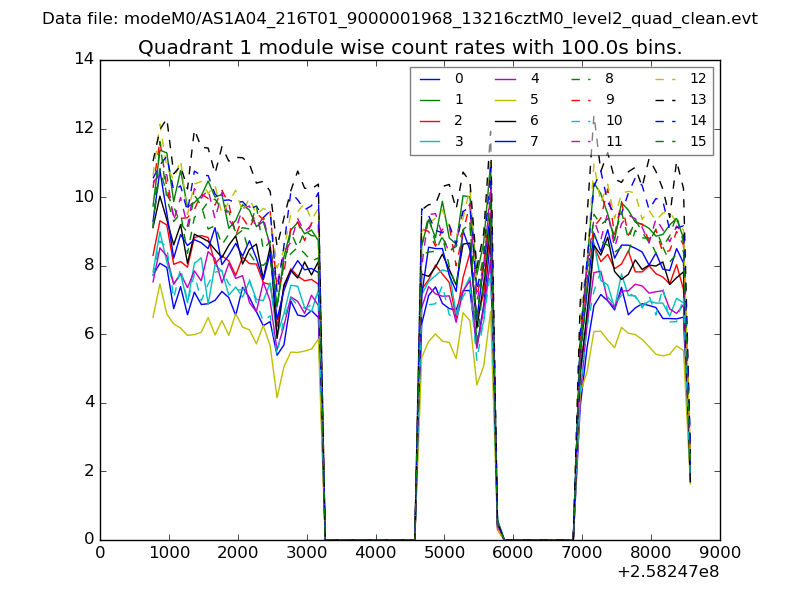
| Module-wise count rates for Quadrant A Data is divided into 100 sec bins |
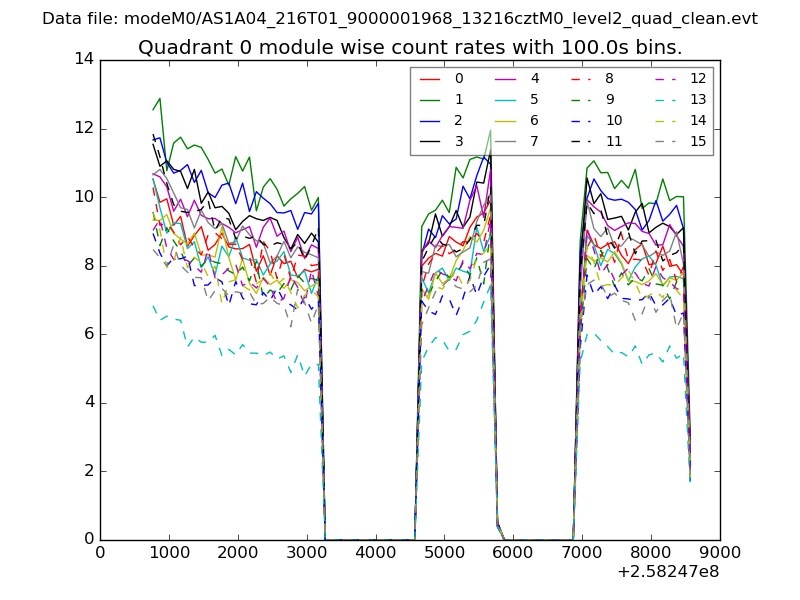 |
 |
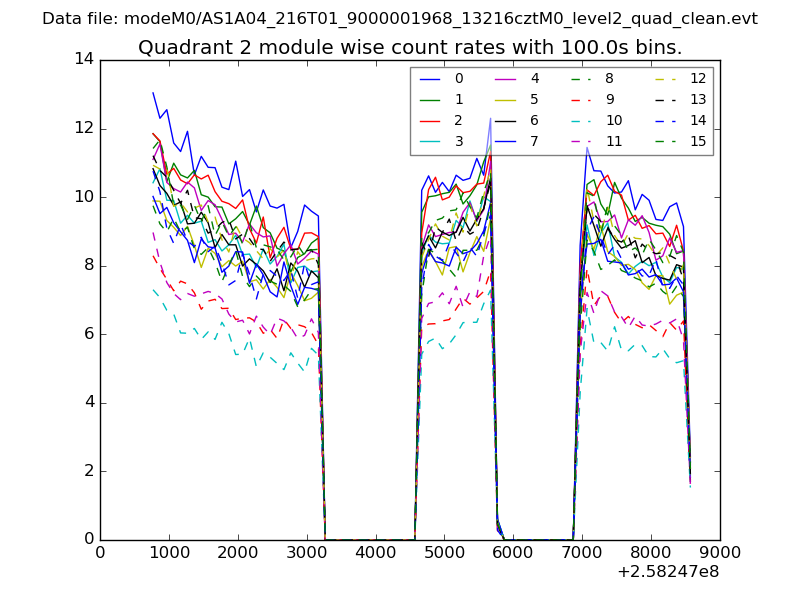
| Module-wise count rates for Quadrant B Data is divided into 100 sec bins |
 |
 |
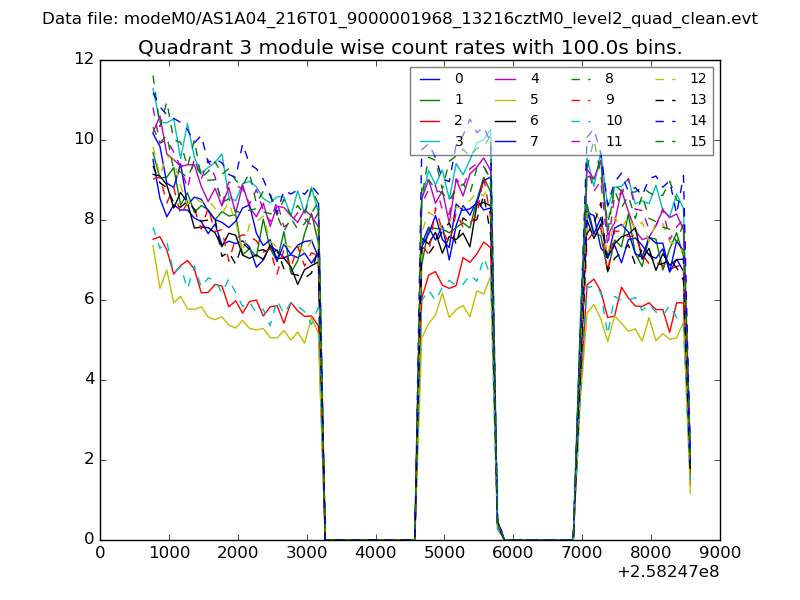
| Module-wise count rates for Quadrant C Data is divided into 100 sec bins |
 |
 |
| Module-wise count rates for Quadrant D Data is divided into 100 sec bins |
 |
 |
| Parameter | Plot |
|---|---|
| CZT HV Monitor | 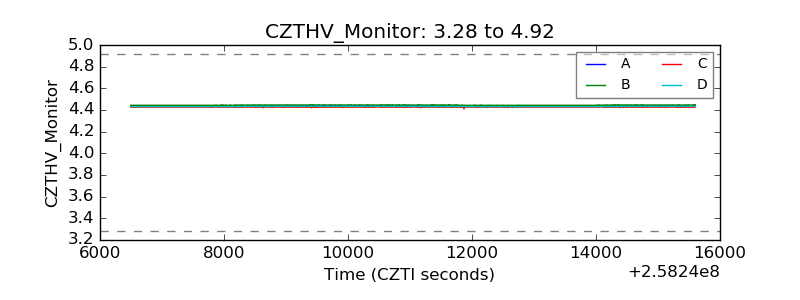 |
| D_VDD | 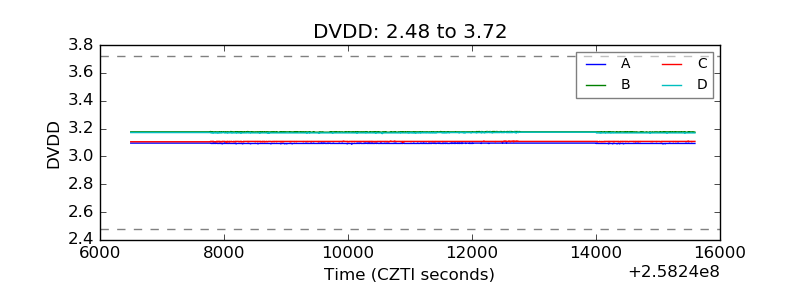 |
| Temperature 1 | 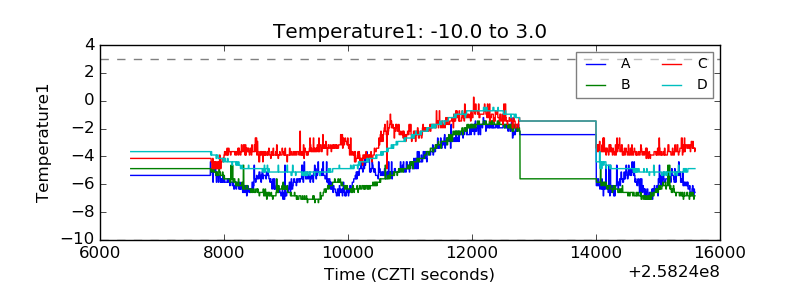 |
| Veto HV Monitor | 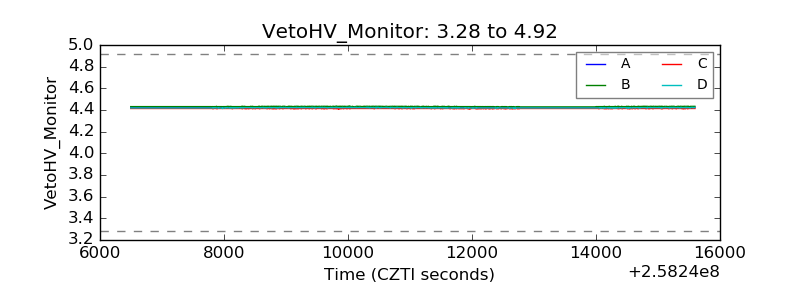 |
| Veto LLD | 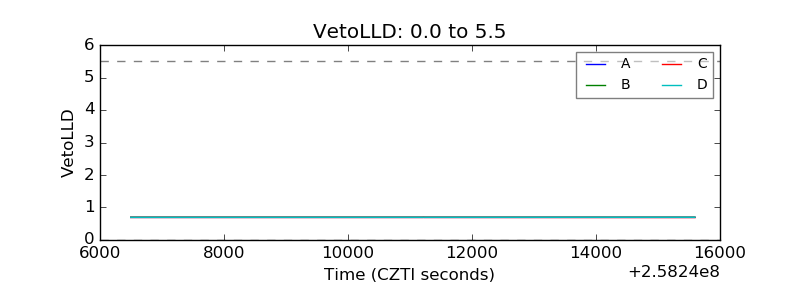 |
| Alpha Counter | 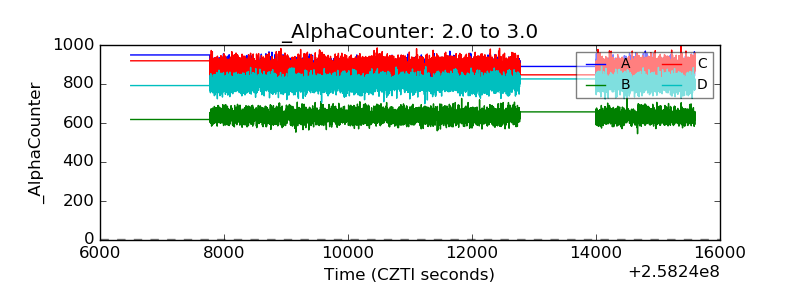 |
| _CPM_Rate | 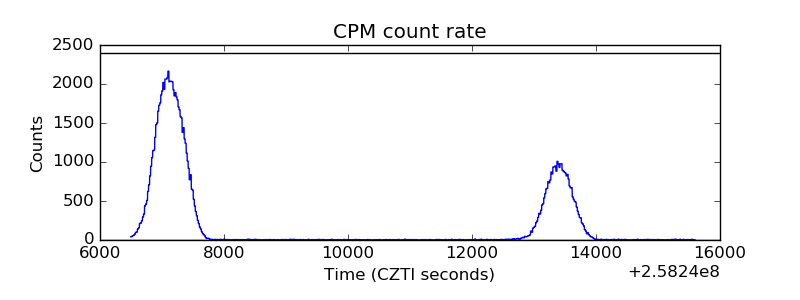 |
| CZT Counter |  |
| +2.5 Volts monitor |  |
| +5 Volts monitor | 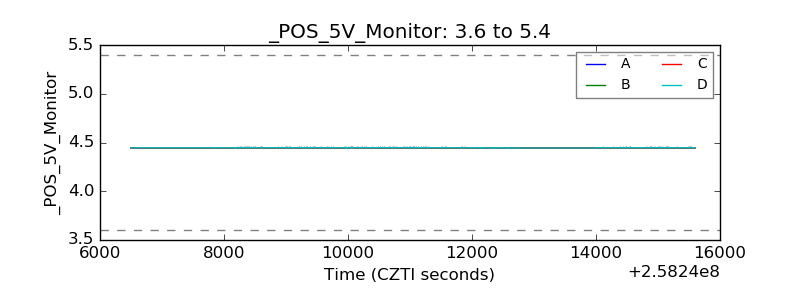 |
| _ROLL_ROT | 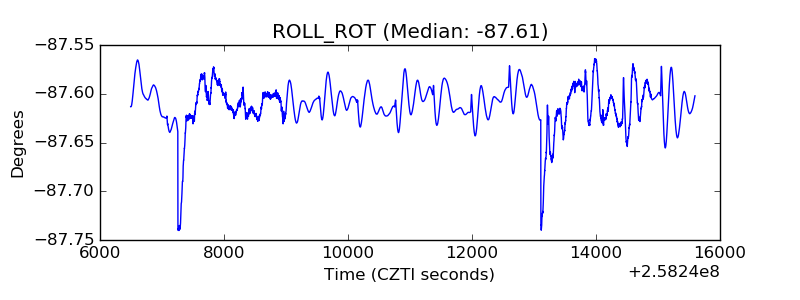 |
| _Roll_DEC | 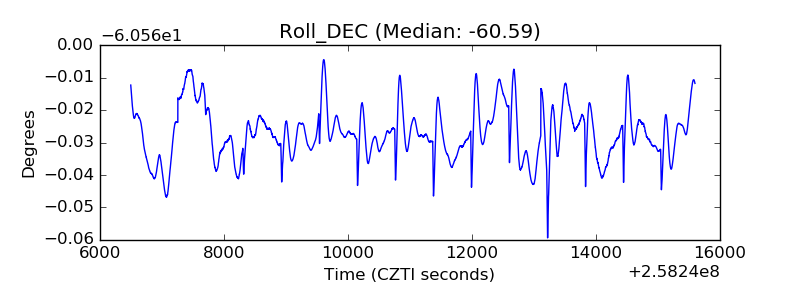 |
| _Roll_RA | 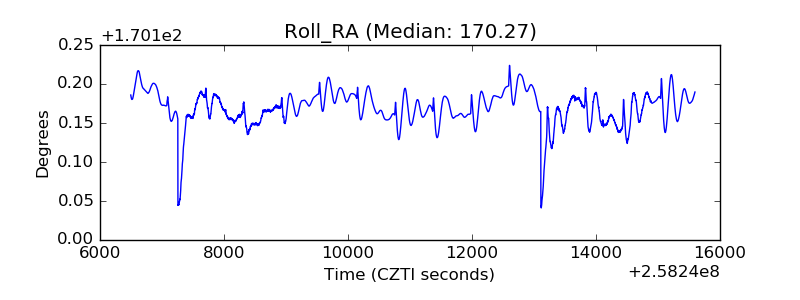 |
| Veto Counter | 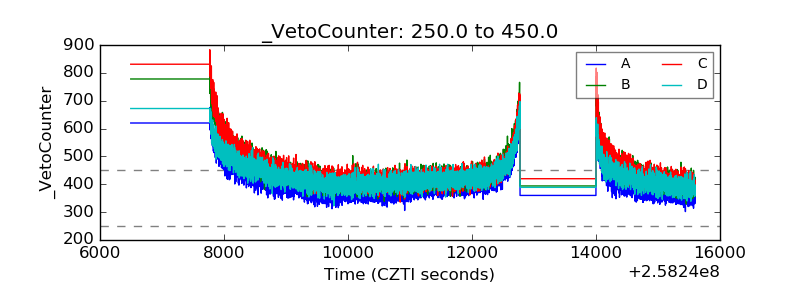 |