| Param | Original file | Final file |
|---|---|---|
| Filename | modeM0/AS1A04_216T01_9000001968_13224cztM0_level2.evt | modeM0/AS1A04_216T01_9000001968_13224cztM0_level2_quad_clean.evt |
| Size (bytes) | 1,615,855,680 | 290,802,240 |
| Size | 1.5 GB | 277.3 MB |
| Events in quadrant A | 9,550,000 | 1,931,378 |
| Events in quadrant B | 16,751,626 | 1,732,161 |
| Events in quadrant C | 8,772,765 | 1,947,555 |
| Events in quadrant D | 12,533,720 | 1,840,908 |
| Mode M0 | |||
|---|---|---|---|
| Quadrant | BADHDUFLAG | Total packets | Discarded packets |
| A | 0 | 43208 | 1095 |
| B | 0 | 64144 | 1337 |
| C | 0 | 41449 | 1160 |
| D | 0 | 52189 | 1378 |
| Mode M9 | |||
|---|---|---|---|
| Quadrant | BADHDUFLAG | Total packets | Discarded packets |
| A | 0 | 27 | 0 |
| B | 0 | 27 | 0 |
| C | 0 | 27 | 0 |
| D | 0 | 27 | 0 |
| Mode SS | |||
|---|---|---|---|
| Quadrant | BADHDUFLAG | Total packets | Discarded packets |
| A | 0 | 413 | 7 |
| B | 0 | 415 | 11 |
| C | 0 | 413 | 7 |
| D | 0 | 416 | 10 |
| Quadrant | Total seconds | Saturated seconds | Saturation percentage |
|---|---|---|---|
| A | 19659 | 469 | 2.385676% |
| B | 19651 | 3487 | 17.744644% |
| C | 19654 | 266 | 1.353414% |
| D | 19649 | 409 | 2.081531% |
Noise dominated data is calculated using 1-second bins in cleaned event files. If a bin has >2000 counts, and if more than 50% of those come from <1% of pixels, then it is considered to be noise-dominated and hence unusable.
| Quadrant | # 1 sec bins | Bins with >0 counts | Bins with >2000 counts | High rate bins dominated by noise | Noise dominated (total time) | Noise dominated (detector-on time) | Marked lightcurve |
|---|---|---|---|---|---|---|---|
| A | 23502 | 19698 | 109 | 109 | 0.46% | 0.55% | 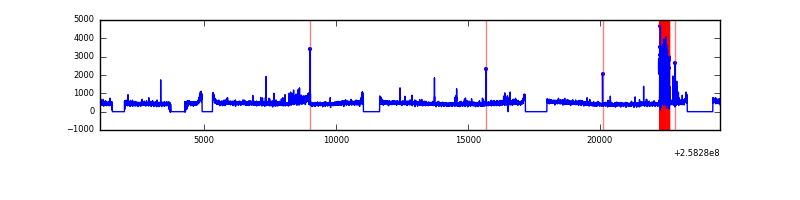 |
| B | 23500 | 19687 | 2063 | 2063 | 8.78% | 10.48% |  |
| C | 23501 | 19689 | 3 | 3 | 0.01% | 0.02% | 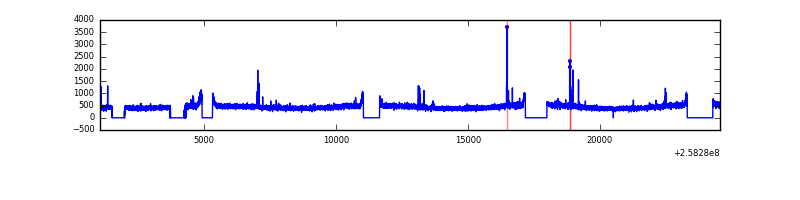 |
| D | 23502 | 19686 | 92 | 92 | 0.39% | 0.47% |  |
Top three noisy pixels from each quadrant. If the there are fewer than three noisy pixels in the level2.evt file, extra rows are filled as -1
| Pixel properties | Quadrant properties | ||||||
|---|---|---|---|---|---|---|---|
| Quadrant | DetID | PixID | Counts | Sigma | Mean | Median | Sigma |
| A | 15 | 69 | 482057 | 1038.9 | 2265 | 2214 | 461.9 |
| A | 10 | 229 | 231101 | 495.56 | 2265 | 2214 | 461.9 |
| A | 1 | 162 | 43758 | 89.95 | 2265 | 2214 | 461.9 |
| B | 4 | 239 | 8076011 | 20377.51 | 2081 | 2027 | 396.2 |
| B | 5 | 32 | 286247 | 717.33 | 2081 | 2027 | 396.2 |
| B | 3 | 209 | 70601 | 173.07 | 2081 | 2027 | 396.2 |
| C | 15 | 208 | 89539 | 170.95 | 2220 | 2225 | 510.7 |
| C | 13 | 61 | 15916 | 26.81 | 2220 | 2225 | 510.7 |
| C | 8 | 128 | 15574 | 26.14 | 2220 | 2225 | 510.7 |
| D | 8 | 195 | 3511266 | 6700.7 | 2187 | 2124 | 523.7 |
| D | 1 | 52 | 553478 | 1052.81 | 2187 | 2124 | 523.7 |
| D | 2 | 234 | 75272 | 139.68 | 2187 | 2124 | 523.7 |
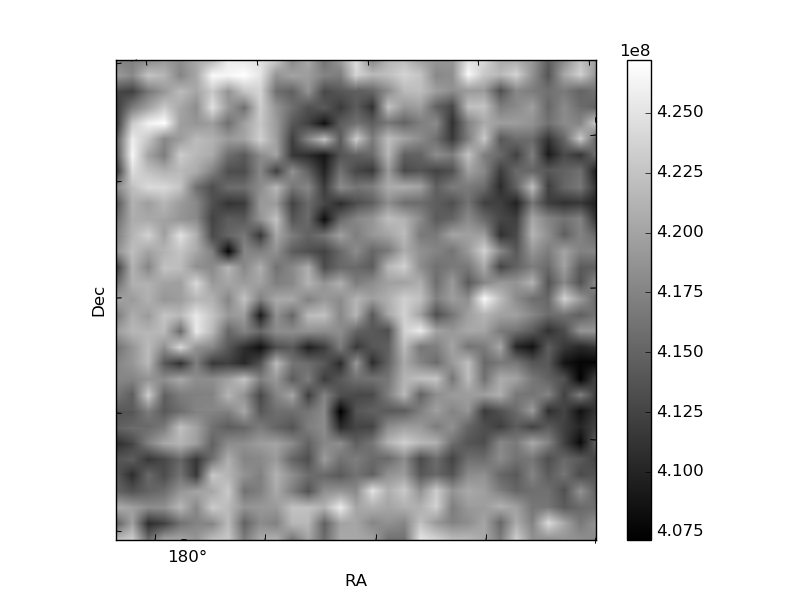
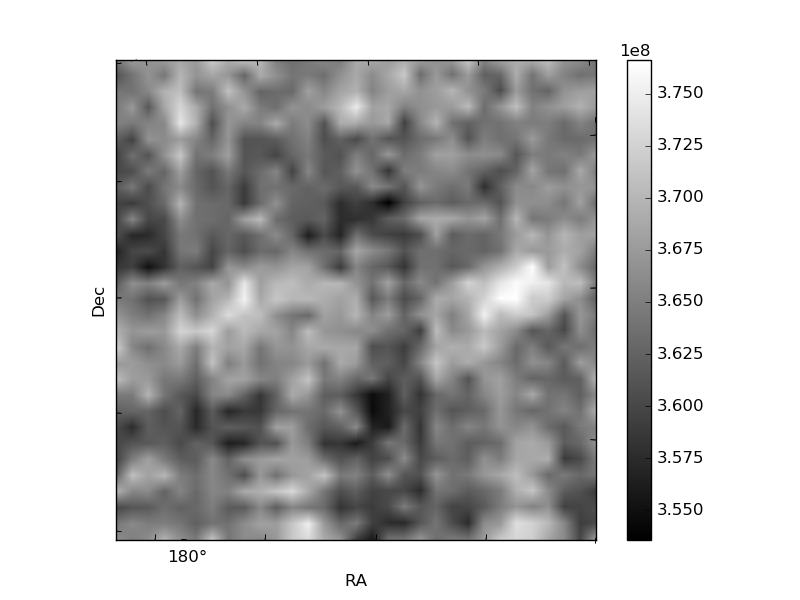
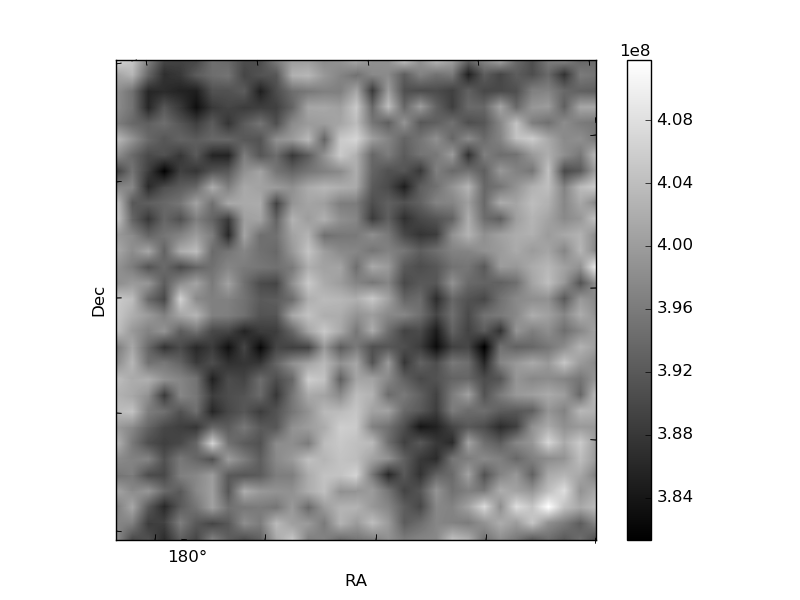
Histogram calculated using DETX and DETY for each event in the final _common_clean file
| Quadrant A | 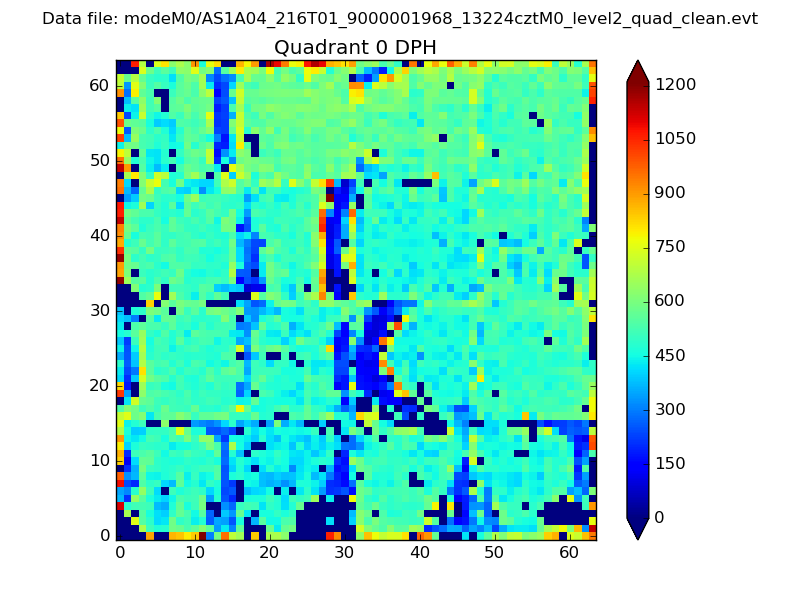 |
 |
Quadrant B |
|---|---|---|---|
| Quadrant D | 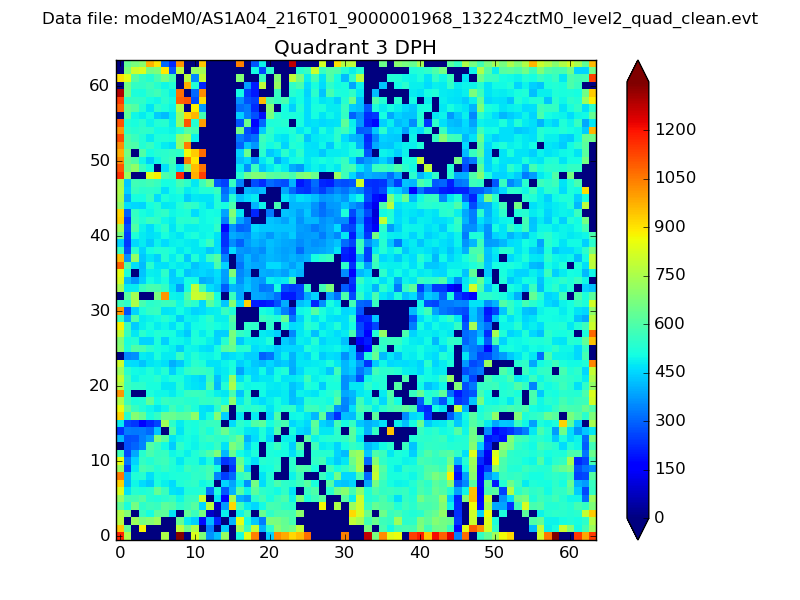 |
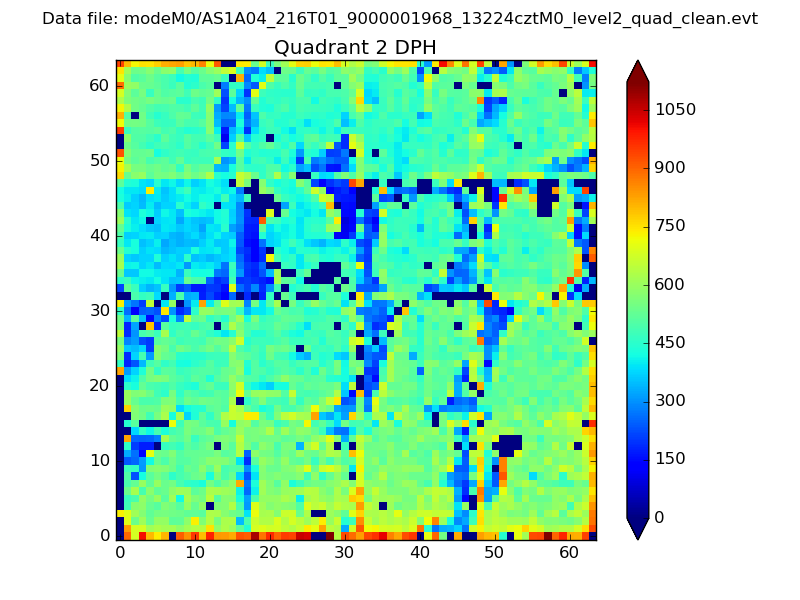 |
Quadrant C |
| Plot type | Count rate plots | Images |
|---|---|---|
| Comparison with Poisson distribution Blue bars denote a histogram of data divided into 1 sec bins. Red curve is a Poisson curve with rate = median count rate of data. |
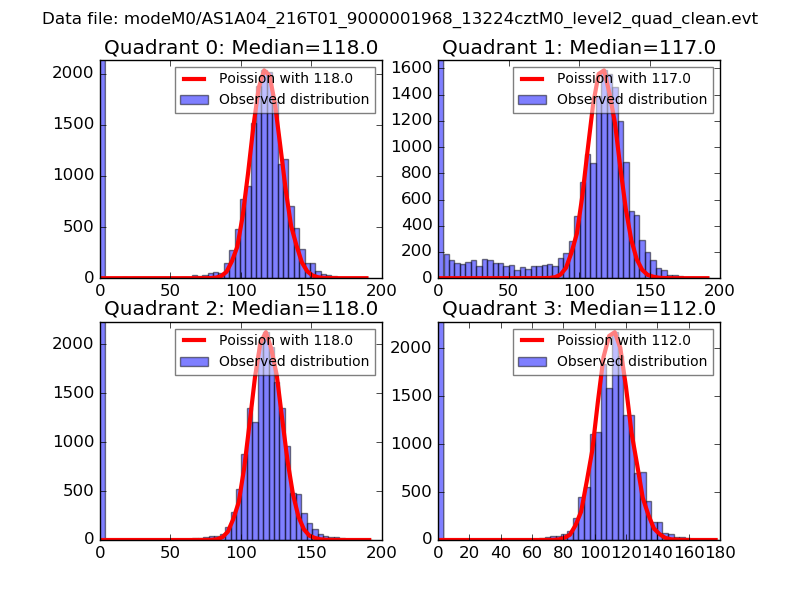 |
 |
| Quadrant-wise count rates Data is divided into 100 sec bins |
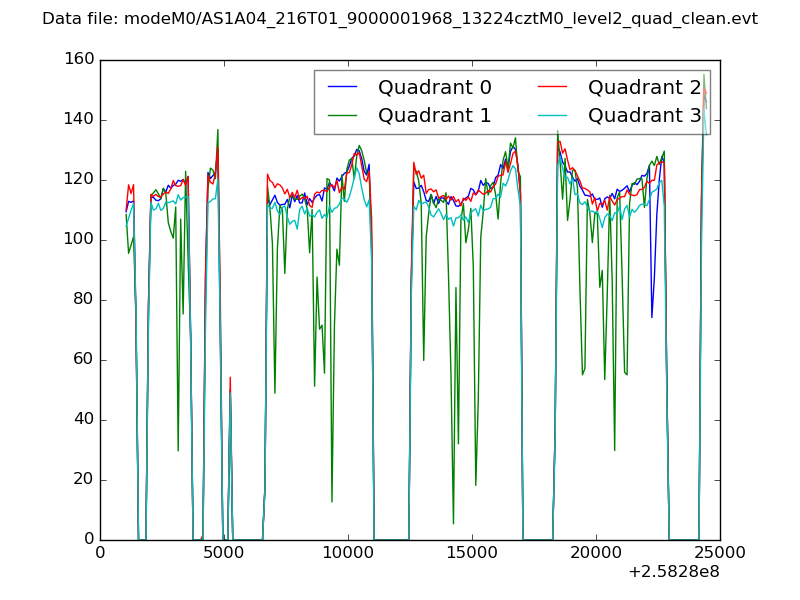 |
|
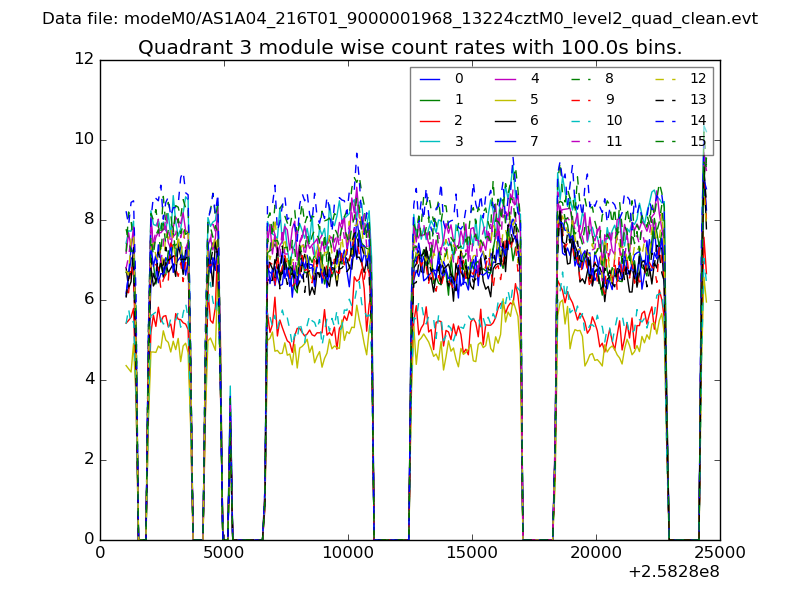
| Module-wise count rates for Quadrant A Data is divided into 100 sec bins |
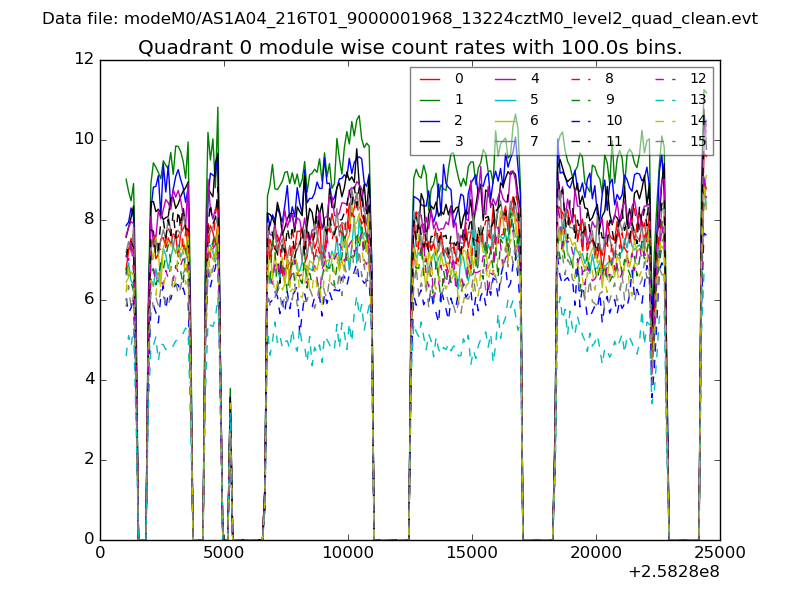 |
 |
| Module-wise count rates for Quadrant B Data is divided into 100 sec bins |
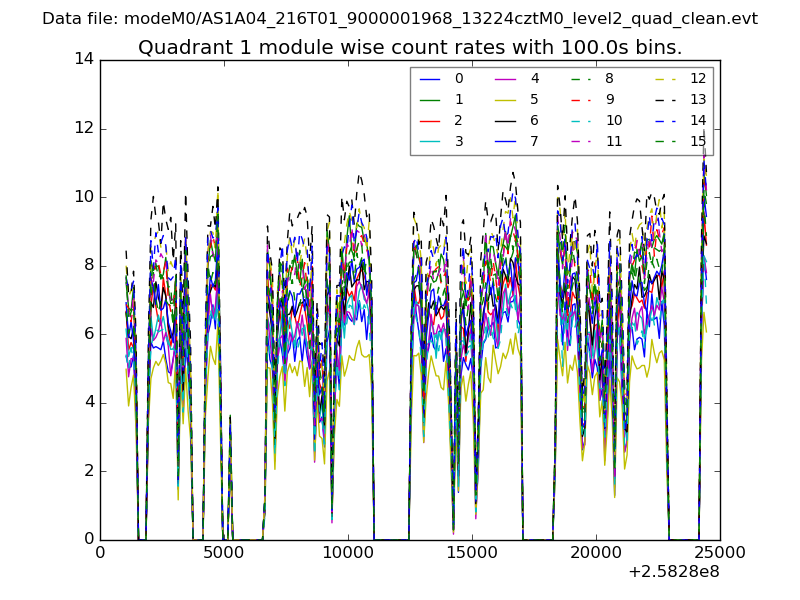 |
 |
| Module-wise count rates for Quadrant C Data is divided into 100 sec bins |
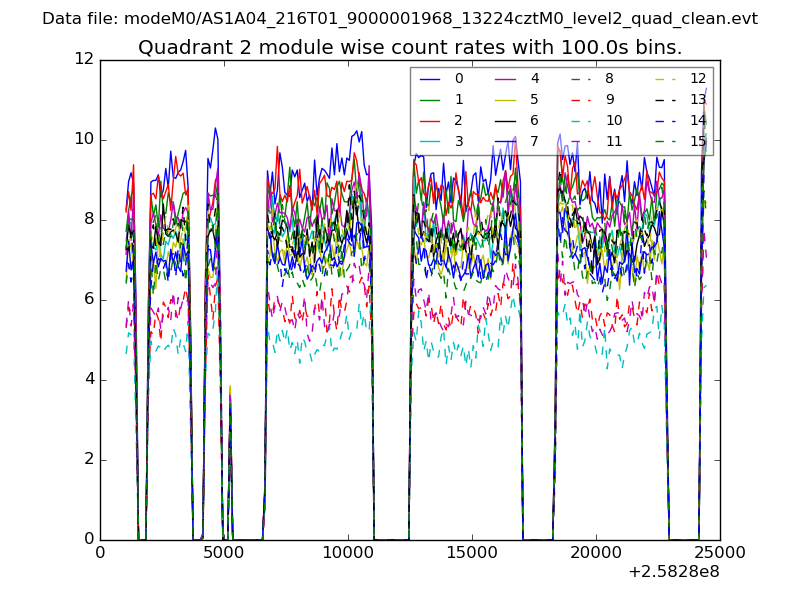 |
 |
| Module-wise count rates for Quadrant D Data is divided into 100 sec bins |
 |
 |
| Parameter | Plot |
|---|---|
| CZT HV Monitor | 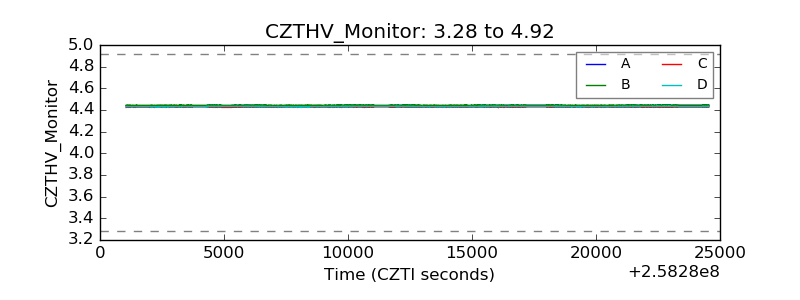 |
| D_VDD | 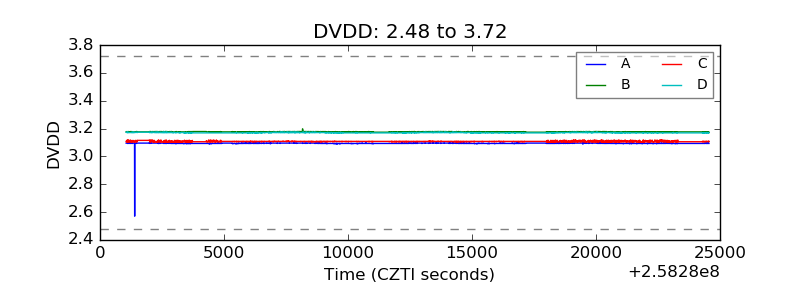 |
| Temperature 1 |  |
| Veto HV Monitor | 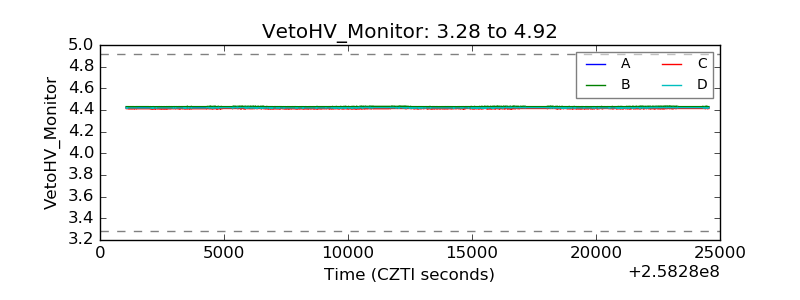 |
| Veto LLD | 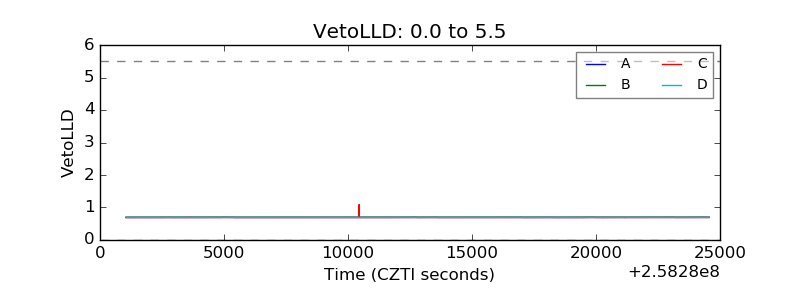 |
| Alpha Counter | 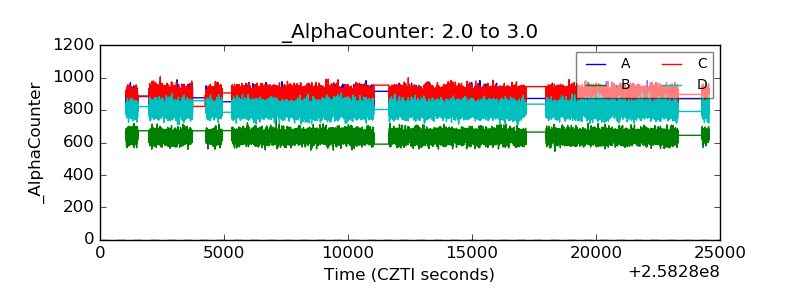 |
| _CPM_Rate | 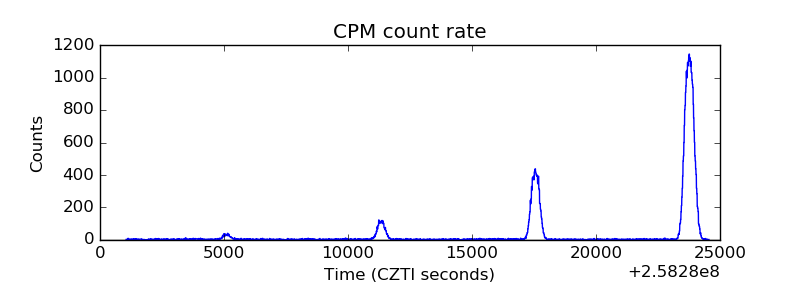 |
| CZT Counter | 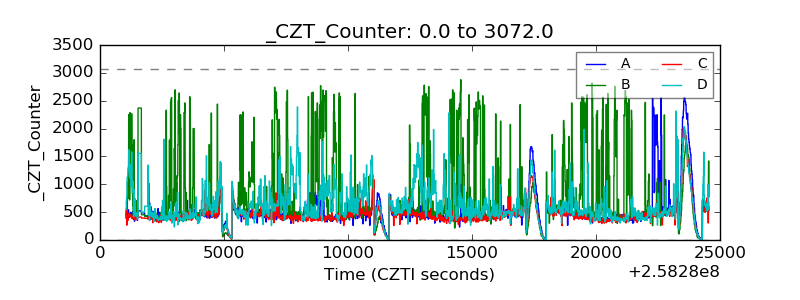 |
| +2.5 Volts monitor |  |
| +5 Volts monitor |  |
| _ROLL_ROT | 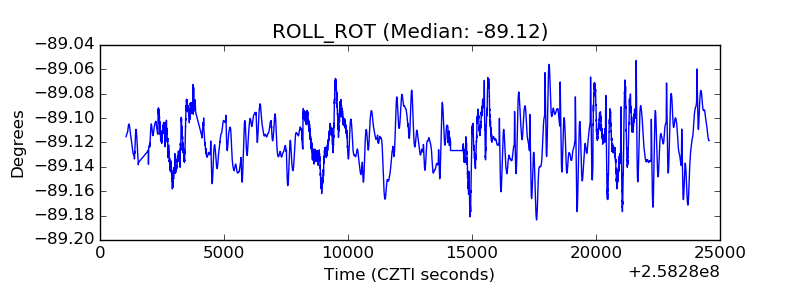 |
| _Roll_DEC | 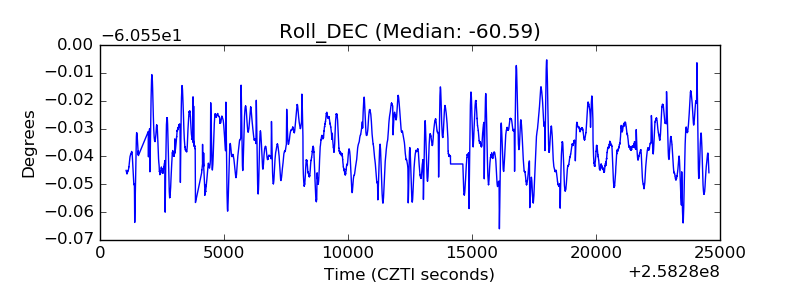 |
| _Roll_RA | 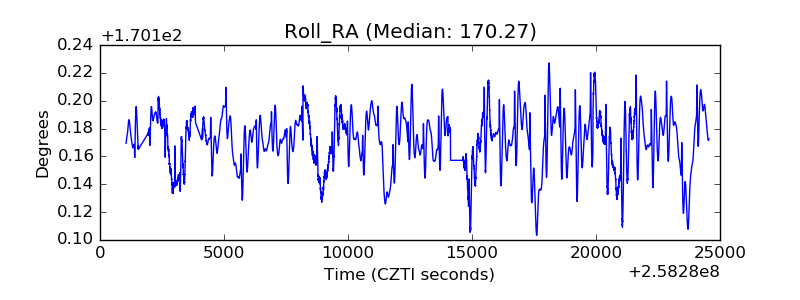 |
| Veto Counter | 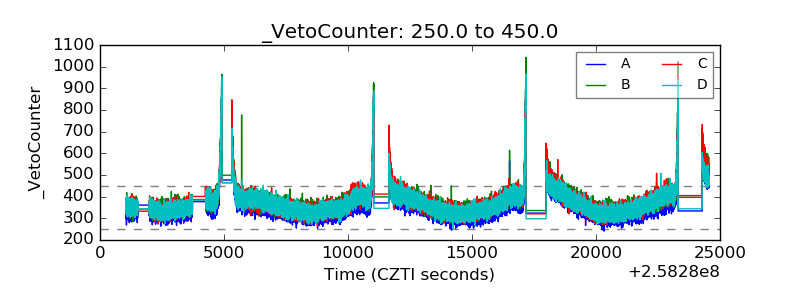 |