| Param | Original file | Final file |
|---|---|---|
| Filename | modeM0/AS1A04_216T01_9000001968_13226cztM0_level2.evt | modeM0/AS1A04_216T01_9000001968_13226cztM0_level2_quad_clean.evt |
| Size (bytes) | 2,290,443,840 | 423,135,360 |
| Size | 2.1 GB | 403.5 MB |
| Events in quadrant A | 13,552,061 | 2,824,550 |
| Events in quadrant B | 23,700,484 | 2,536,799 |
| Events in quadrant C | 12,656,999 | 2,835,325 |
| Events in quadrant D | 17,554,687 | 2,680,283 |
| Mode M0 | |||
|---|---|---|---|
| Quadrant | BADHDUFLAG | Total packets | Discarded packets |
| A | 0 | 59818 | 6 |
| B | 0 | 89186 | 5 |
| C | 0 | 57902 | 5 |
| D | 0 | 71392 | 5 |
| Mode M9 | |||
|---|---|---|---|
| Quadrant | BADHDUFLAG | Total packets | Discarded packets |
| A | 0 | 38 | 0 |
| B | 0 | 38 | 0 |
| C | 0 | 38 | 0 |
| D | 0 | 38 | 0 |
| Mode SS | |||
|---|---|---|---|
| Quadrant | BADHDUFLAG | Total packets | Discarded packets |
| A | 0 | 574 | 0 |
| B | 0 | 574 | 0 |
| C | 0 | 574 | 0 |
| D | 0 | 574 | 0 |
| Quadrant | Total seconds | Saturated seconds | Saturation percentage |
|---|---|---|---|
| A | 28185 | 532 | 1.887529% |
| B | 28185 | 4823 | 17.111939% |
| C | 28185 | 319 | 1.131808% |
| D | 28185 | 539 | 1.912365% |
Noise dominated data is calculated using 1-second bins in cleaned event files. If a bin has >2000 counts, and if more than 50% of those come from <1% of pixels, then it is considered to be noise-dominated and hence unusable.
| Quadrant | # 1 sec bins | Bins with >0 counts | Bins with >2000 counts | High rate bins dominated by noise | Noise dominated (total time) | Noise dominated (detector-on time) | Marked lightcurve |
|---|---|---|---|---|---|---|---|
| A | 32081 | 28190 | 113 | 113 | 0.35% | 0.40% | 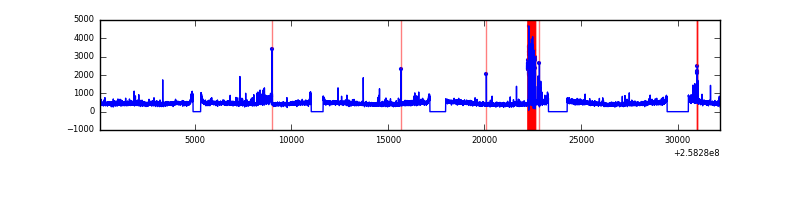 |
| B | 32080 | 28190 | 2982 | 2982 | 9.30% | 10.58% | 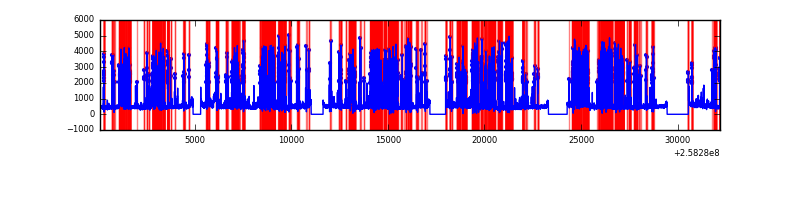 |
| C | 32081 | 28191 | 13 | 13 | 0.04% | 0.05% | 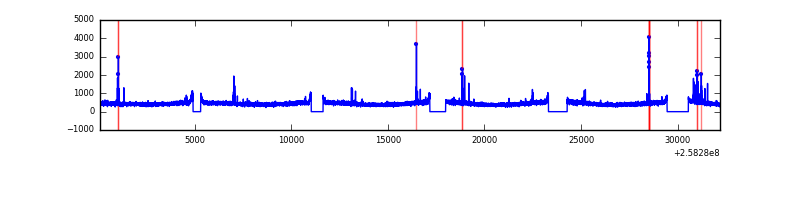 |
| D | 32081 | 28191 | 150 | 150 | 0.47% | 0.53% | 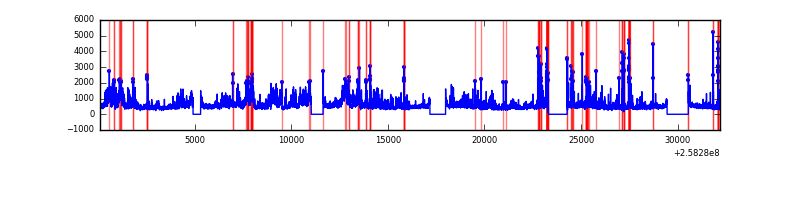 |
Top three noisy pixels from each quadrant. If the there are fewer than three noisy pixels in the level2.evt file, extra rows are filled as -1
| Pixel properties | Quadrant properties | ||||||
|---|---|---|---|---|---|---|---|
| Quadrant | DetID | PixID | Counts | Sigma | Mean | Median | Sigma |
| A | 15 | 69 | 487032 | 728.42 | 3271 | 3202 | 664.2 |
| A | 10 | 229 | 231846 | 344.23 | 3271 | 3202 | 664.2 |
| A | 1 | 162 | 63058 | 90.12 | 3271 | 3202 | 664.2 |
| B | 4 | 239 | 11327497 | 19929.26 | 3002 | 2923 | 568.2 |
| B | 5 | 32 | 287170 | 500.22 | 3002 | 2923 | 568.2 |
| B | 3 | 209 | 97864 | 167.08 | 3002 | 2923 | 568.2 |
| C | 15 | 208 | 187714 | 252.15 | 3189 | 3197 | 731.8 |
| C | 13 | 61 | 23128 | 27.24 | 3189 | 3197 | 731.8 |
| C | 8 | 128 | 19697 | 22.55 | 3189 | 3197 | 731.8 |
| D | 8 | 195 | 4320974 | 5723.26 | 3146 | 3053 | 754.5 |
| D | 1 | 52 | 1039758 | 1374.12 | 3146 | 3053 | 754.5 |
| D | 2 | 234 | 109029 | 140.47 | 3146 | 3053 | 754.5 |
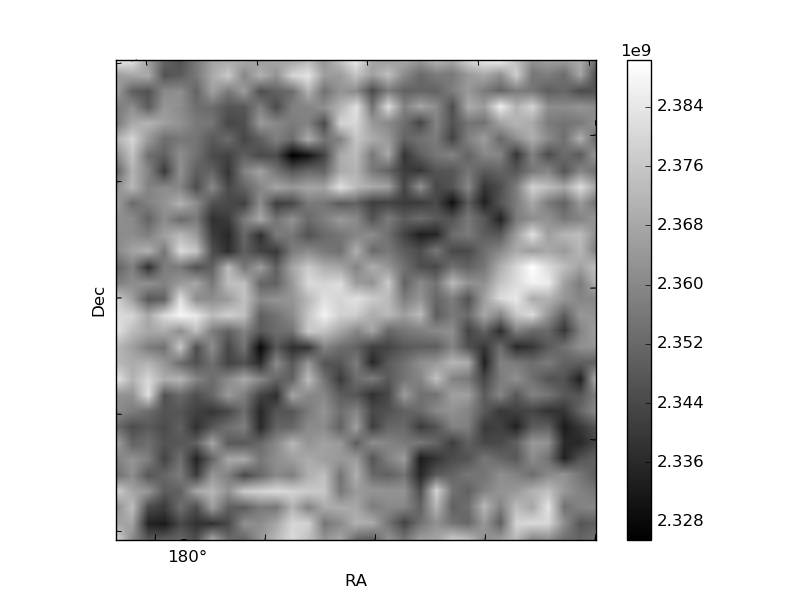
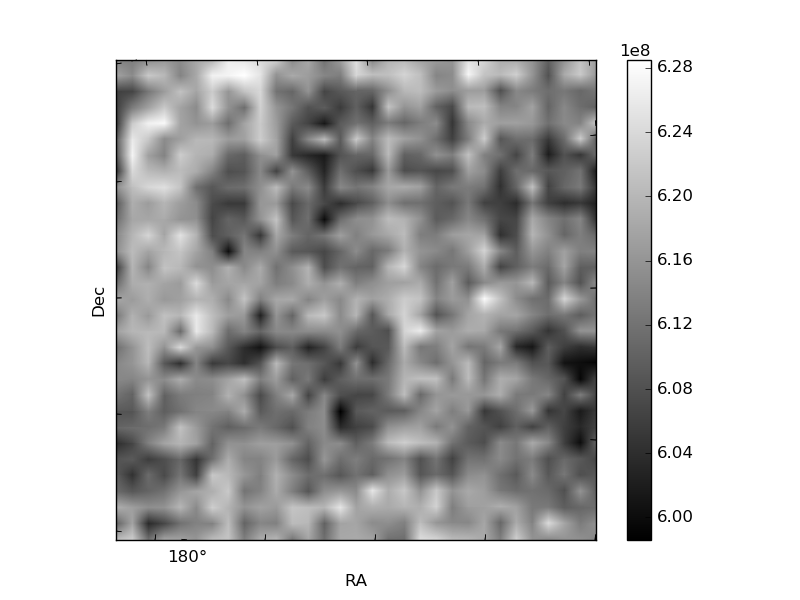
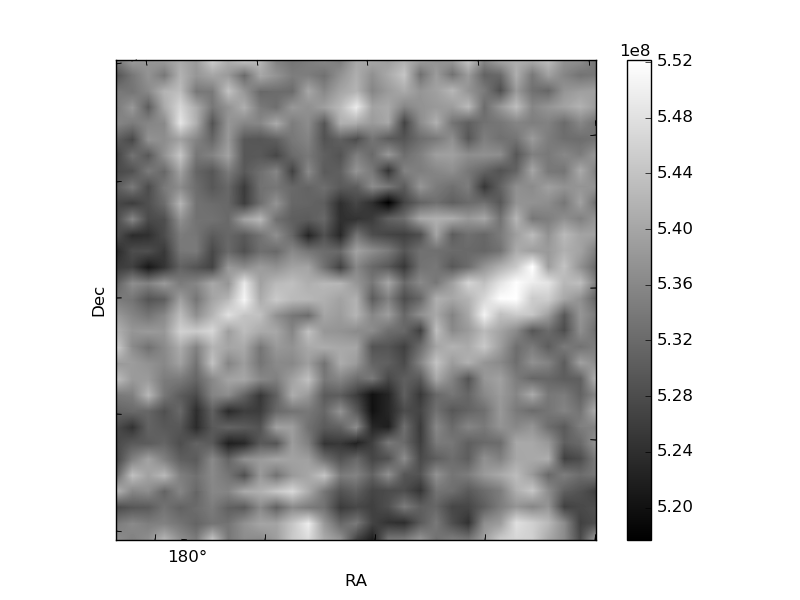
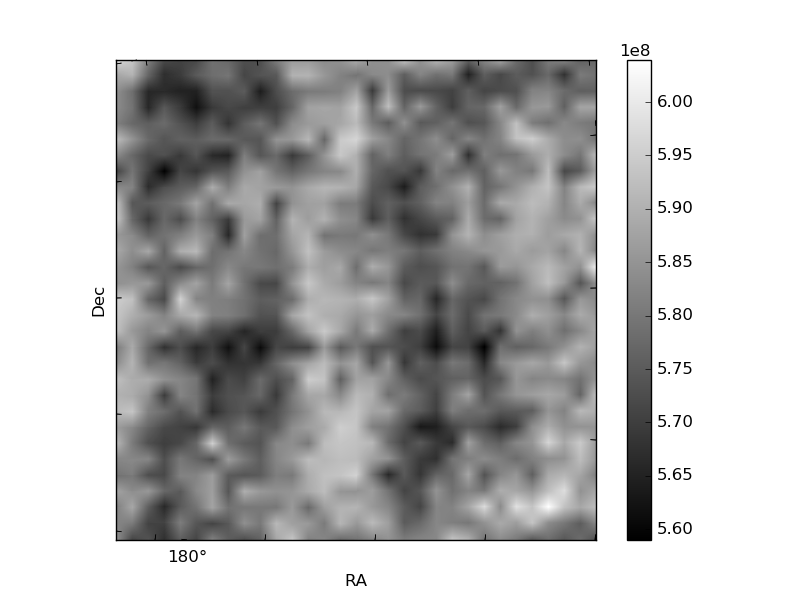
Histogram calculated using DETX and DETY for each event in the final _common_clean file
| Quadrant A | 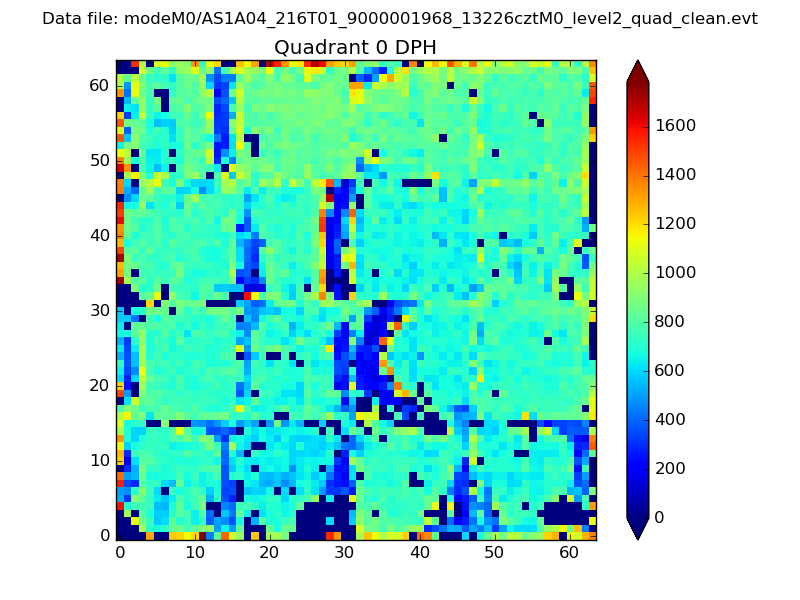 |
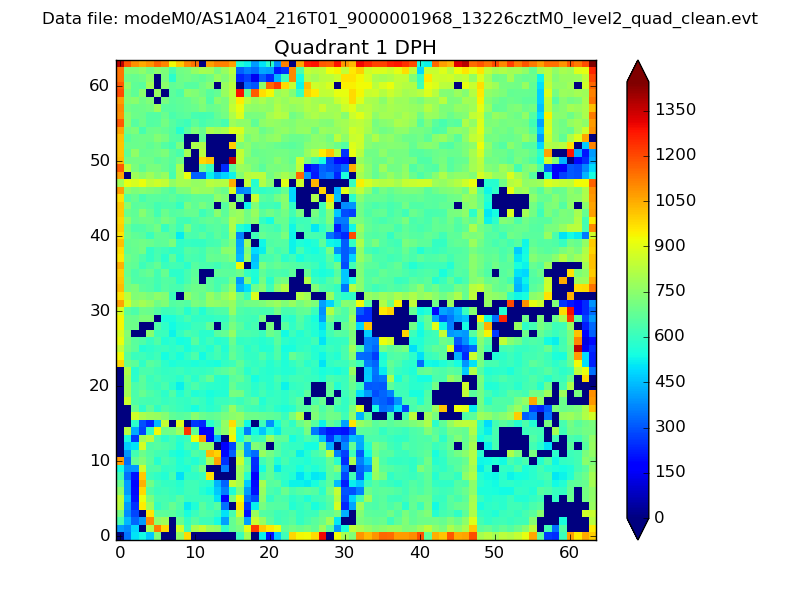 |
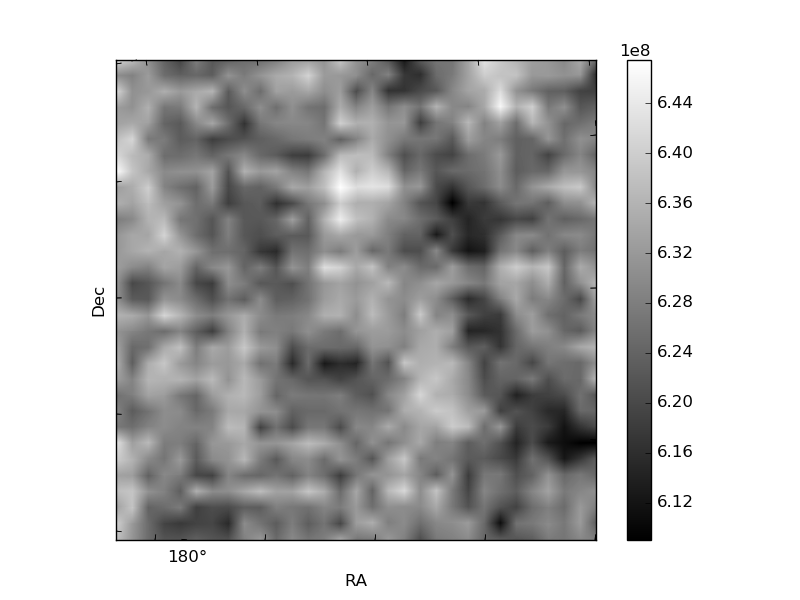
Quadrant B |
|---|---|---|---|
| Quadrant D | 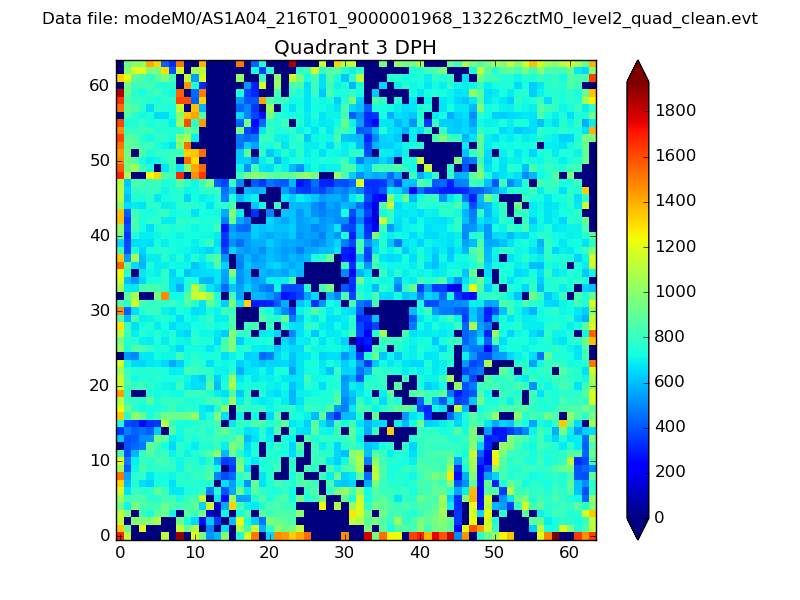 |
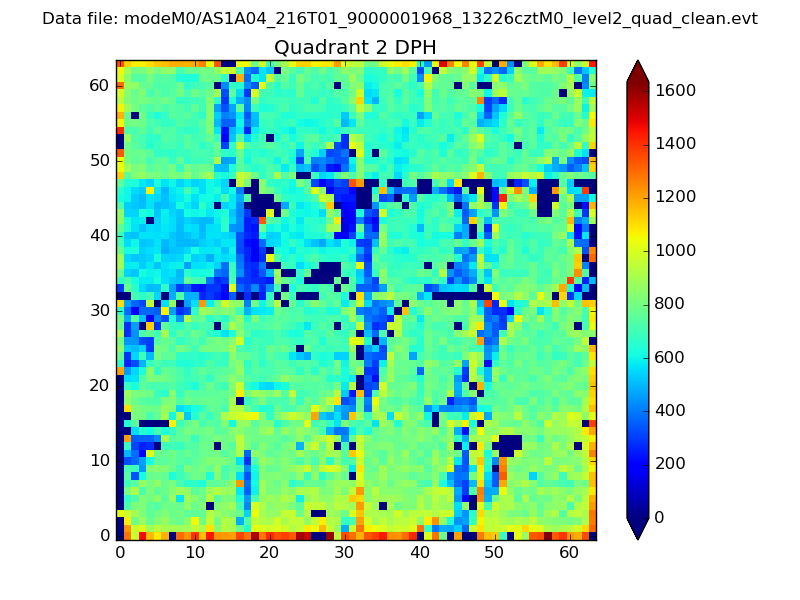 |
Quadrant C |
| Plot type | Count rate plots | Images |
|---|---|---|
| Comparison with Poisson distribution Blue bars denote a histogram of data divided into 1 sec bins. Red curve is a Poisson curve with rate = median count rate of data. |
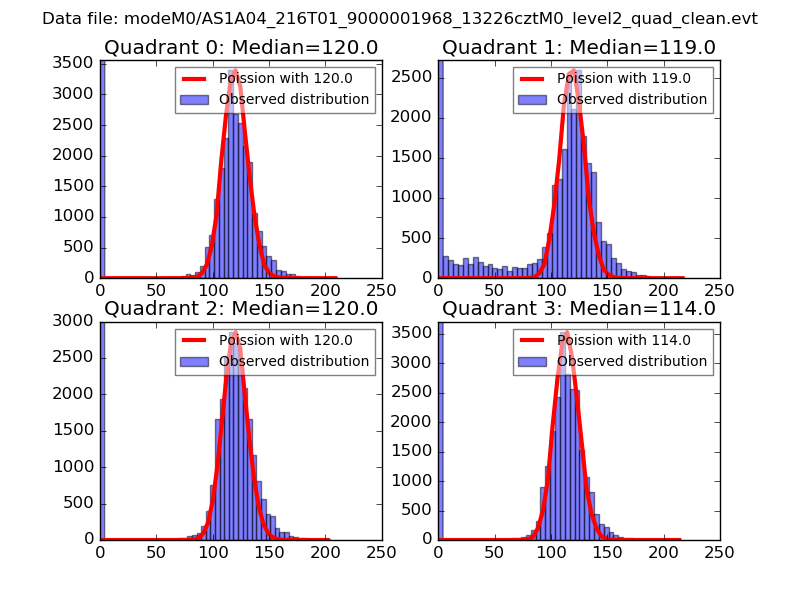 |
 |
| Quadrant-wise count rates Data is divided into 100 sec bins |
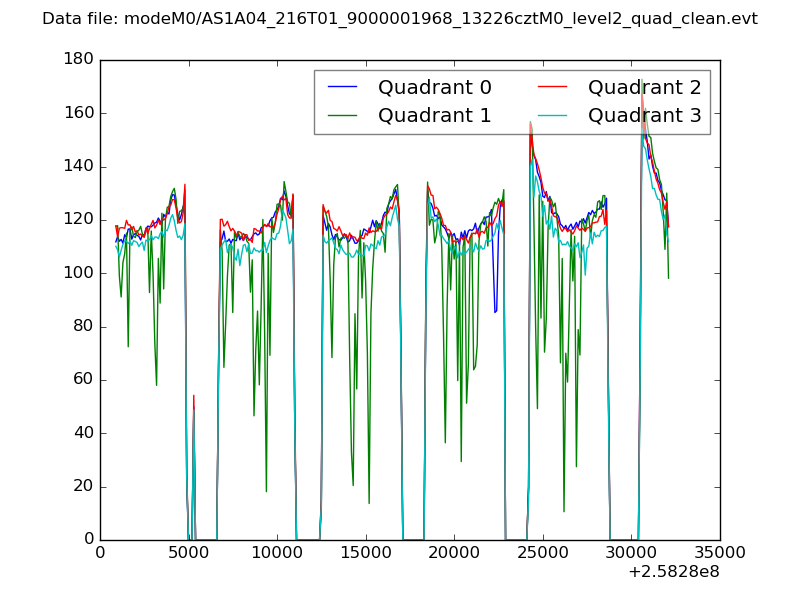 |
|
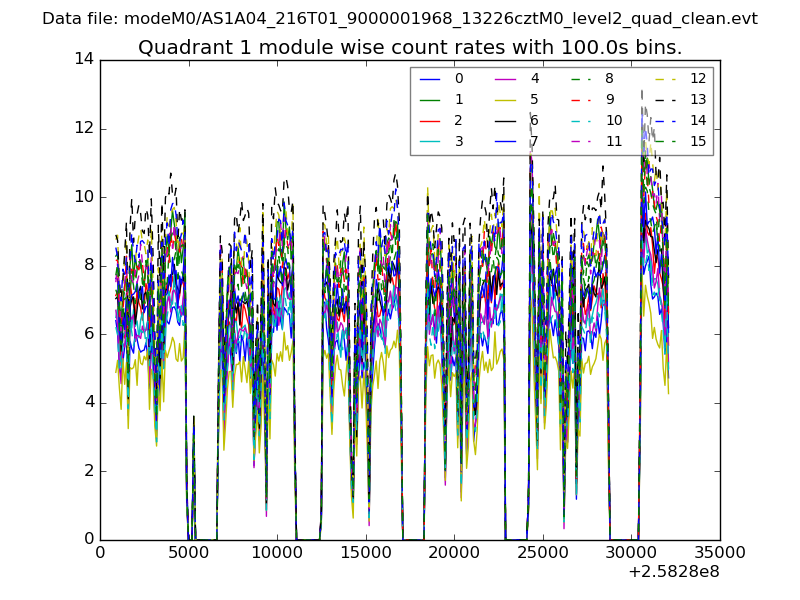
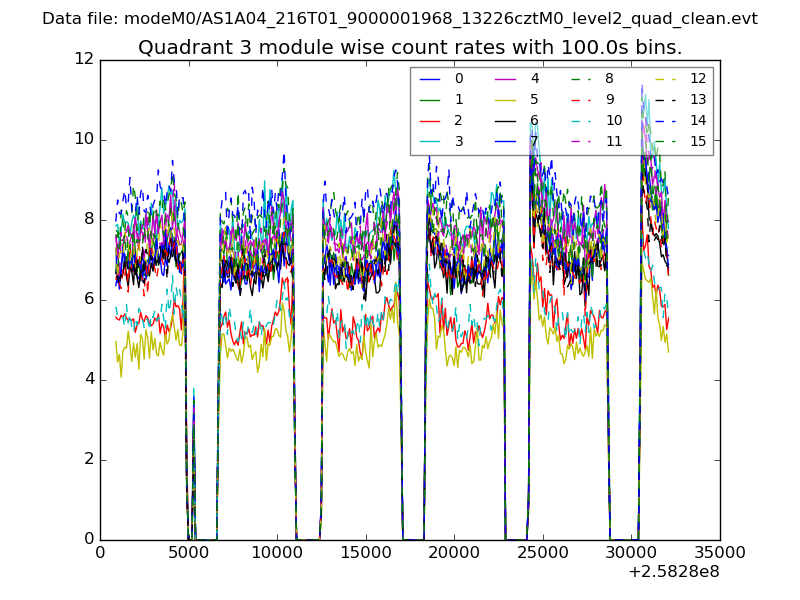
| Module-wise count rates for Quadrant A Data is divided into 100 sec bins |
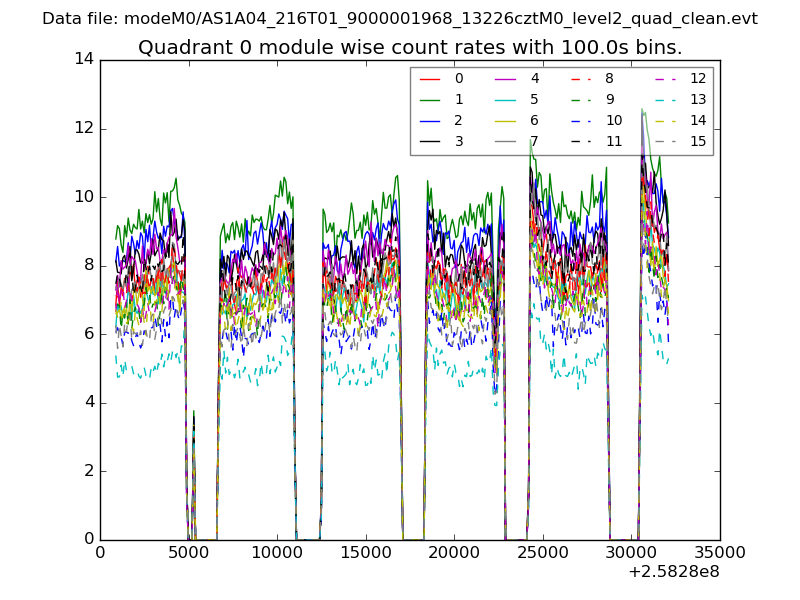 |
 |
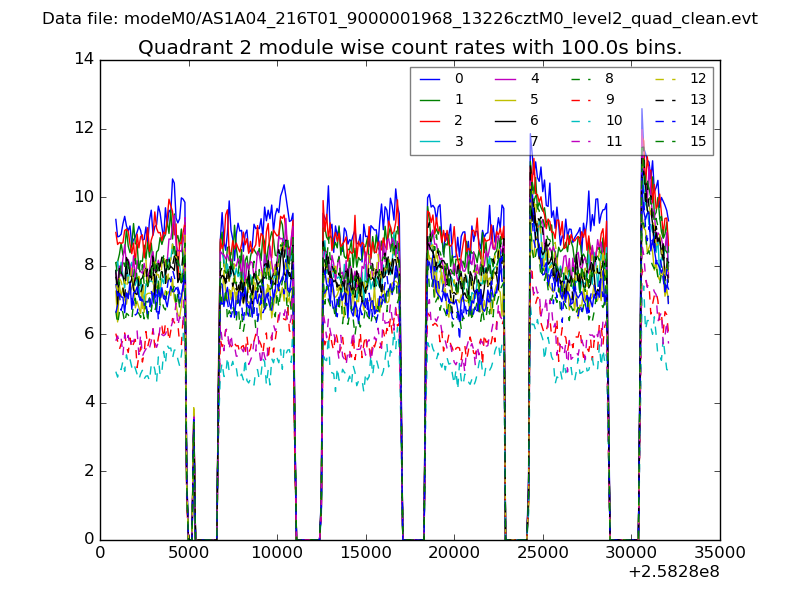
| Module-wise count rates for Quadrant B Data is divided into 100 sec bins |
 |
 |
| Module-wise count rates for Quadrant C Data is divided into 100 sec bins |
 |
 |
| Module-wise count rates for Quadrant D Data is divided into 100 sec bins |
 |
 |
| Parameter | Plot |
|---|---|
| CZT HV Monitor | 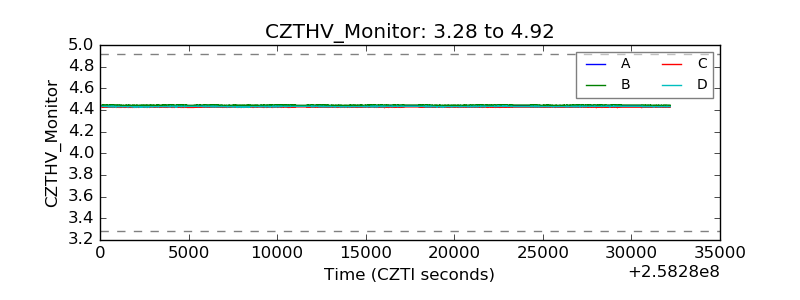 |
| D_VDD | 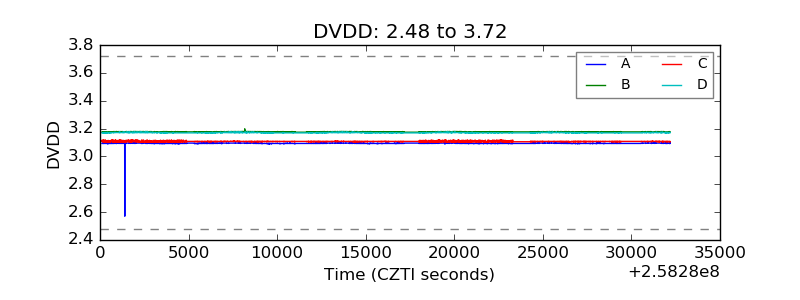 |
| Temperature 1 | 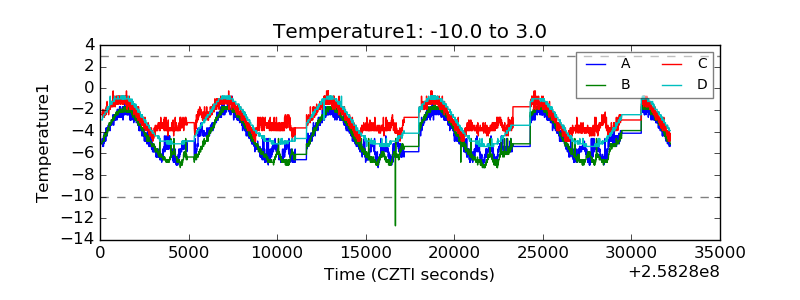 |
| Veto HV Monitor | 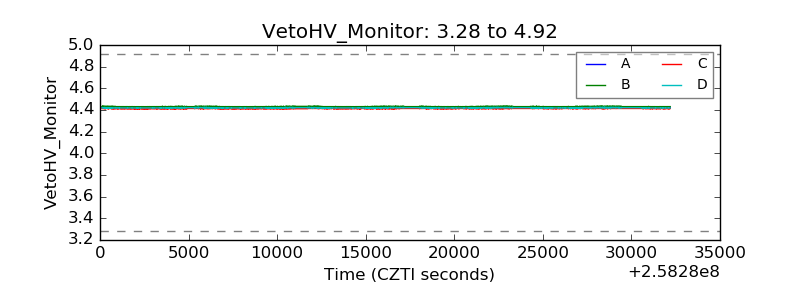 |
| Veto LLD | 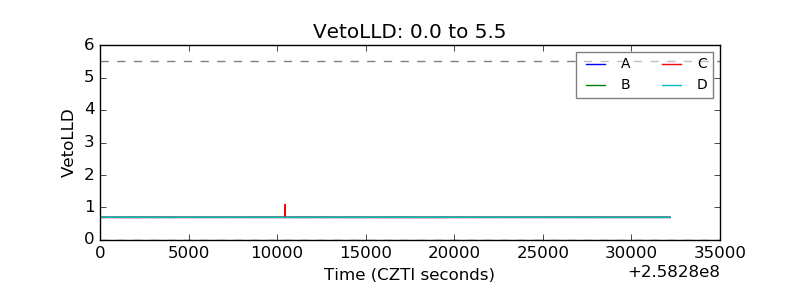 |
| Alpha Counter | 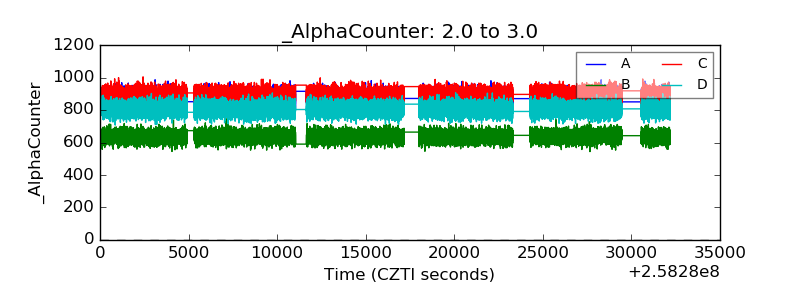 |
| _CPM_Rate | 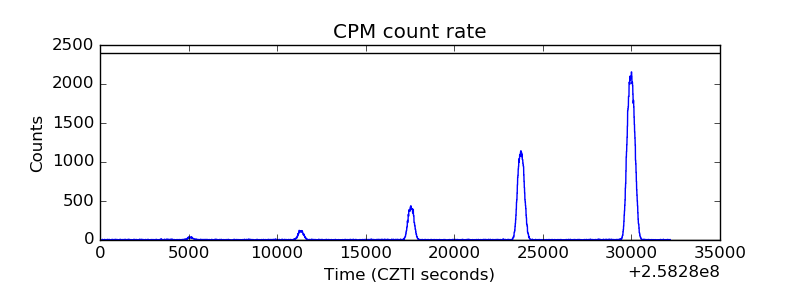 |
| CZT Counter | 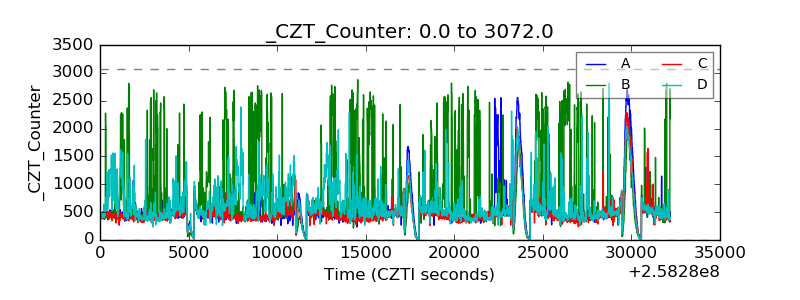 |
| +2.5 Volts monitor |  |
| +5 Volts monitor |  |
| _ROLL_ROT | 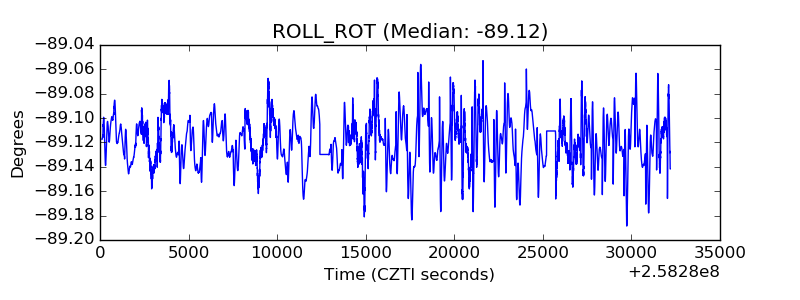 |
| _Roll_DEC | 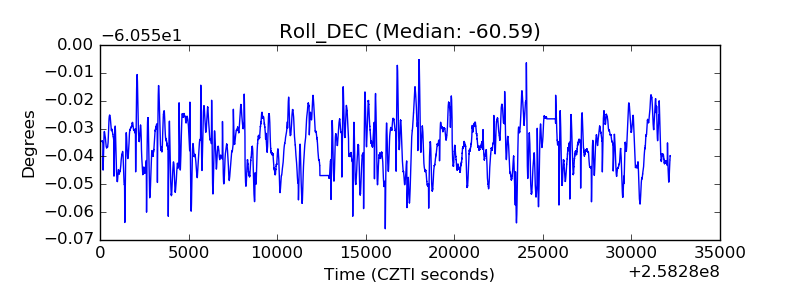 |
| _Roll_RA | 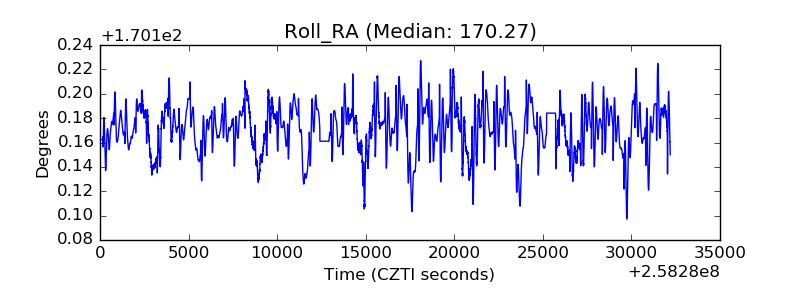 |
| Veto Counter | 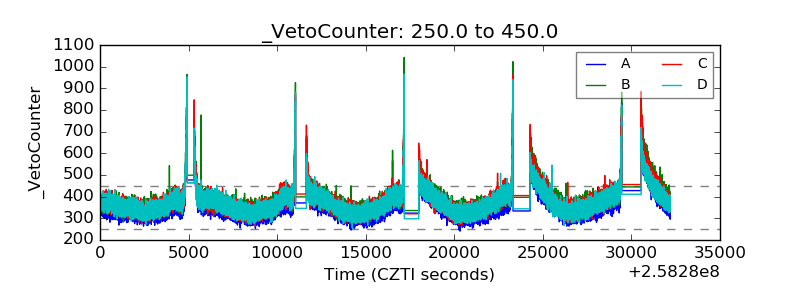 |