| Param | Original file | Final file |
|---|---|---|
| Filename | modeM0/AS1A04_216T01_9000001968_13227cztM0_level2.evt | modeM0/AS1A04_216T01_9000001968_13227cztM0_level2_quad_clean.evt |
| Size (bytes) | 487,212,480 | 103,083,840 |
| Size | 464.6 MB | 98.3 MB |
| Events in quadrant A | 3,001,828 | 702,723 |
| Events in quadrant B | 5,160,266 | 643,885 |
| Events in quadrant C | 2,901,878 | 692,868 |
| Events in quadrant D | 3,271,492 | 650,651 |
| Mode M0 | |||
|---|---|---|---|
| Quadrant | BADHDUFLAG | Total packets | Discarded packets |
| A | 0 | 13152 | 2 |
| B | 0 | 19414 | 1 |
| C | 0 | 12880 | 1 |
| D | 0 | 13976 | 1 |
| Mode M9 | |||
|---|---|---|---|
| Quadrant | BADHDUFLAG | Total packets | Discarded packets |
| A | 0 | 13 | 0 |
| B | 0 | 13 | 0 |
| C | 0 | 13 | 0 |
| D | 0 | 13 | 0 |
| Mode SS | |||
|---|---|---|---|
| Quadrant | BADHDUFLAG | Total packets | Discarded packets |
| A | 0 | 124 | 0 |
| B | 0 | 124 | 0 |
| C | 0 | 124 | 0 |
| D | 0 | 124 | 0 |
| Quadrant | Total seconds | Saturated seconds | Saturation percentage |
|---|---|---|---|
| A | 6185 | 45 | 0.727567% |
| B | 6185 | 903 | 14.599838% |
| C | 6185 | 17 | 0.274859% |
| D | 6185 | 97 | 1.568310% |
Noise dominated data is calculated using 1-second bins in cleaned event files. If a bin has >2000 counts, and if more than 50% of those come from <1% of pixels, then it is considered to be noise-dominated and hence unusable.
| Quadrant | # 1 sec bins | Bins with >0 counts | Bins with >2000 counts | High rate bins dominated by noise | Noise dominated (total time) | Noise dominated (detector-on time) | Marked lightcurve |
|---|---|---|---|---|---|---|---|
| A | 7401 | 6187 | 4 | 4 | 0.05% | 0.06% | 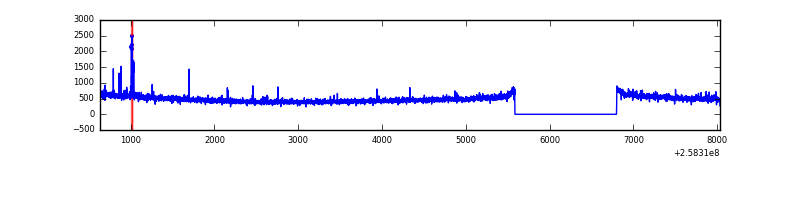 |
| B | 7401 | 6187 | 652 | 652 | 8.81% | 10.54% | 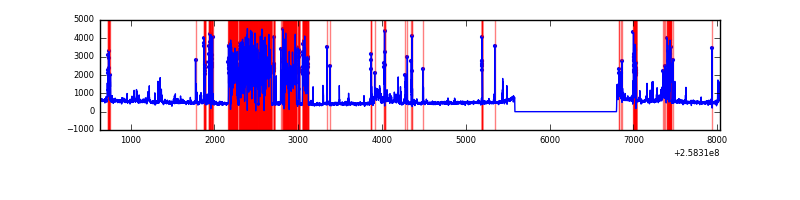 |
| C | 7401 | 6187 | 3 | 3 | 0.04% | 0.05% | 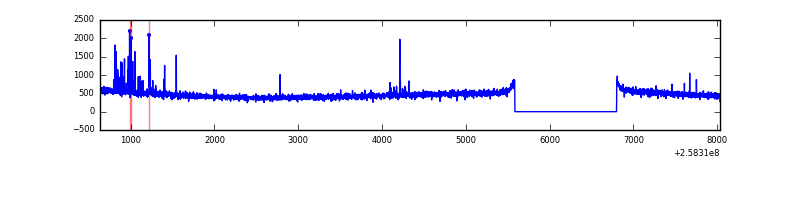 |
| D | 7401 | 6187 | 62 | 62 | 0.84% | 1.00% | 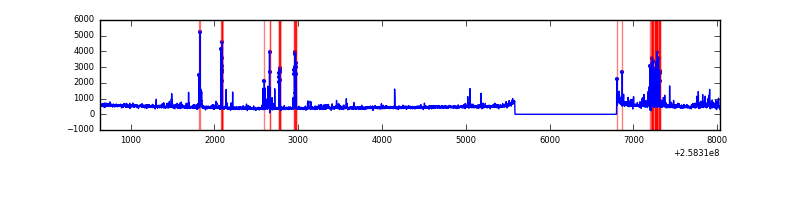 |
Top three noisy pixels from each quadrant. If the there are fewer than three noisy pixels in the level2.evt file, extra rows are filled as -1
| Pixel properties | Quadrant properties | ||||||
|---|---|---|---|---|---|---|---|
| Quadrant | DetID | PixID | Counts | Sigma | Mean | Median | Sigma |
| A | 15 | 239 | 41520 | 268.68 | 754 | 740 | 151.8 |
| A | 4 | 2 | 29054 | 186.55 | 754 | 740 | 151.8 |
| A | 12 | 96 | 11034 | 67.82 | 754 | 740 | 151.8 |
| B | 4 | 239 | 2094560 | 15843.03 | 703 | 687 | 132.2 |
| B | 3 | 64 | 207457 | 1564.5 | 703 | 687 | 132.2 |
| B | 0 | 219 | 36141 | 268.26 | 703 | 687 | 132.2 |
| C | 15 | 208 | 63414 | 373.25 | 727 | 731 | 167.9 |
| C | 13 | 61 | 5372 | 27.64 | 727 | 731 | 167.9 |
| C | 8 | 222 | 3409 | 15.95 | 727 | 731 | 167.9 |
| D | 1 | 52 | 481414 | 2807.43 | 713 | 692 | 171.2 |
| D | 8 | 195 | 65259 | 377.07 | 713 | 692 | 171.2 |
| D | 2 | 234 | 24642 | 139.87 | 713 | 692 | 171.2 |
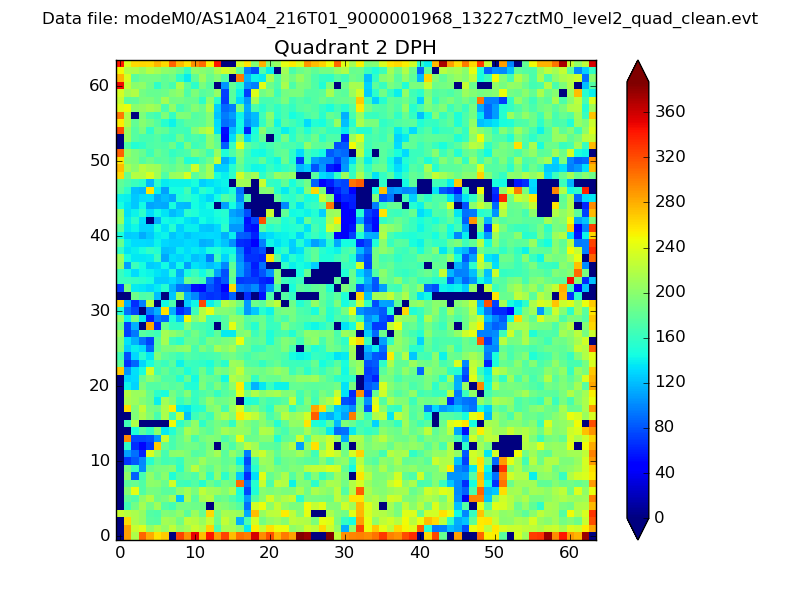
Histogram calculated using DETX and DETY for each event in the final _common_clean file
| Quadrant A | 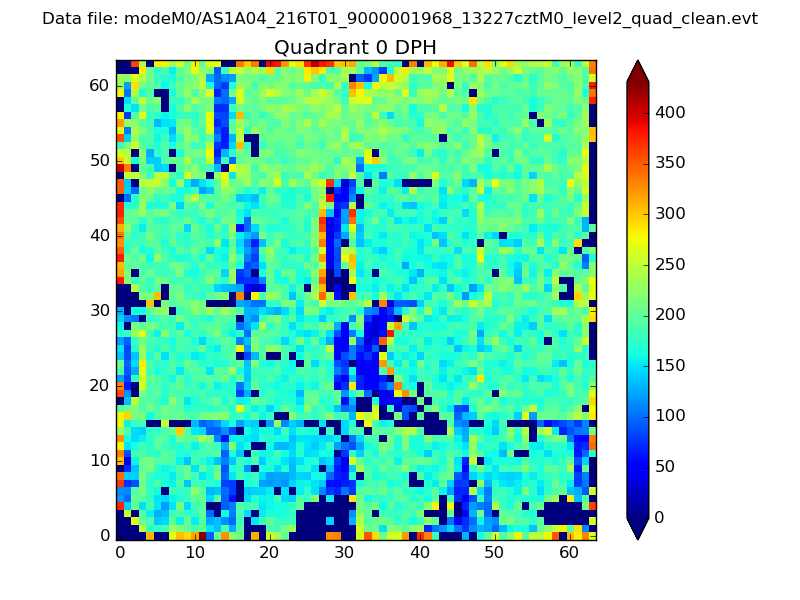 |
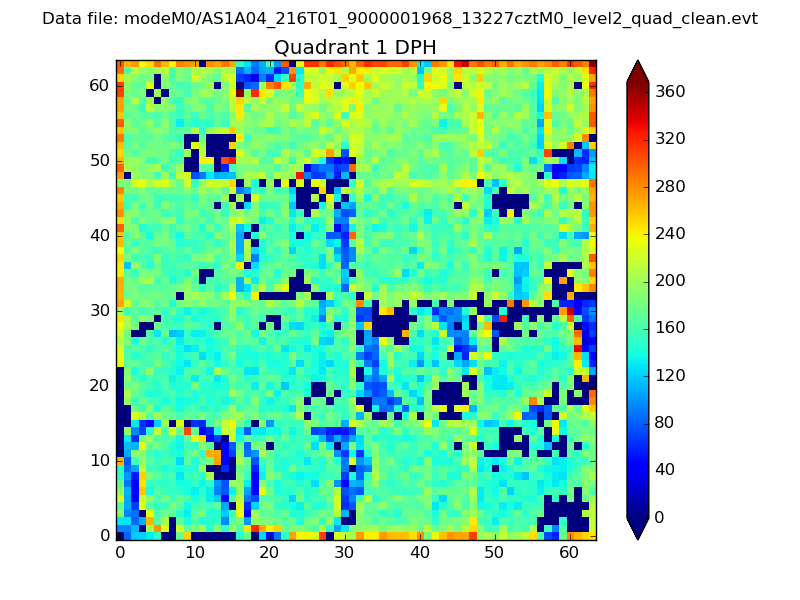 |
Quadrant B |
|---|---|---|---|
| Quadrant D | 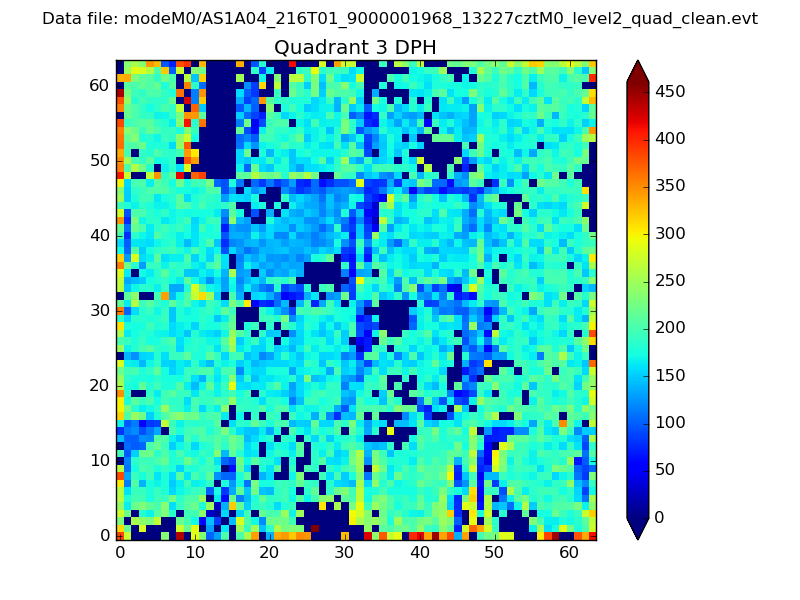 |
 |
Quadrant C |
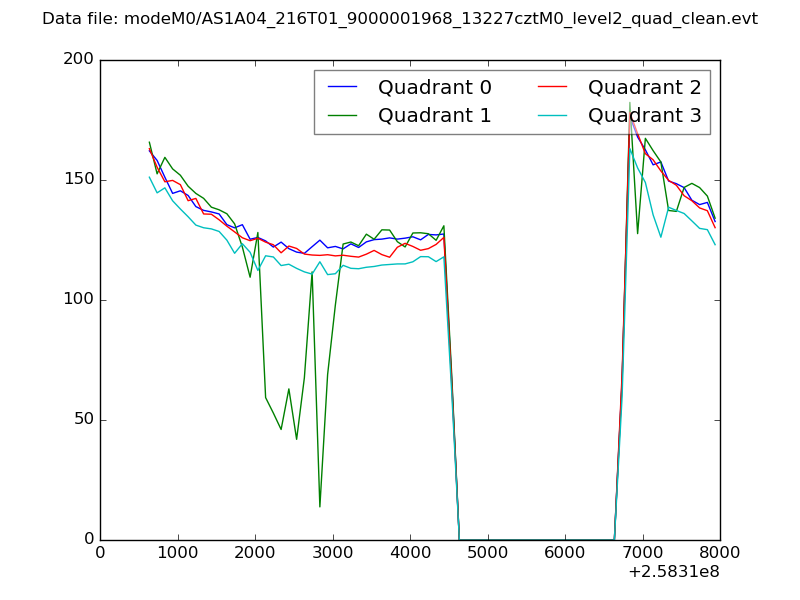
| Plot type | Count rate plots | Images |
|---|---|---|
| Comparison with Poisson distribution Blue bars denote a histogram of data divided into 1 sec bins. Red curve is a Poisson curve with rate = median count rate of data. |
 |
 |
| Quadrant-wise count rates Data is divided into 100 sec bins |
 |
|
| Module-wise count rates for Quadrant A Data is divided into 100 sec bins |
 |
 |
| Module-wise count rates for Quadrant B Data is divided into 100 sec bins |
 |
 |
| Module-wise count rates for Quadrant C Data is divided into 100 sec bins |
 |
 |
| Module-wise count rates for Quadrant D Data is divided into 100 sec bins |
 |
 |
| Parameter | Plot |
|---|---|
| CZT HV Monitor | 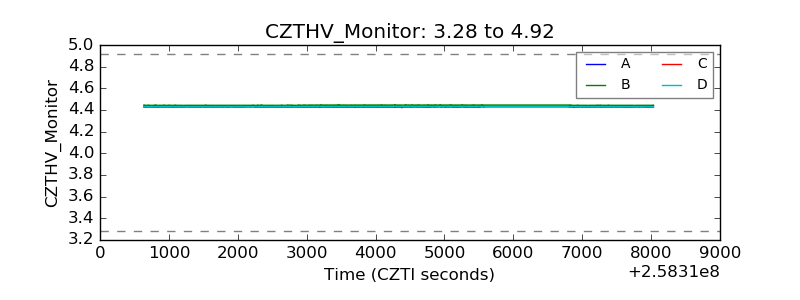 |
| D_VDD | 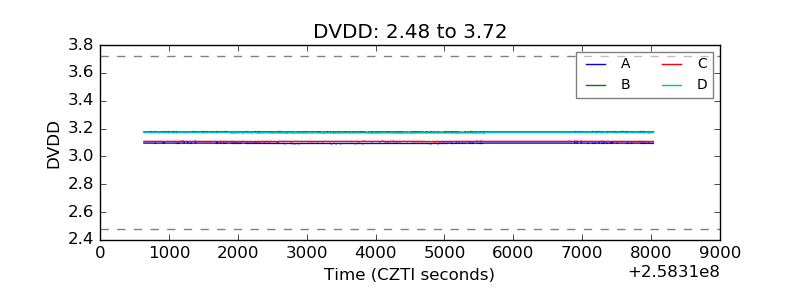 |
| Temperature 1 |  |
| Veto HV Monitor | 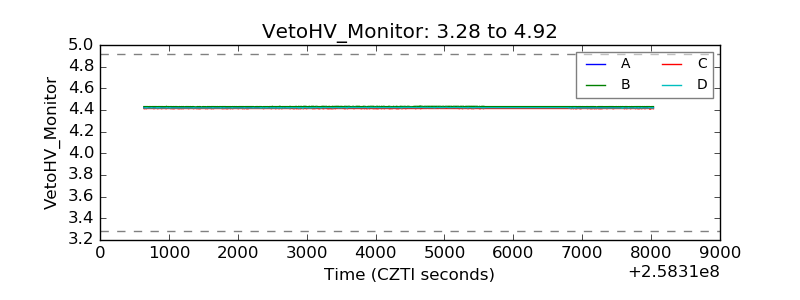 |
| Veto LLD | 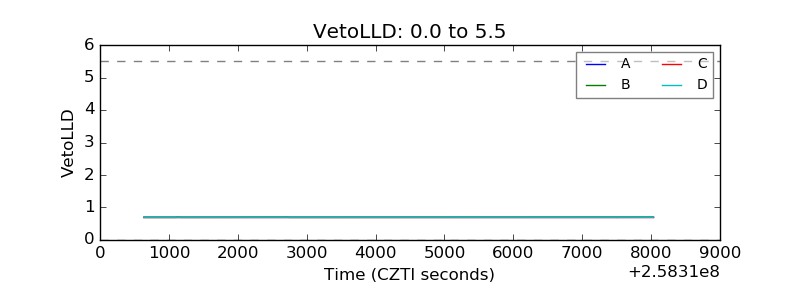 |
| Alpha Counter | 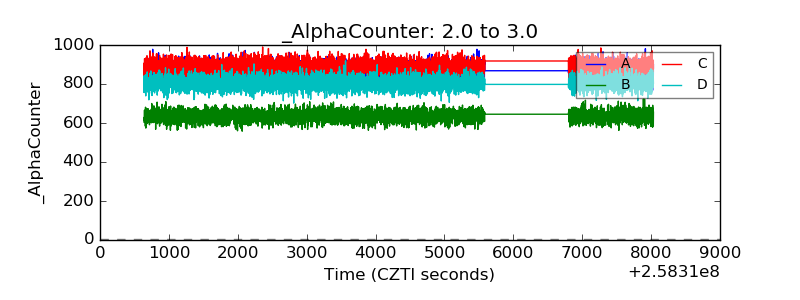 |
| _CPM_Rate | 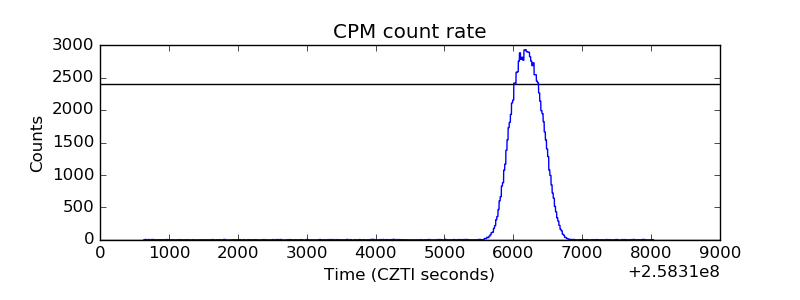 |
| CZT Counter | 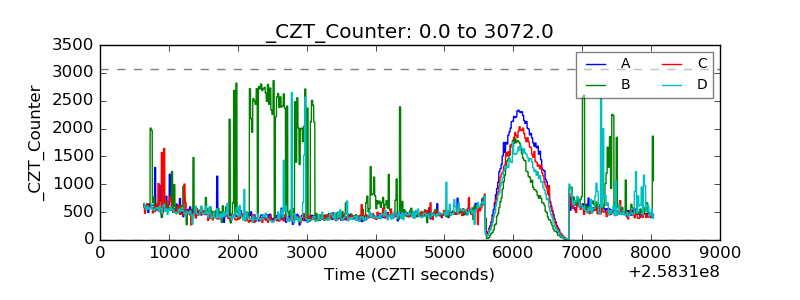 |
| +2.5 Volts monitor |  |
| +5 Volts monitor |  |
| _ROLL_ROT |  |
| _Roll_DEC |  |
| _Roll_RA | 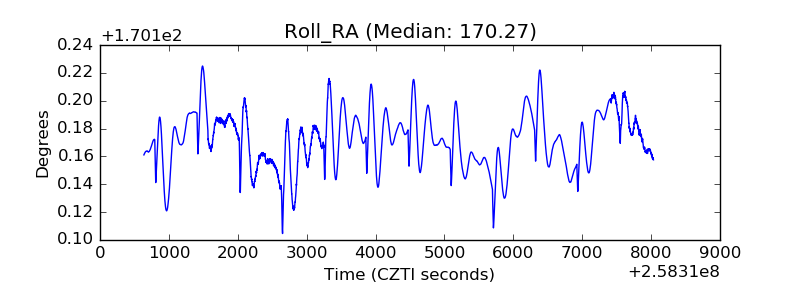 |
| Veto Counter | 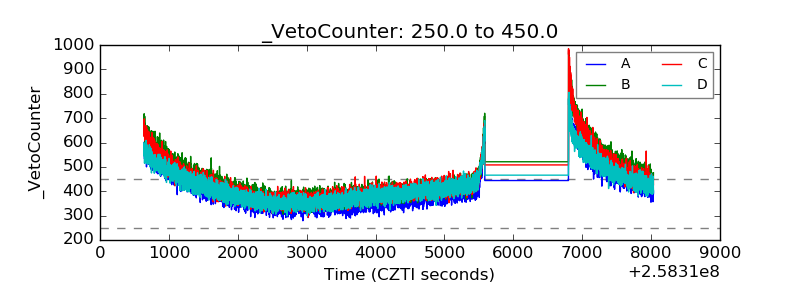 |