| Param | Original file | Final file |
|---|---|---|
| Filename | modeM0/AS1A04_216T01_9000001968_13228cztM0_level2.evt | modeM0/AS1A04_216T01_9000001968_13228cztM0_level2_quad_clean.evt |
| Size (bytes) | 528,019,200 | 101,344,320 |
| Size | 503.6 MB | 96.6 MB |
| Events in quadrant A | 3,024,140 | 692,332 |
| Events in quadrant B | 4,715,747 | 648,438 |
| Events in quadrant C | 2,918,681 | 685,096 |
| Events in quadrant D | 4,911,871 | 610,170 |
| Mode M0 | |||
|---|---|---|---|
| Quadrant | BADHDUFLAG | Total packets | Discarded packets |
| A | 0 | 13086 | 3 |
| B | 0 | 18081 | 2 |
| C | 0 | 12812 | 2 |
| D | 0 | 18777 | 2 |
| Mode M9 | |||
|---|---|---|---|
| Quadrant | BADHDUFLAG | Total packets | Discarded packets |
| A | 0 | 14 | 0 |
| B | 0 | 14 | 0 |
| C | 0 | 14 | 0 |
| D | 0 | 15 | 0 |
| Mode SS | |||
|---|---|---|---|
| Quadrant | BADHDUFLAG | Total packets | Discarded packets |
| A | 0 | 126 | 0 |
| B | 0 | 126 | 0 |
| C | 0 | 126 | 0 |
| D | 0 | 126 | 0 |
| Quadrant | Total seconds | Saturated seconds | Saturation percentage |
|---|---|---|---|
| A | 6199 | 19 | 0.306501% |
| B | 6199 | 719 | 11.598645% |
| C | 6199 | 9 | 0.145185% |
| D | 6199 | 487 | 7.856106% |
Noise dominated data is calculated using 1-second bins in cleaned event files. If a bin has >2000 counts, and if more than 50% of those come from <1% of pixels, then it is considered to be noise-dominated and hence unusable.
| Quadrant | # 1 sec bins | Bins with >0 counts | Bins with >2000 counts | High rate bins dominated by noise | Noise dominated (total time) | Noise dominated (detector-on time) | Marked lightcurve |
|---|---|---|---|---|---|---|---|
| A | 7525 | 6201 | 1 | 1 | 0.01% | 0.02% | 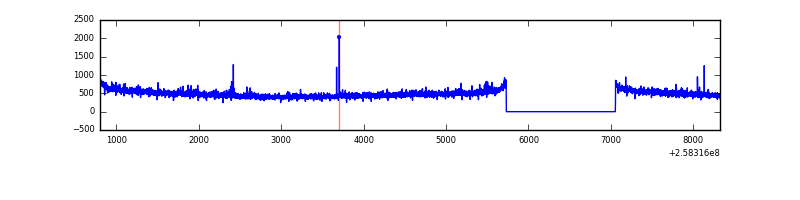 |
| B | 7525 | 6201 | 454 | 454 | 6.03% | 7.32% | 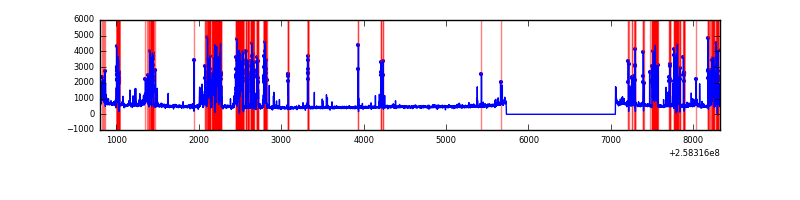 |
| C | 7525 | 6201 | 2 | 2 | 0.03% | 0.03% | 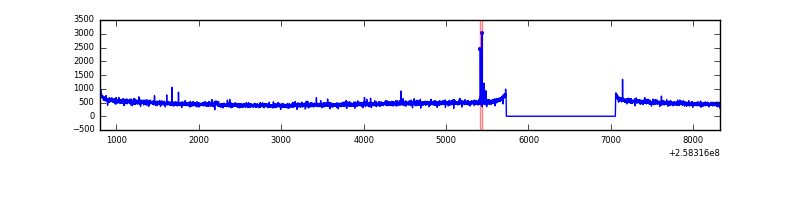 |
| D | 7525 | 6201 | 396 | 396 | 5.26% | 6.39% | 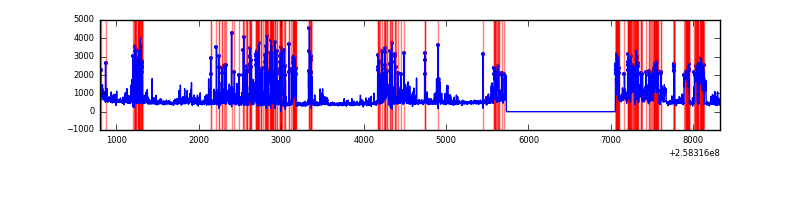 |
Top three noisy pixels from each quadrant. If the there are fewer than three noisy pixels in the level2.evt file, extra rows are filled as -1
| Pixel properties | Quadrant properties | ||||||
|---|---|---|---|---|---|---|---|
| Quadrant | DetID | PixID | Counts | Sigma | Mean | Median | Sigma |
| A | 15 | 239 | 27047 | 169.92 | 766 | 753 | 154.7 |
| A | 12 | 189 | 22105 | 137.98 | 766 | 753 | 154.7 |
| A | 8 | 15 | 16092 | 99.12 | 766 | 753 | 154.7 |
| B | 4 | 239 | 1607951 | 11823.37 | 727 | 709 | 135.9 |
| B | 3 | 64 | 147834 | 1082.3 | 727 | 709 | 135.9 |
| B | 0 | 219 | 38188 | 275.71 | 727 | 709 | 135.9 |
| C | 14 | 234 | 20382 | 115.32 | 741 | 747 | 170.3 |
| C | 7 | 236 | 5748 | 29.37 | 741 | 747 | 170.3 |
| C | 13 | 61 | 5366 | 27.13 | 741 | 747 | 170.3 |
| D | 1 | 52 | 2031943 | 12100.02 | 704 | 684 | 167.9 |
| D | 8 | 195 | 140853 | 834.97 | 704 | 684 | 167.9 |
| D | 5 | 222 | 51666 | 303.69 | 704 | 684 | 167.9 |
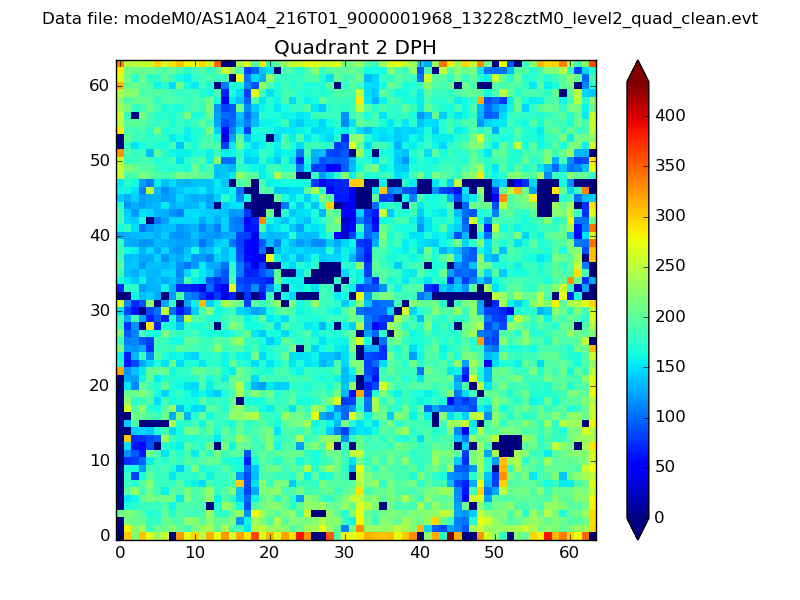
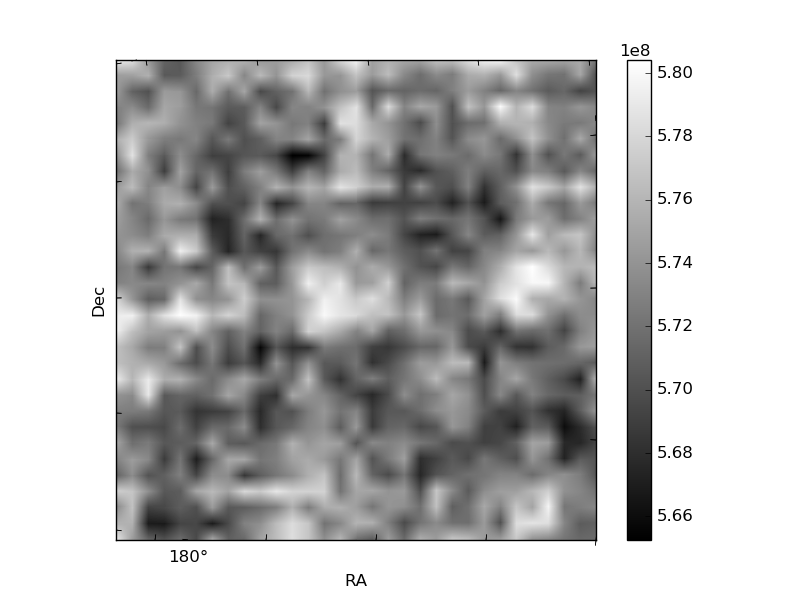
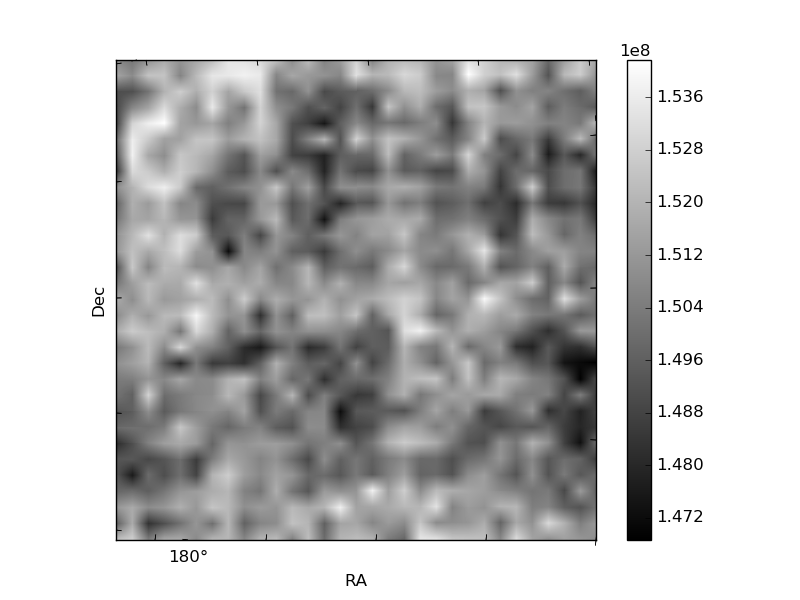
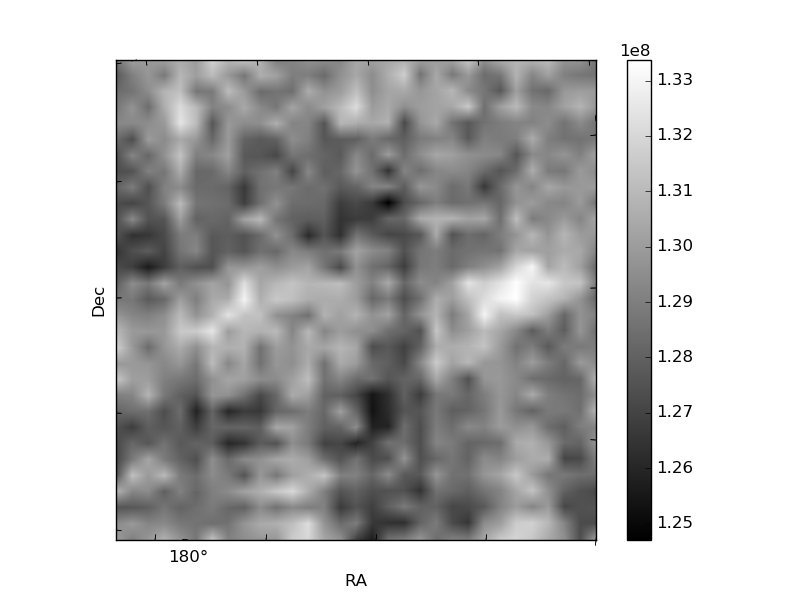
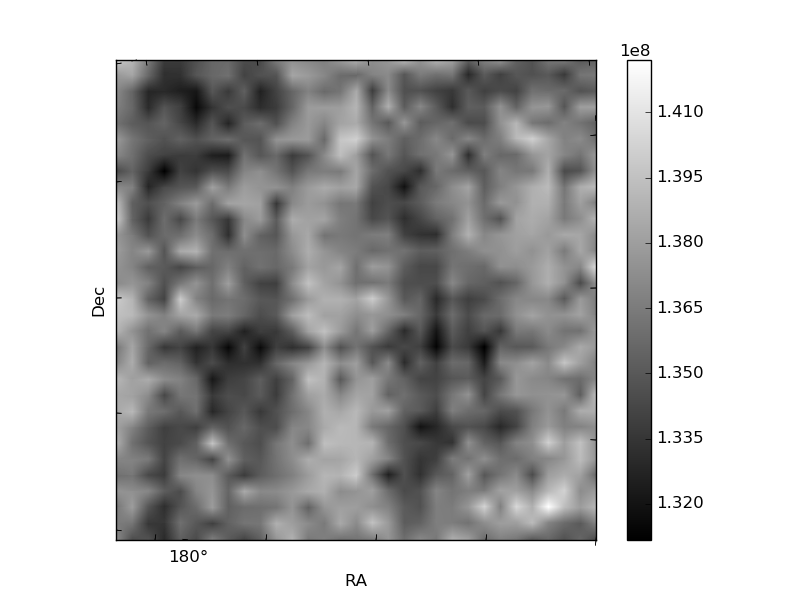
Histogram calculated using DETX and DETY for each event in the final _common_clean file
| Quadrant A | 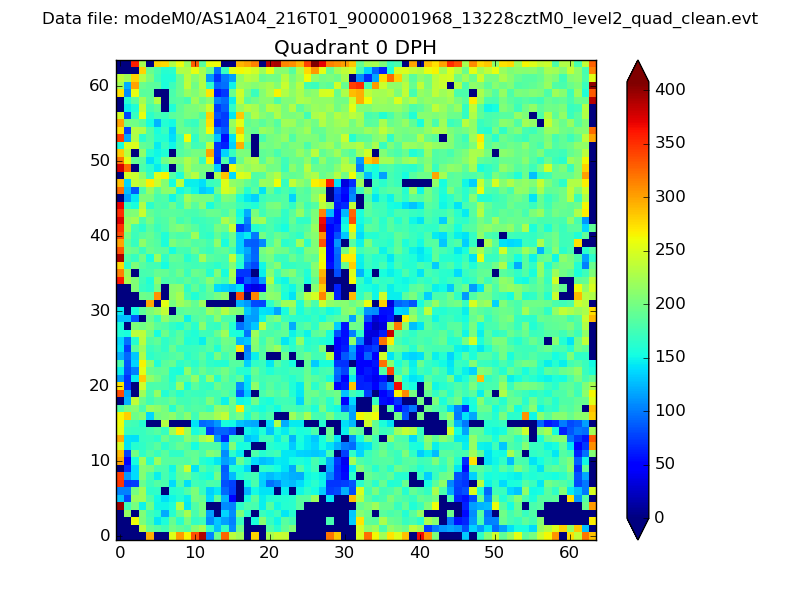 |
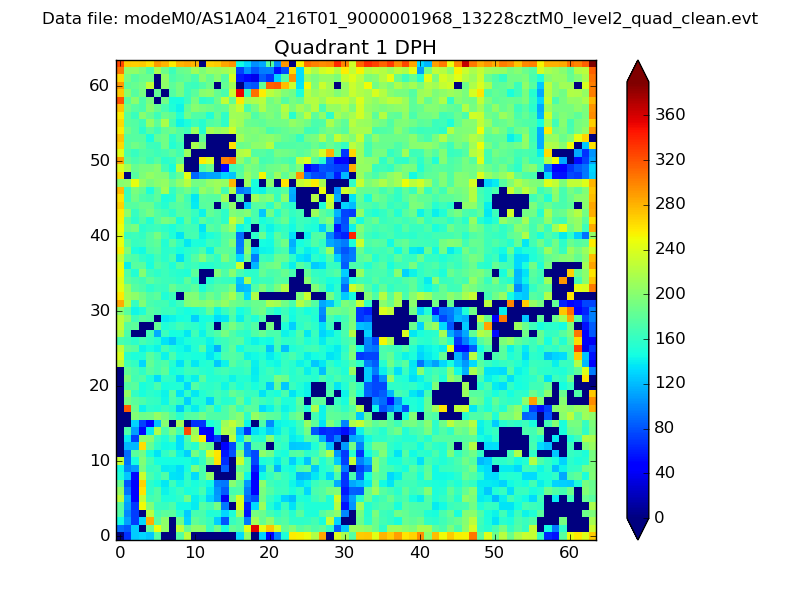 |
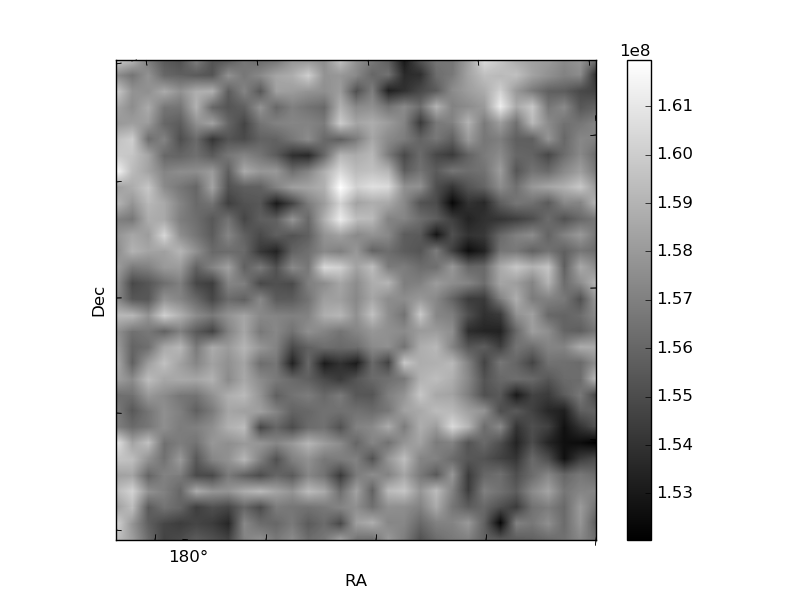
Quadrant B |
|---|---|---|---|
| Quadrant D | 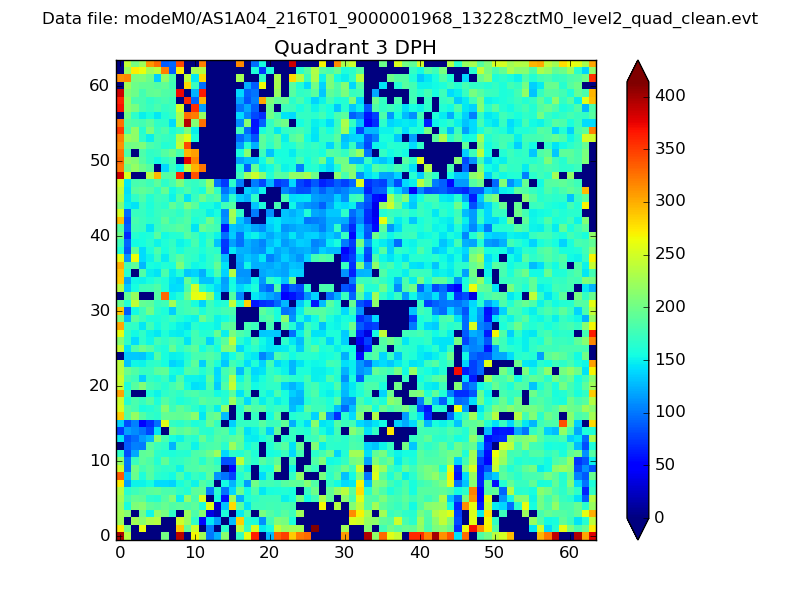 |
 |
Quadrant C |
| Plot type | Count rate plots | Images |
|---|---|---|
| Comparison with Poisson distribution Blue bars denote a histogram of data divided into 1 sec bins. Red curve is a Poisson curve with rate = median count rate of data. |
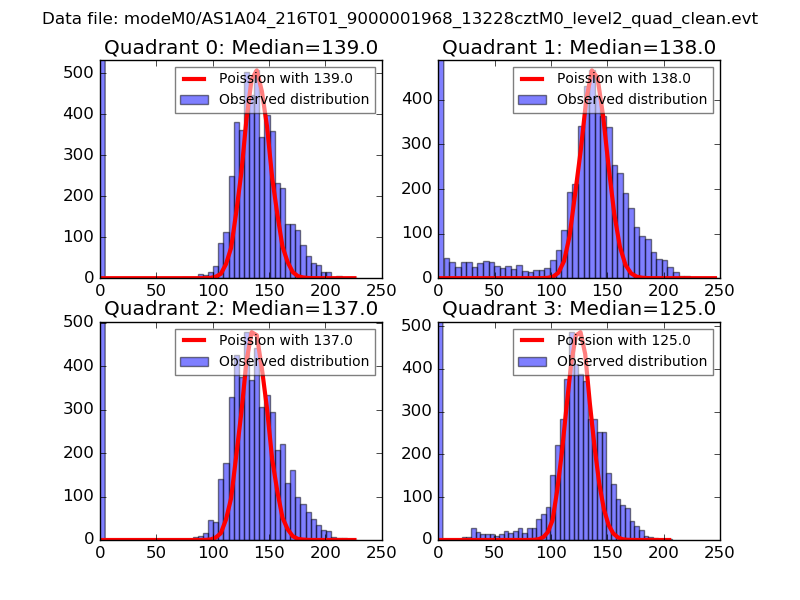 |
 |
| Quadrant-wise count rates Data is divided into 100 sec bins |
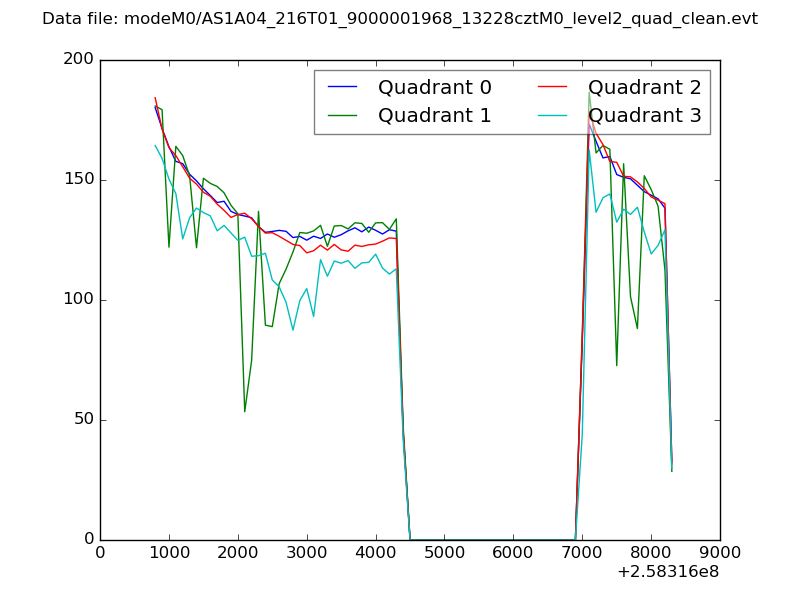 |
|
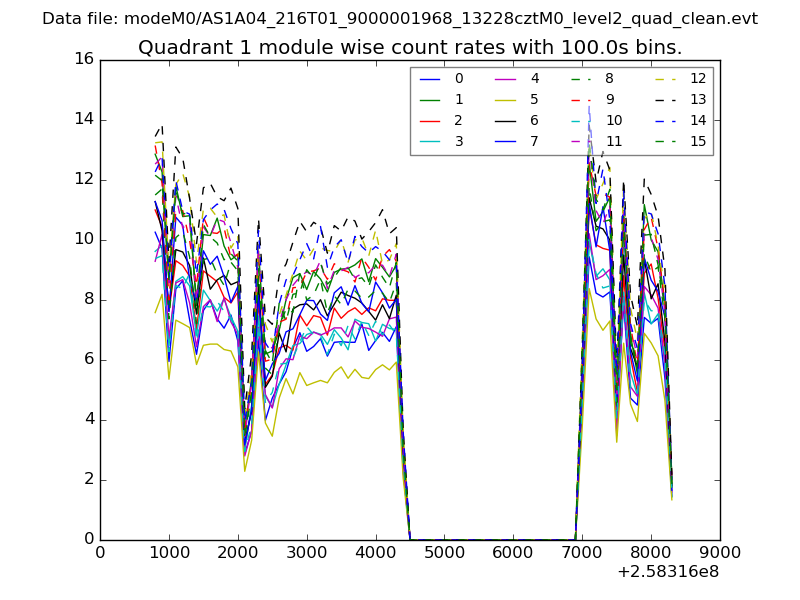
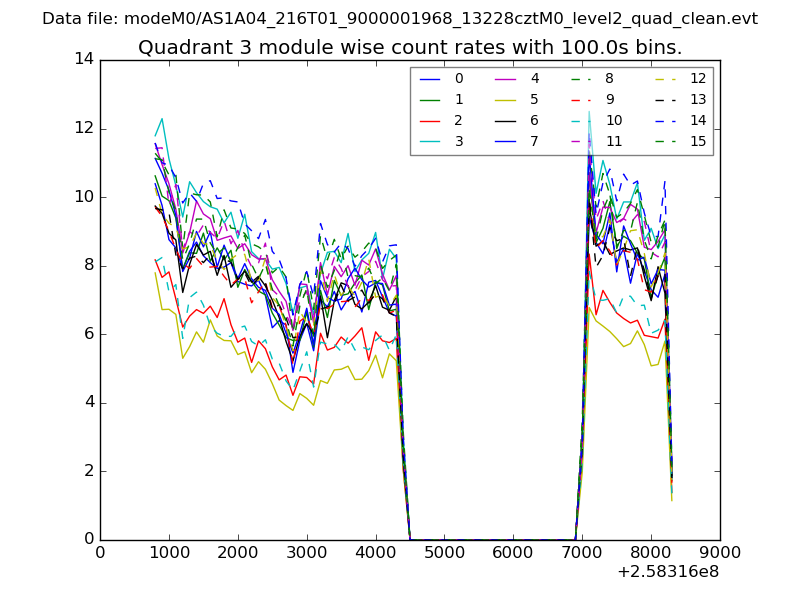
| Module-wise count rates for Quadrant A Data is divided into 100 sec bins |
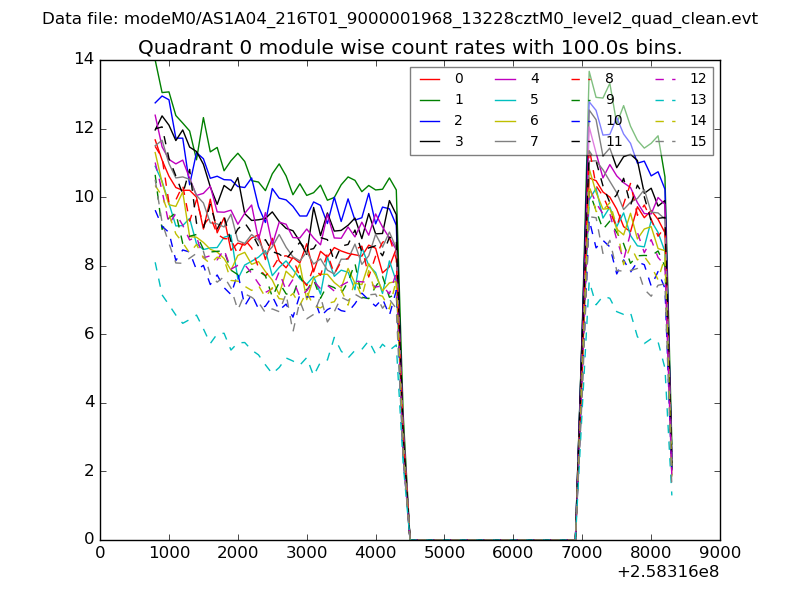 |
 |
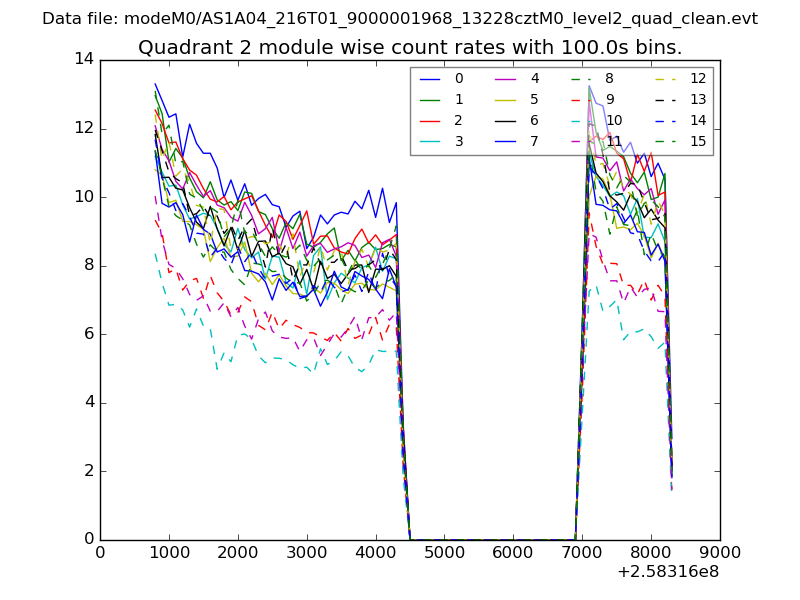
| Module-wise count rates for Quadrant B Data is divided into 100 sec bins |
 |
 |
| Module-wise count rates for Quadrant C Data is divided into 100 sec bins |
 |
 |
| Module-wise count rates for Quadrant D Data is divided into 100 sec bins |
 |
 |
| Parameter | Plot |
|---|---|
| CZT HV Monitor | 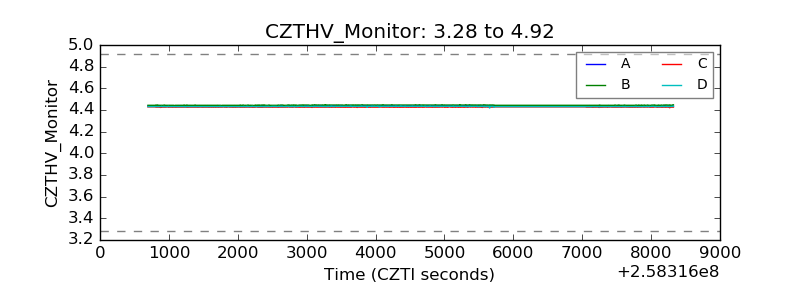 |
| D_VDD | 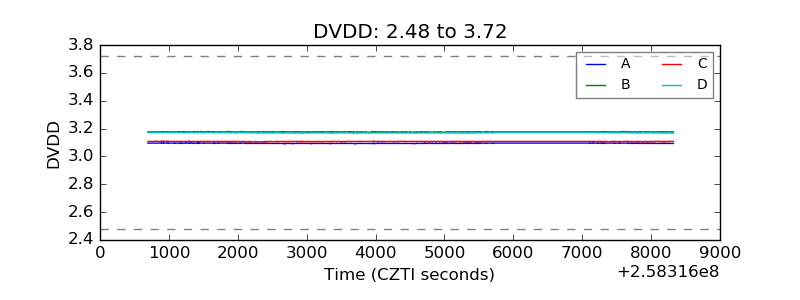 |
| Temperature 1 | 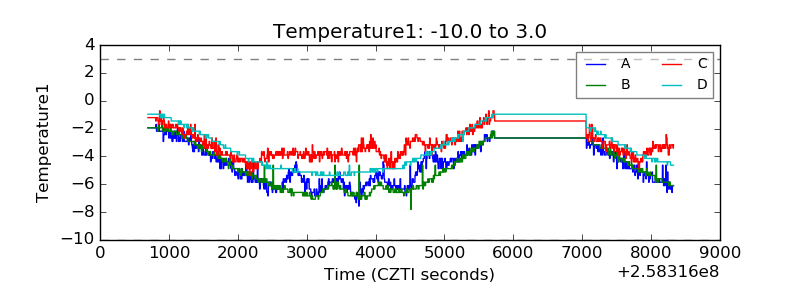 |
| Veto HV Monitor |  |
| Veto LLD | 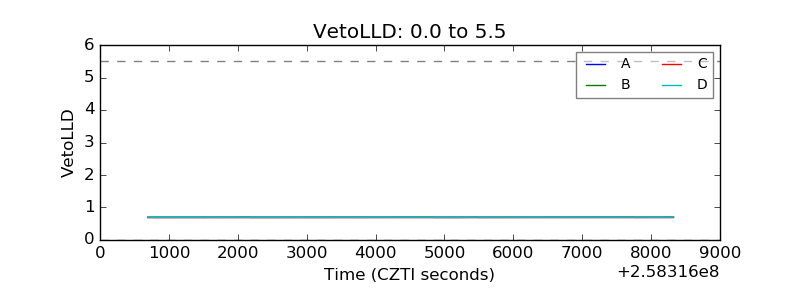 |
| Alpha Counter | 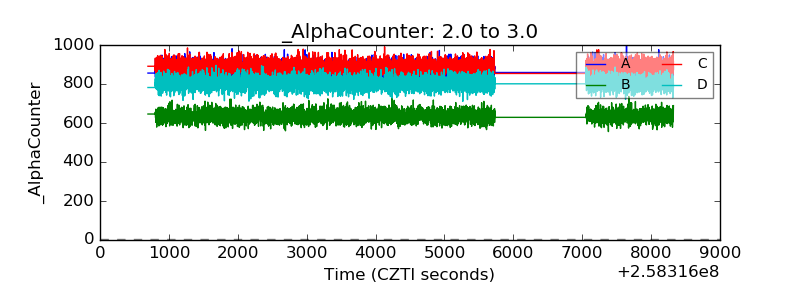 |
| _CPM_Rate | 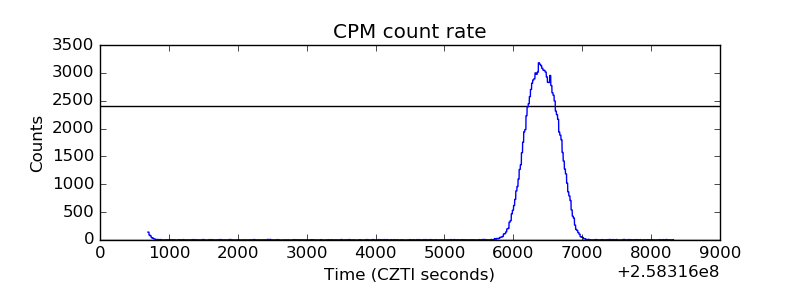 |
| CZT Counter | 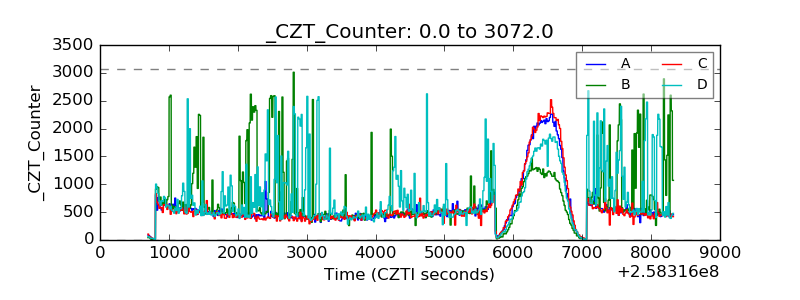 |
| +2.5 Volts monitor |  |
| +5 Volts monitor |  |
| _ROLL_ROT | 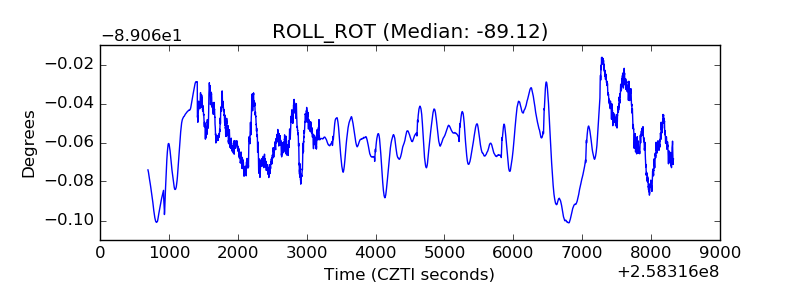 |
| _Roll_DEC | 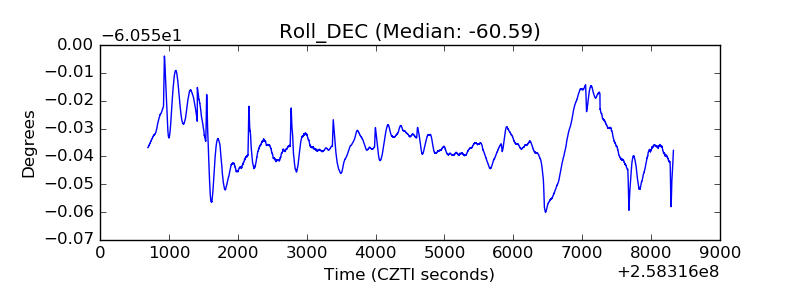 |
| _Roll_RA | 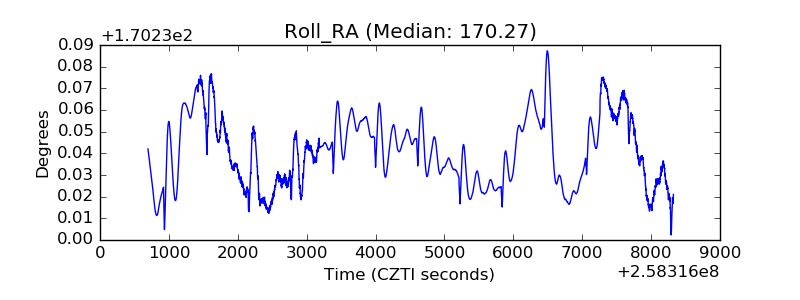 |
| Veto Counter | 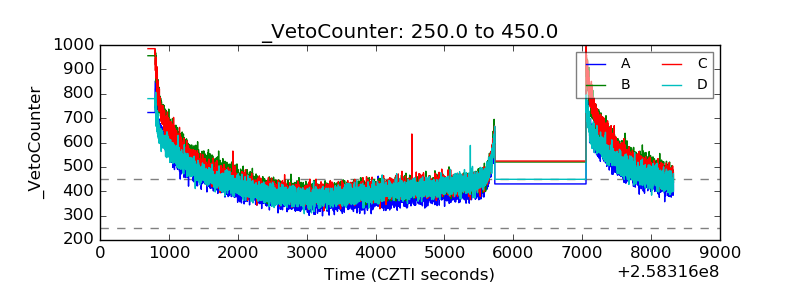 |