| Param | Original file | Final file |
|---|---|---|
| Filename | modeM0/AS1A04_216T01_9000001968_13229cztM0_level2.evt | modeM0/AS1A04_216T01_9000001968_13229cztM0_level2_quad_clean.evt |
| Size (bytes) | 585,524,160 | 98,668,800 |
| Size | 558.4 MB | 94.1 MB |
| Events in quadrant A | 3,004,983 | 678,702 |
| Events in quadrant B | 5,176,665 | 596,610 |
| Events in quadrant C | 2,885,896 | 680,157 |
| Events in quadrant D | 6,249,481 | 604,040 |
| Mode M0 | |||
|---|---|---|---|
| Quadrant | BADHDUFLAG | Total packets | Discarded packets |
| A | 0 | 12917 | 3 |
| B | 0 | 19419 | 2 |
| C | 0 | 12617 | 2 |
| D | 0 | 22808 | 2 |
| Mode M9 | |||
|---|---|---|---|
| Quadrant | BADHDUFLAG | Total packets | Discarded packets |
| A | 0 | 17 | 0 |
| B | 0 | 17 | 0 |
| C | 0 | 17 | 0 |
| D | 0 | 18 | 0 |
| Mode SS | |||
|---|---|---|---|
| Quadrant | BADHDUFLAG | Total packets | Discarded packets |
| A | 0 | 124 | 0 |
| B | 0 | 124 | 0 |
| C | 0 | 124 | 0 |
| D | 0 | 124 | 0 |
| Quadrant | Total seconds | Saturated seconds | Saturation percentage |
|---|---|---|---|
| A | 6134 | 18 | 0.293446% |
| B | 6134 | 1050 | 17.117705% |
| C | 6134 | 9 | 0.146723% |
| D | 6134 | 812 | 13.237692% |
Noise dominated data is calculated using 1-second bins in cleaned event files. If a bin has >2000 counts, and if more than 50% of those come from <1% of pixels, then it is considered to be noise-dominated and hence unusable.
| Quadrant | # 1 sec bins | Bins with >0 counts | Bins with >2000 counts | High rate bins dominated by noise | Noise dominated (total time) | Noise dominated (detector-on time) | Marked lightcurve |
|---|---|---|---|---|---|---|---|
| A | 7535 | 6136 | 2 | 2 | 0.03% | 0.03% | 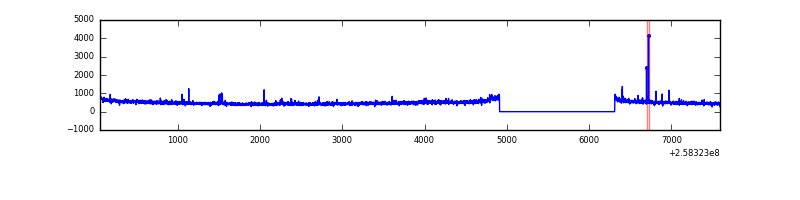 |
| B | 7535 | 6136 | 686 | 686 | 9.10% | 11.18% | 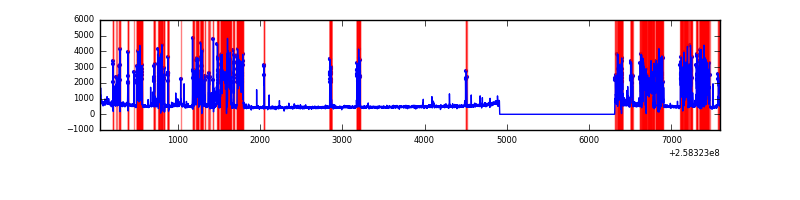 |
| C | 7535 | 6136 | 1 | 1 | 0.01% | 0.02% |  |
| D | 7535 | 6136 | 917 | 917 | 12.17% | 14.94% | 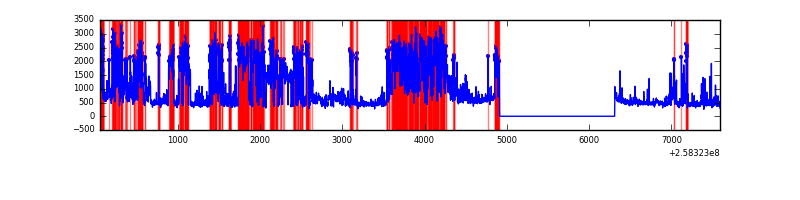 |
Top three noisy pixels from each quadrant. If the there are fewer than three noisy pixels in the level2.evt file, extra rows are filled as -1
| Pixel properties | Quadrant properties | ||||||
|---|---|---|---|---|---|---|---|
| Quadrant | DetID | PixID | Counts | Sigma | Mean | Median | Sigma |
| A | 12 | 189 | 38719 | 251.02 | 752 | 738 | 151.3 |
| A | 15 | 239 | 36651 | 237.35 | 752 | 738 | 151.3 |
| A | 9 | 143 | 15075 | 94.75 | 752 | 738 | 151.3 |
| B | 4 | 239 | 2395740 | 18816.34 | 685 | 669 | 127.3 |
| B | 3 | 64 | 43714 | 338.17 | 685 | 669 | 127.3 |
| B | 0 | 214 | 24614 | 188.12 | 685 | 669 | 127.3 |
| C | 14 | 234 | 9140 | 49.67 | 736 | 742 | 169.1 |
| C | 15 | 208 | 5440 | 27.79 | 736 | 742 | 169.1 |
| C | 13 | 61 | 5359 | 27.31 | 736 | 742 | 169.1 |
| D | 1 | 52 | 3336169 | 20072.69 | 691 | 671 | 166.2 |
| D | 8 | 195 | 160755 | 963.37 | 691 | 671 | 166.2 |
| D | 5 | 222 | 95480 | 570.55 | 691 | 671 | 166.2 |
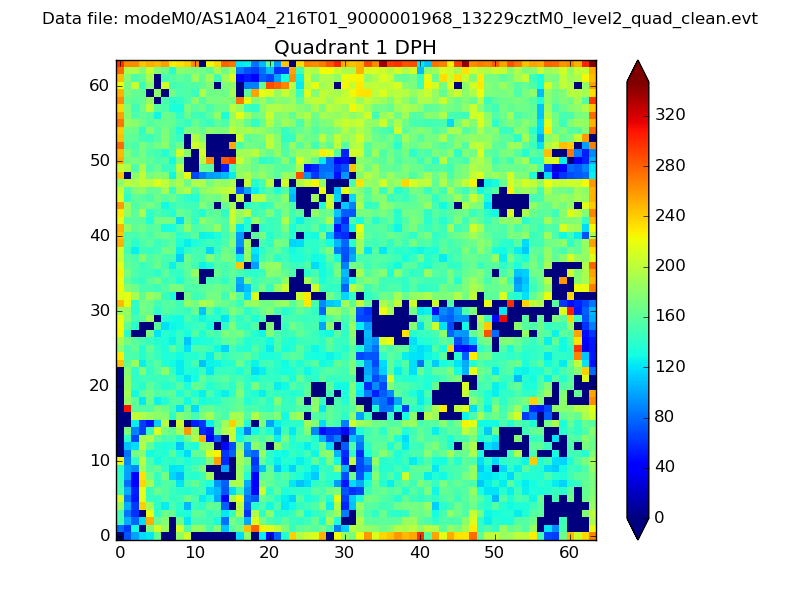
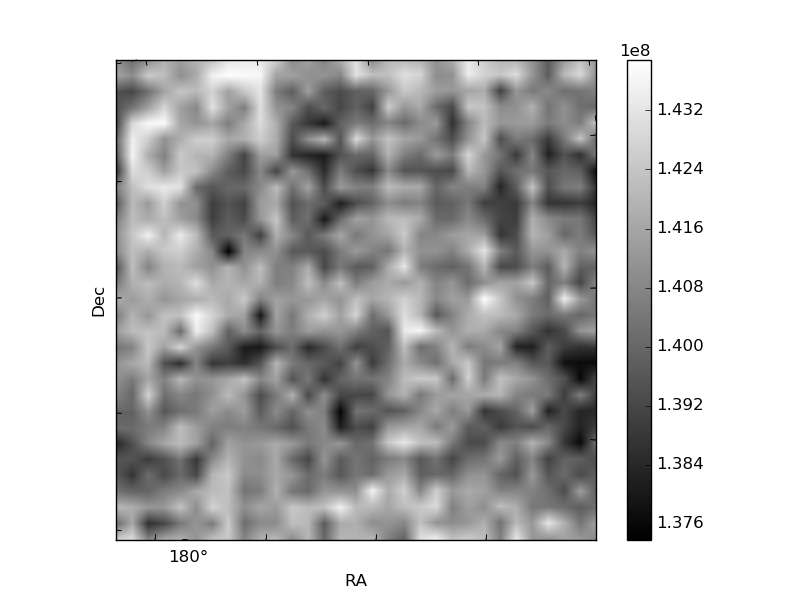
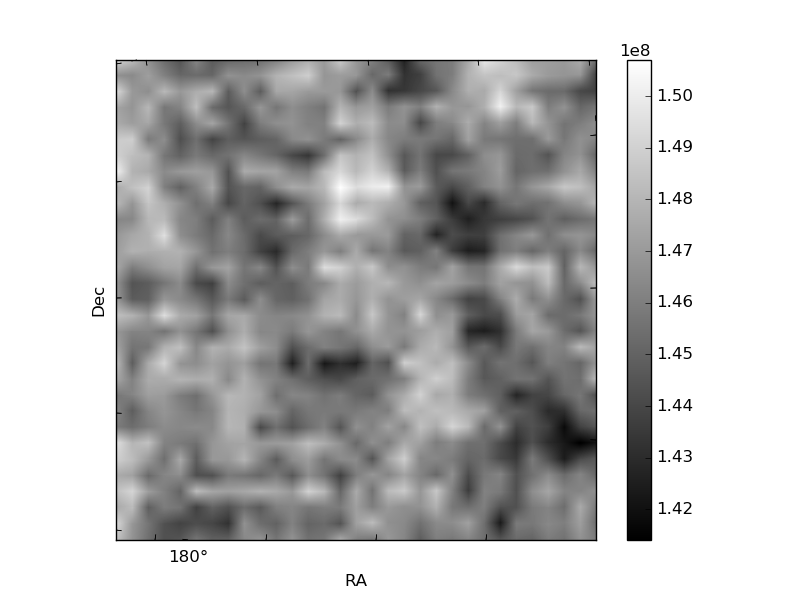
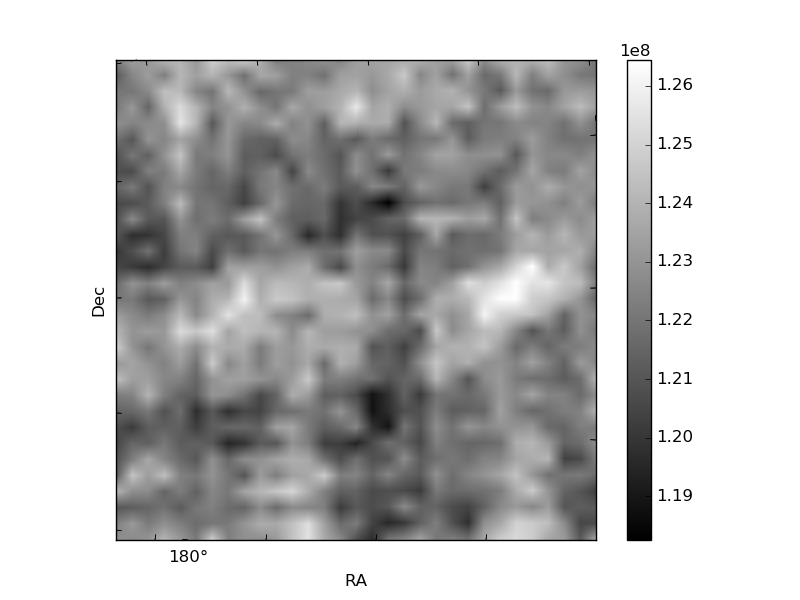
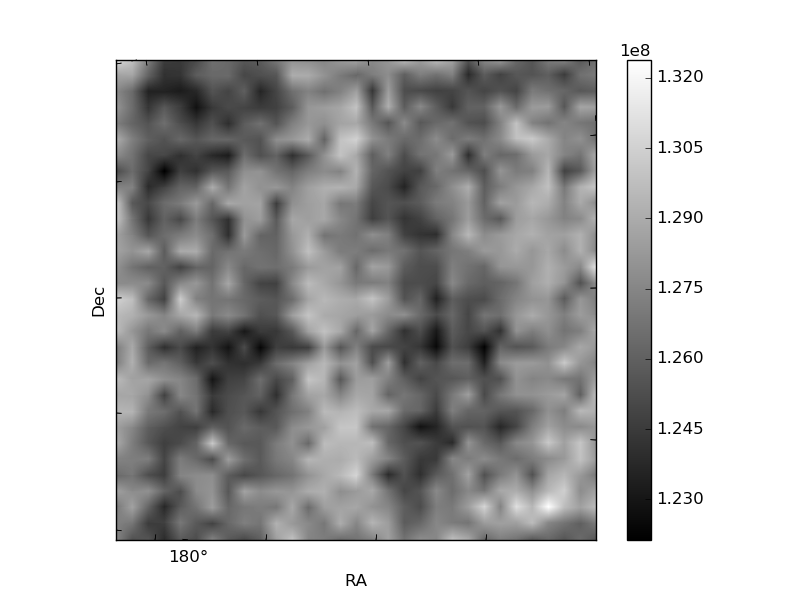
Histogram calculated using DETX and DETY for each event in the final _common_clean file
| Quadrant A | 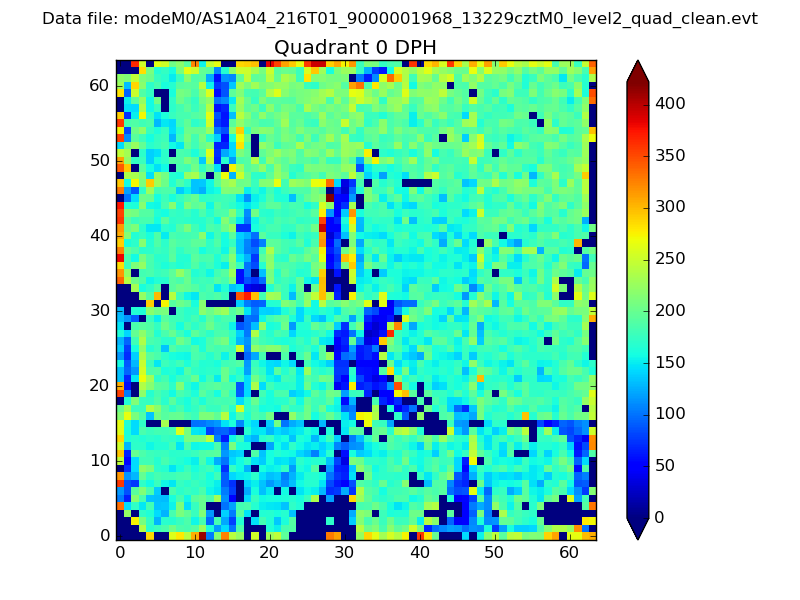 |
 |
Quadrant B |
|---|---|---|---|
| Quadrant D | 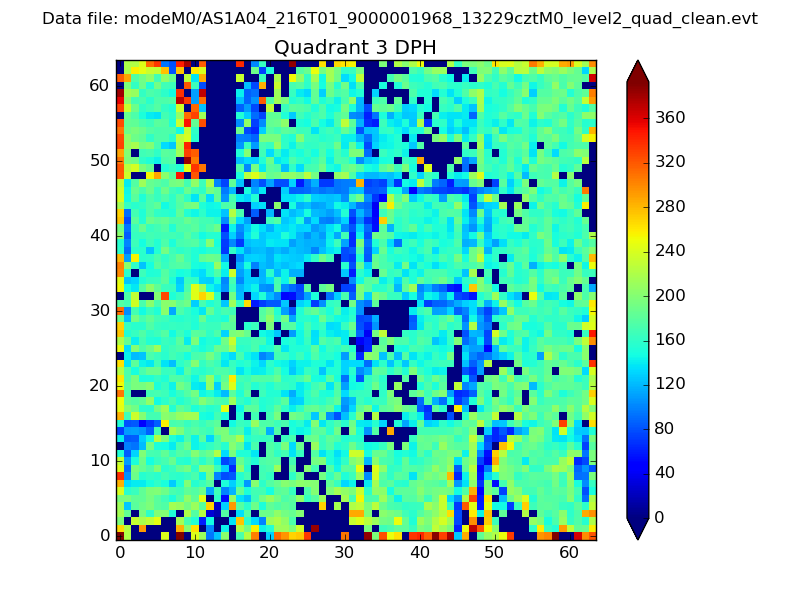 |
 |
Quadrant C |
| Plot type | Count rate plots | Images |
|---|---|---|
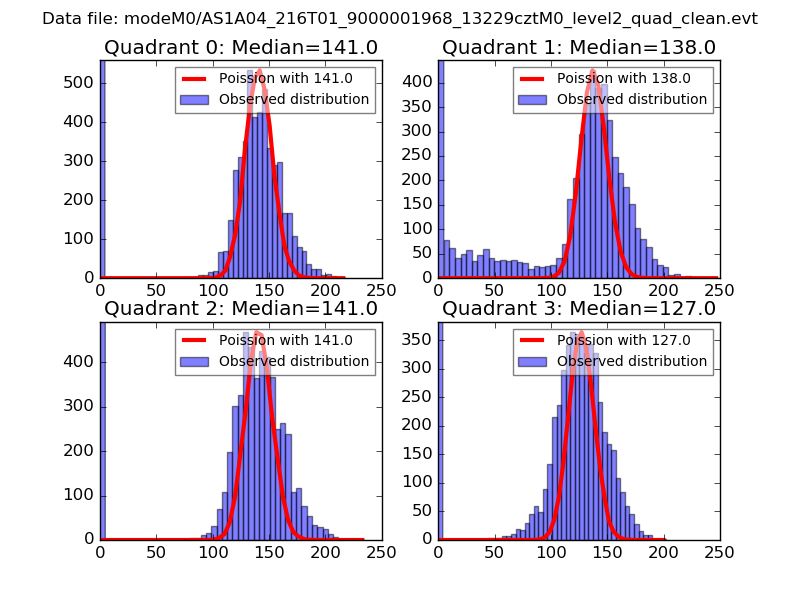
| Comparison with Poisson distribution Blue bars denote a histogram of data divided into 1 sec bins. Red curve is a Poisson curve with rate = median count rate of data. |
 |
 |
| Quadrant-wise count rates Data is divided into 100 sec bins |
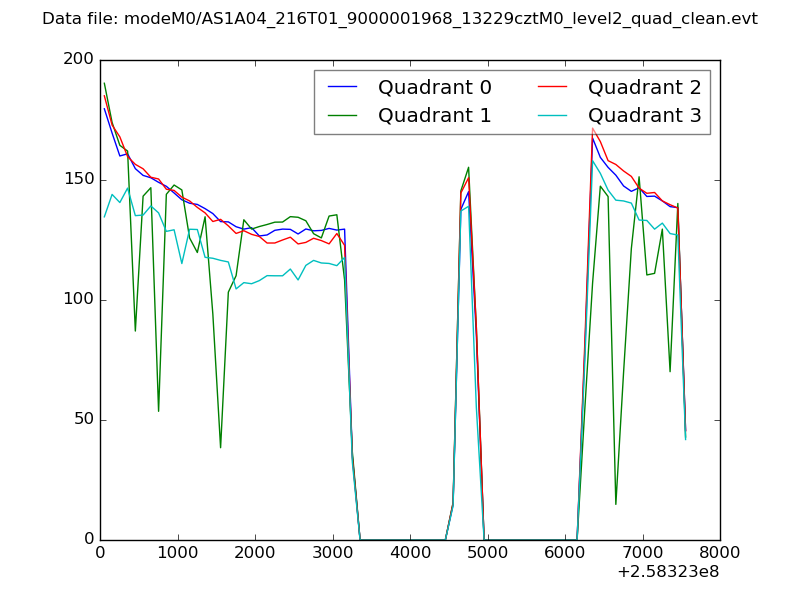 |
|
| Module-wise count rates for Quadrant A Data is divided into 100 sec bins |
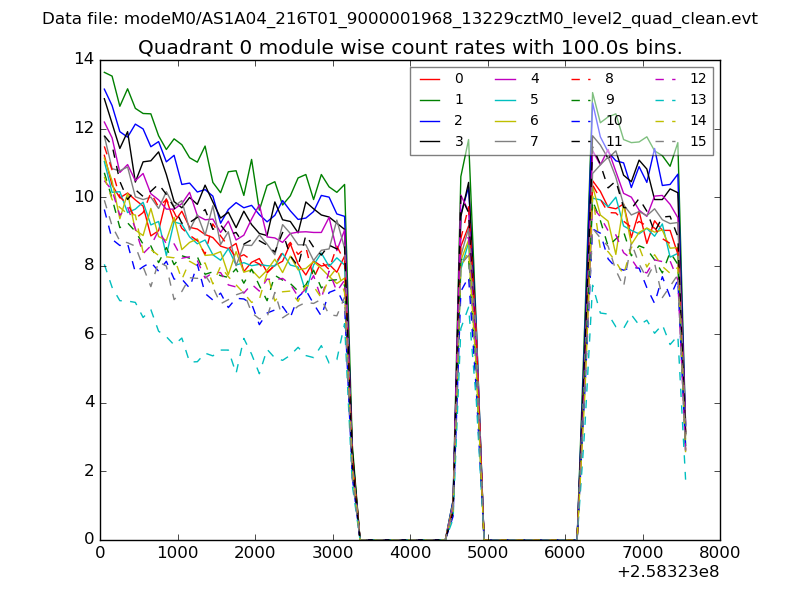 |
 |
| Module-wise count rates for Quadrant B Data is divided into 100 sec bins |
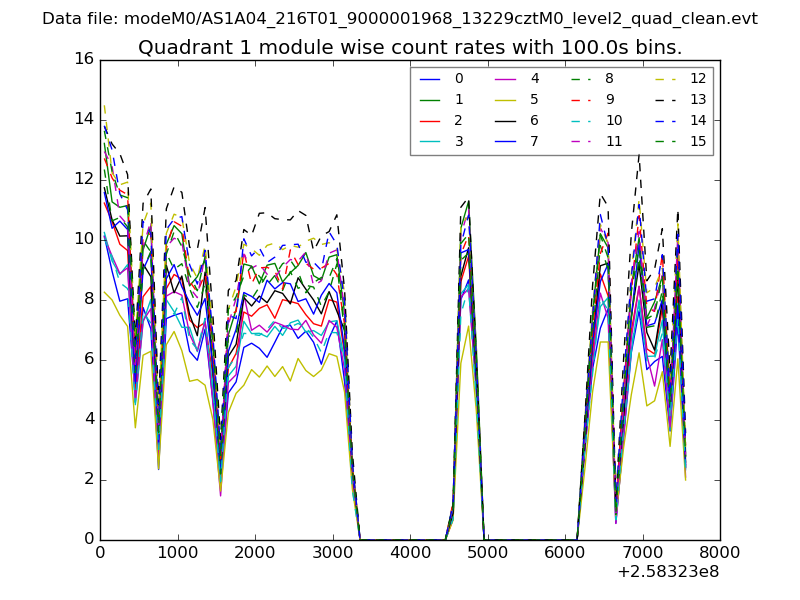 |
 |
| Module-wise count rates for Quadrant C Data is divided into 100 sec bins |
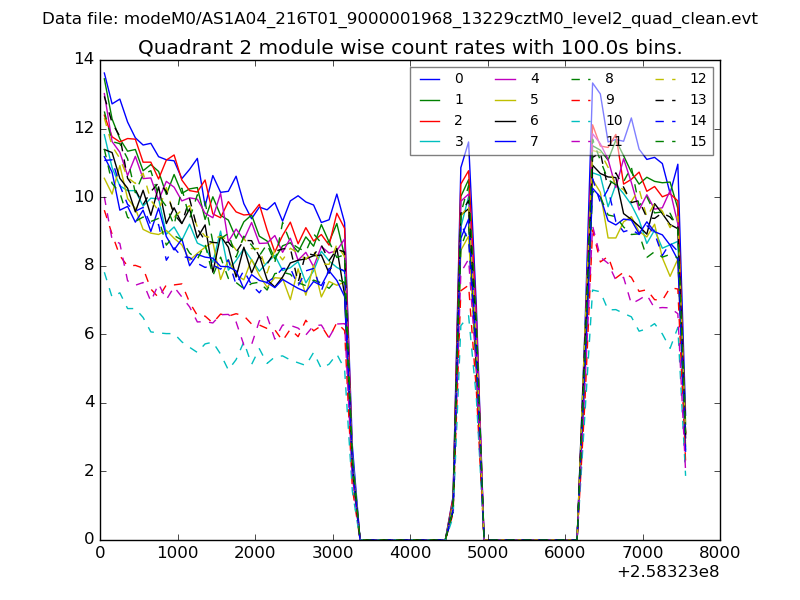 |
 |
| Module-wise count rates for Quadrant D Data is divided into 100 sec bins |
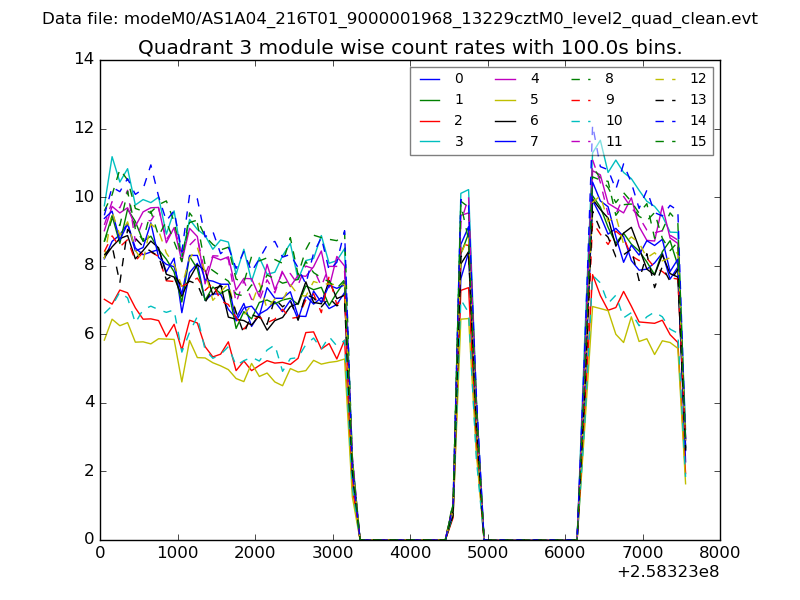 |
 |
| Parameter | Plot |
|---|---|
| CZT HV Monitor |  |
| D_VDD | 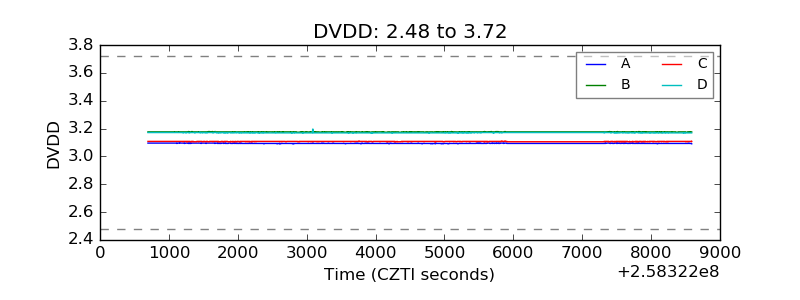 |
| Temperature 1 |  |
| Veto HV Monitor | 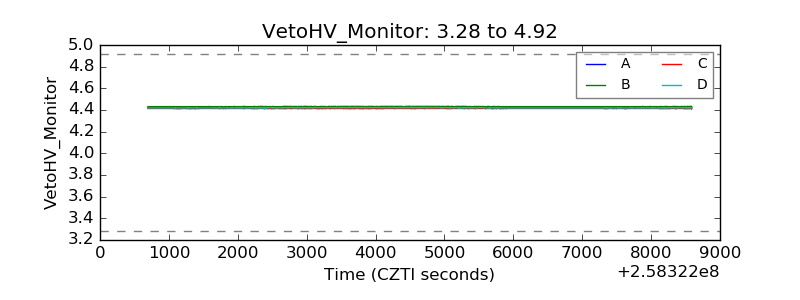 |
| Veto LLD | 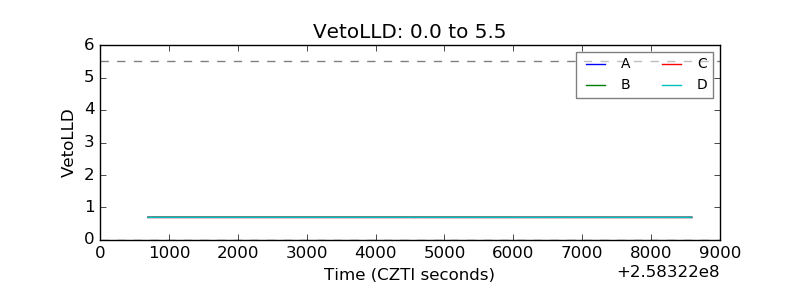 |
| Alpha Counter | 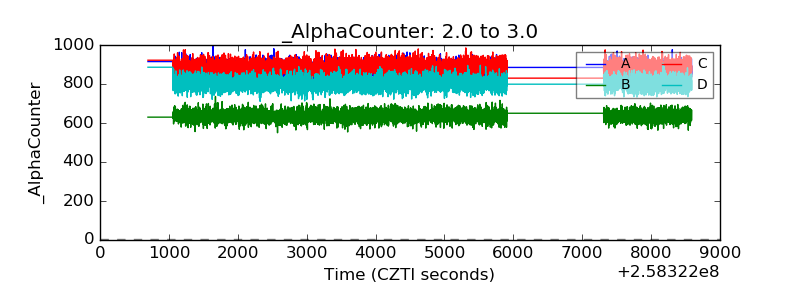 |
| _CPM_Rate | 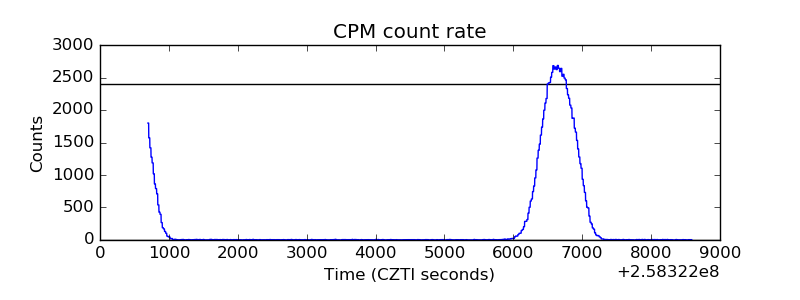 |
| CZT Counter |  |
| +2.5 Volts monitor |  |
| +5 Volts monitor | 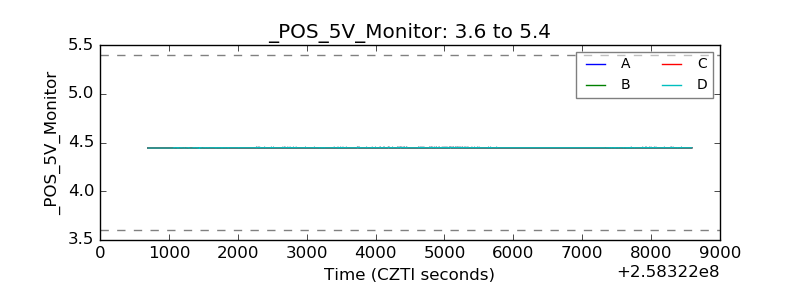 |
| _ROLL_ROT | 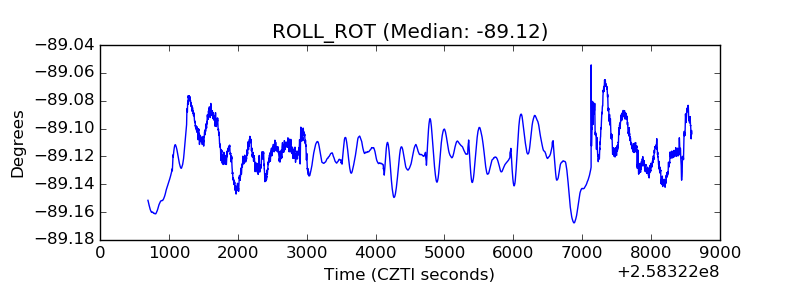 |
| _Roll_DEC | 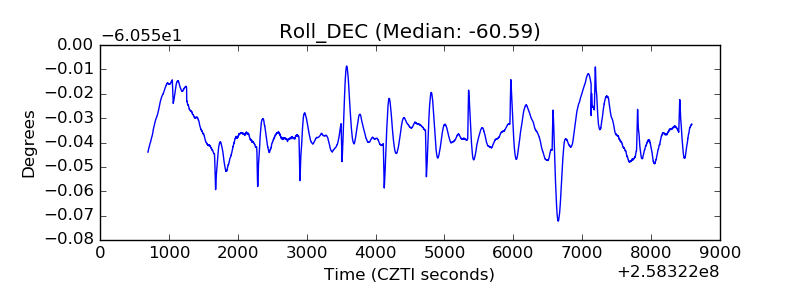 |
| _Roll_RA | 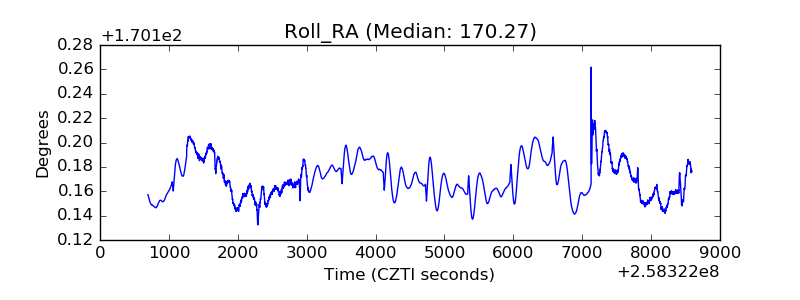 |
| Veto Counter | 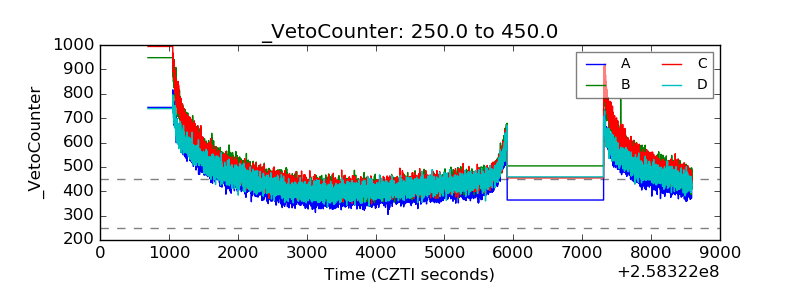 |