| Param | Original file | Final file |
|---|---|---|
| Filename | modeM0/AS1A04_216T01_9000001968_13231cztM0_level2.evt | modeM0/AS1A04_216T01_9000001968_13231cztM0_level2_quad_clean.evt |
| Size (bytes) | 477,100,800 | 103,838,400 |
| Size | 455.0 MB | 99.0 MB |
| Events in quadrant A | 3,118,702 | 685,375 |
| Events in quadrant B | 4,887,946 | 657,229 |
| Events in quadrant C | 3,058,834 | 691,292 |
| Events in quadrant D | 2,934,501 | 650,020 |
| Mode M0 | |||
|---|---|---|---|
| Quadrant | BADHDUFLAG | Total packets | Discarded packets |
| A | 0 | 13708 | 3 |
| B | 0 | 18943 | 2 |
| C | 0 | 13582 | 2 |
| D | 0 | 13577 | 2 |
| Mode M9 | |||
|---|---|---|---|
| Quadrant | BADHDUFLAG | Total packets | Discarded packets |
| A | 0 | 20 | 0 |
| B | 0 | 20 | 0 |
| C | 0 | 20 | 0 |
| D | 0 | 21 | 0 |
| Mode SS | |||
|---|---|---|---|
| Quadrant | BADHDUFLAG | Total packets | Discarded packets |
| A | 0 | 134 | 0 |
| B | 0 | 134 | 0 |
| C | 0 | 134 | 0 |
| D | 0 | 134 | 0 |
| Quadrant | Total seconds | Saturated seconds | Saturation percentage |
|---|---|---|---|
| A | 6605 | 15 | 0.227101% |
| B | 6605 | 751 | 11.370174% |
| C | 6605 | 18 | 0.272521% |
| D | 6605 | 12 | 0.181681% |
Noise dominated data is calculated using 1-second bins in cleaned event files. If a bin has >2000 counts, and if more than 50% of those come from <1% of pixels, then it is considered to be noise-dominated and hence unusable.
| Quadrant | # 1 sec bins | Bins with >0 counts | Bins with >2000 counts | High rate bins dominated by noise | Noise dominated (total time) | Noise dominated (detector-on time) | Marked lightcurve |
|---|---|---|---|---|---|---|---|
| A | 7726 | 6607 | 0 | 0 | 0.00% | 0.00% | 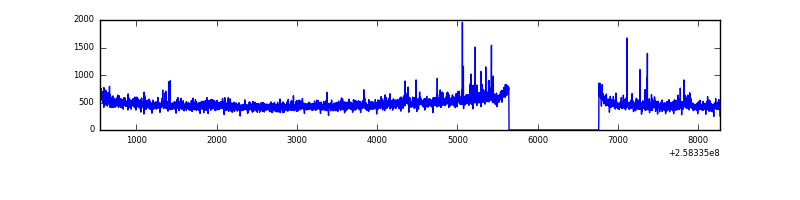 |
| B | 7726 | 6607 | 471 | 471 | 6.10% | 7.13% | 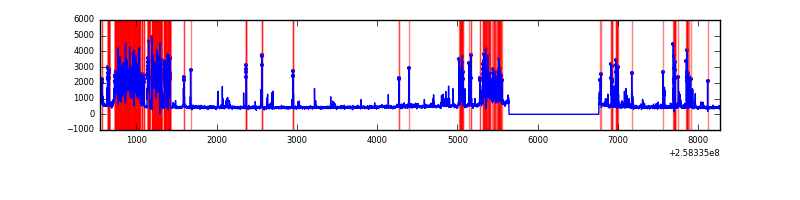 |
| C | 7726 | 6607 | 5 | 5 | 0.06% | 0.08% | 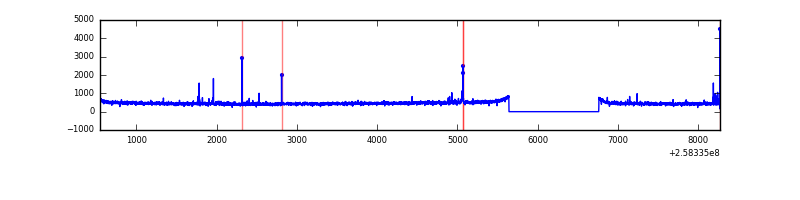 |
| D | 7726 | 6607 | 2 | 2 | 0.03% | 0.03% | 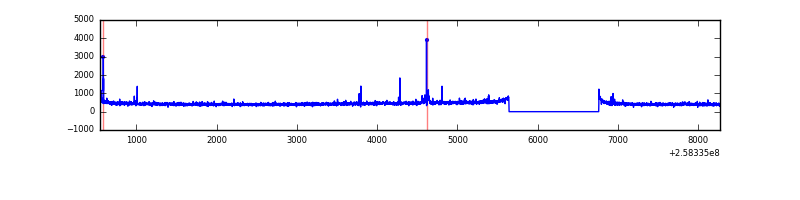 |
Top three noisy pixels from each quadrant. If the there are fewer than three noisy pixels in the level2.evt file, extra rows are filled as -1
| Pixel properties | Quadrant properties | ||||||
|---|---|---|---|---|---|---|---|
| Quadrant | DetID | PixID | Counts | Sigma | Mean | Median | Sigma |
| A | 12 | 189 | 79148 | 498.06 | 775 | 759 | 157.4 |
| A | 15 | 239 | 27895 | 172.41 | 775 | 759 | 157.4 |
| A | 1 | 162 | 14548 | 87.61 | 775 | 759 | 157.4 |
| B | 4 | 239 | 1874193 | 13339.39 | 752 | 732 | 140.4 |
| B | 3 | 209 | 24179 | 166.95 | 752 | 732 | 140.4 |
| B | 3 | 64 | 23897 | 164.94 | 752 | 732 | 140.4 |
| C | 15 | 208 | 49301 | 274.55 | 770 | 772 | 176.8 |
| C | 13 | 61 | 5622 | 27.44 | 770 | 772 | 176.8 |
| C | 14 | 234 | 4473 | 20.94 | 770 | 772 | 176.8 |
| D | 1 | 52 | 22703 | 121.42 | 752 | 729 | 181.0 |
| D | 2 | 234 | 22255 | 118.95 | 752 | 729 | 181.0 |
| D | 8 | 195 | 21839 | 116.65 | 752 | 729 | 181.0 |
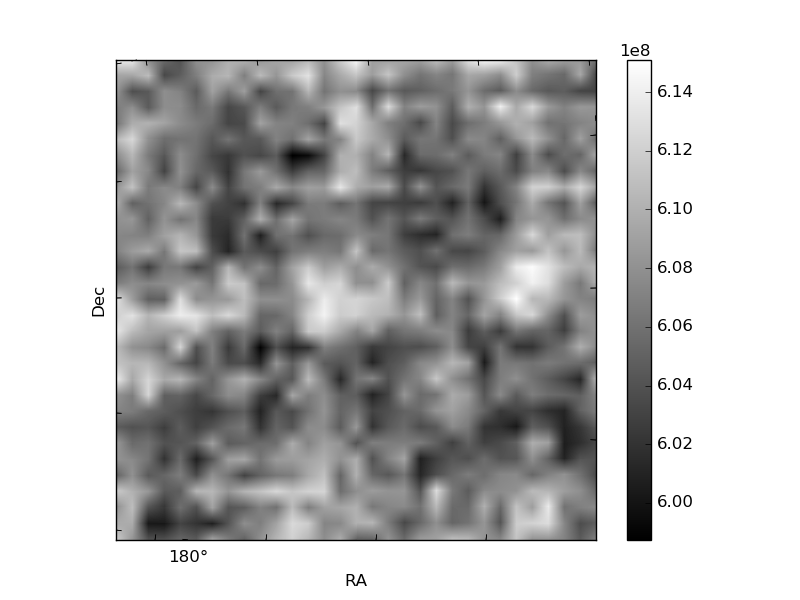
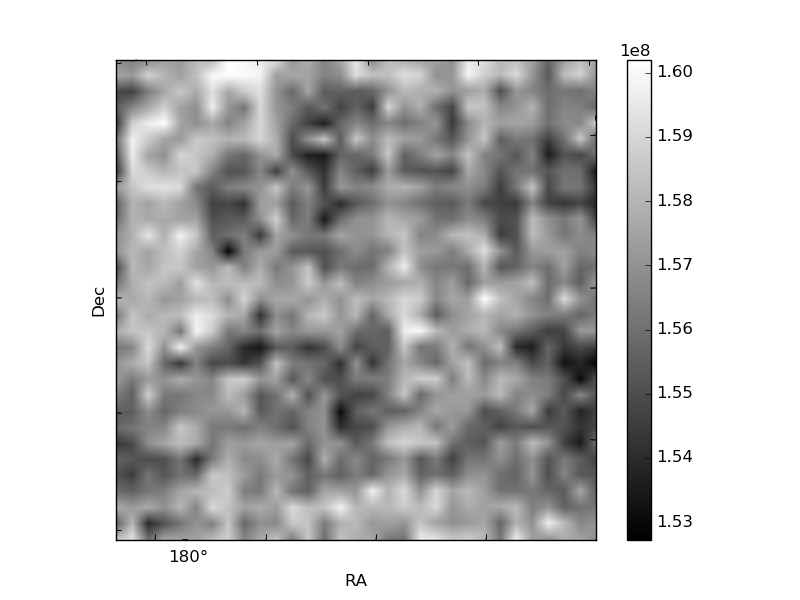
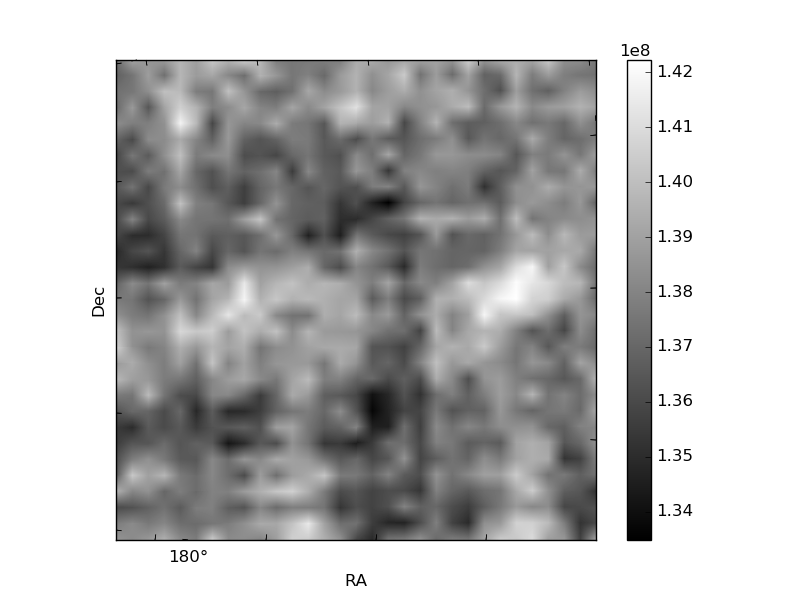
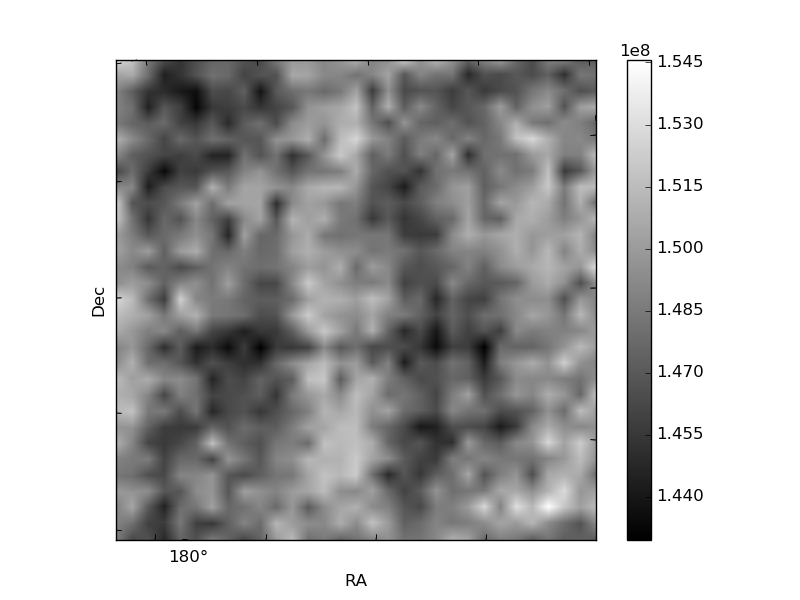
Histogram calculated using DETX and DETY for each event in the final _common_clean file
| Quadrant A | 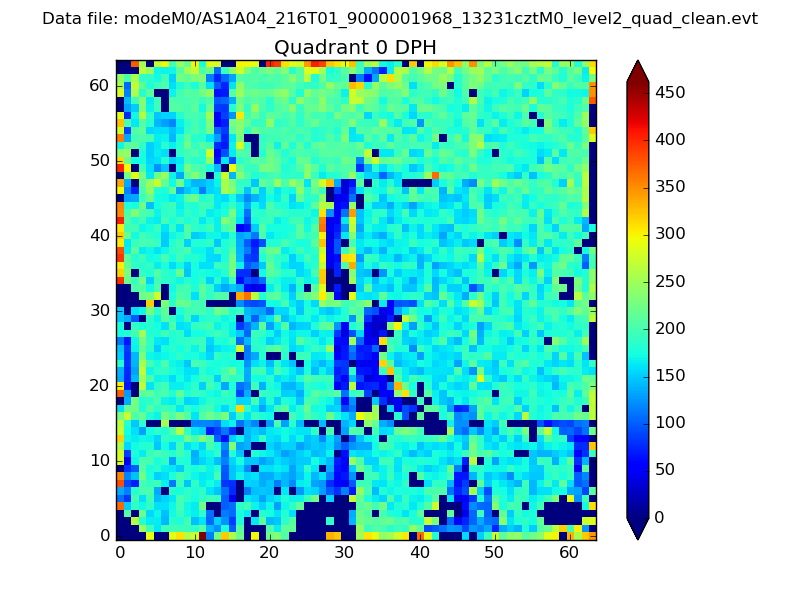 |
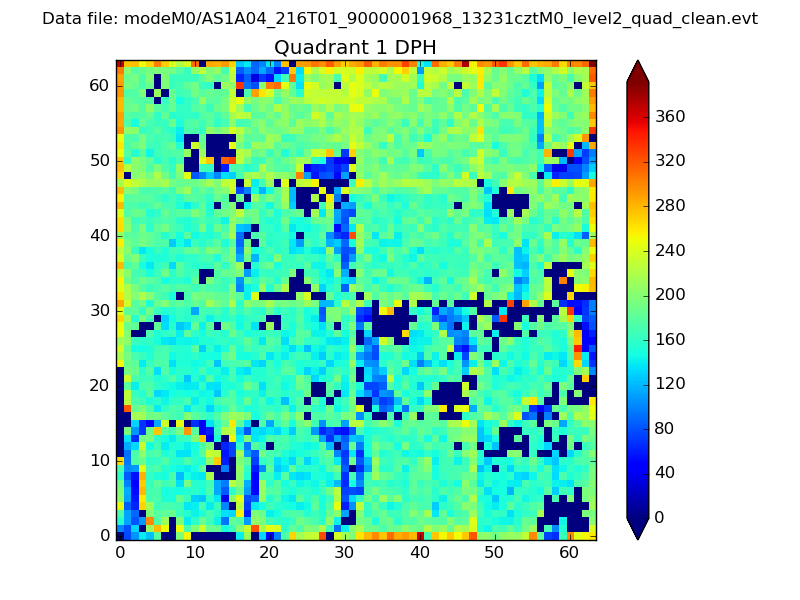 |
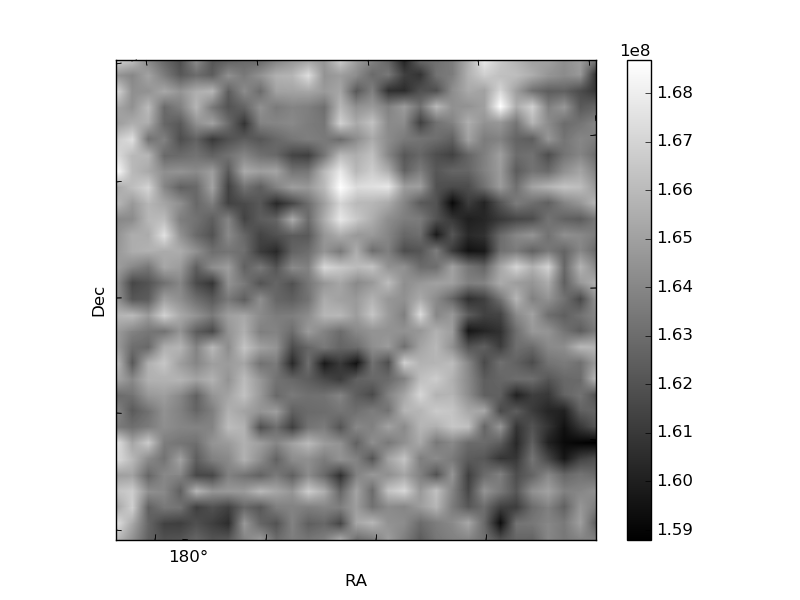
Quadrant B |
|---|---|---|---|
| Quadrant D | 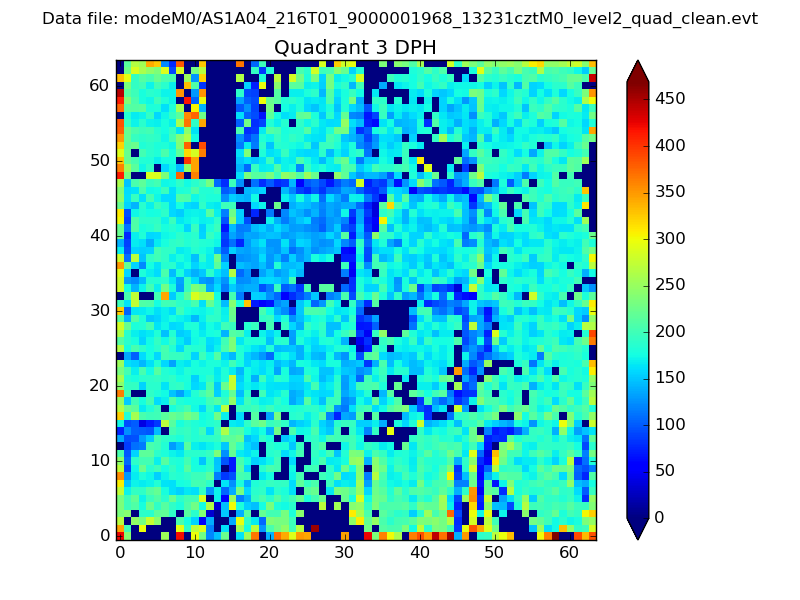 |
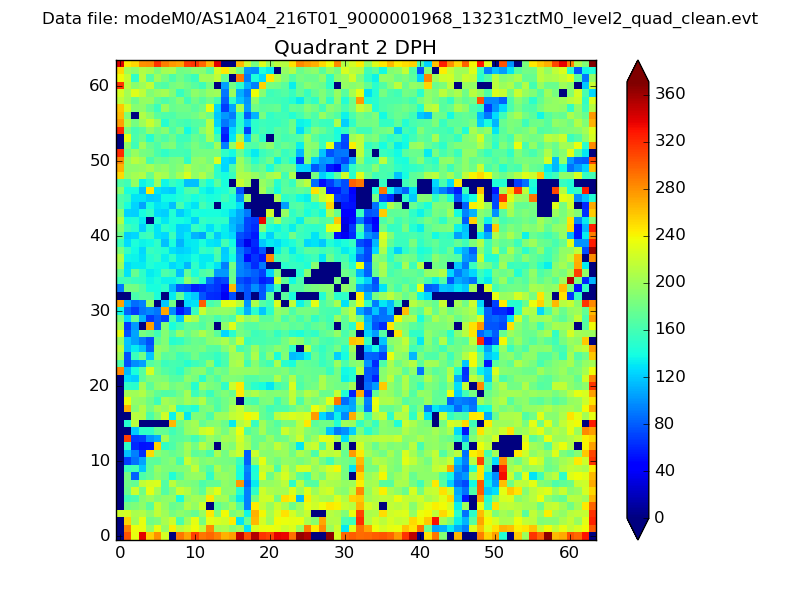 |
Quadrant C |
| Plot type | Count rate plots | Images |
|---|---|---|
| Comparison with Poisson distribution Blue bars denote a histogram of data divided into 1 sec bins. Red curve is a Poisson curve with rate = median count rate of data. |
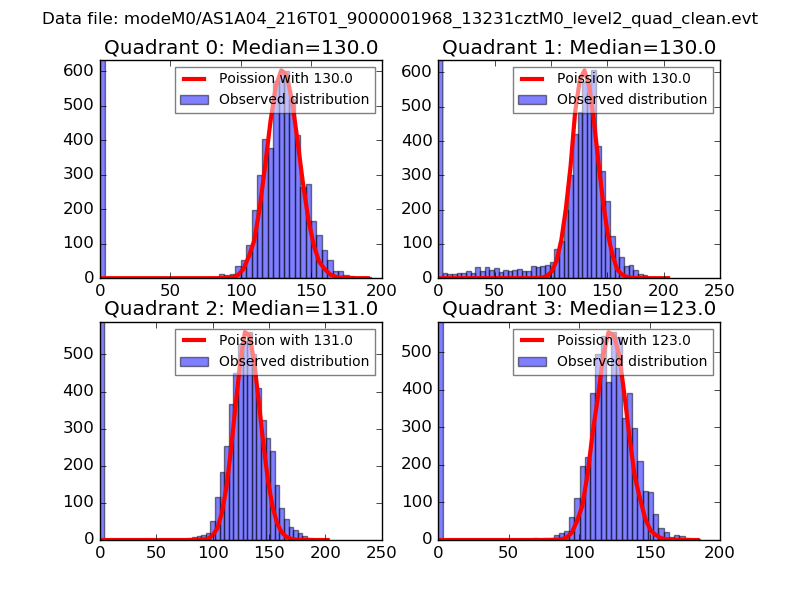 |
 |
| Quadrant-wise count rates Data is divided into 100 sec bins |
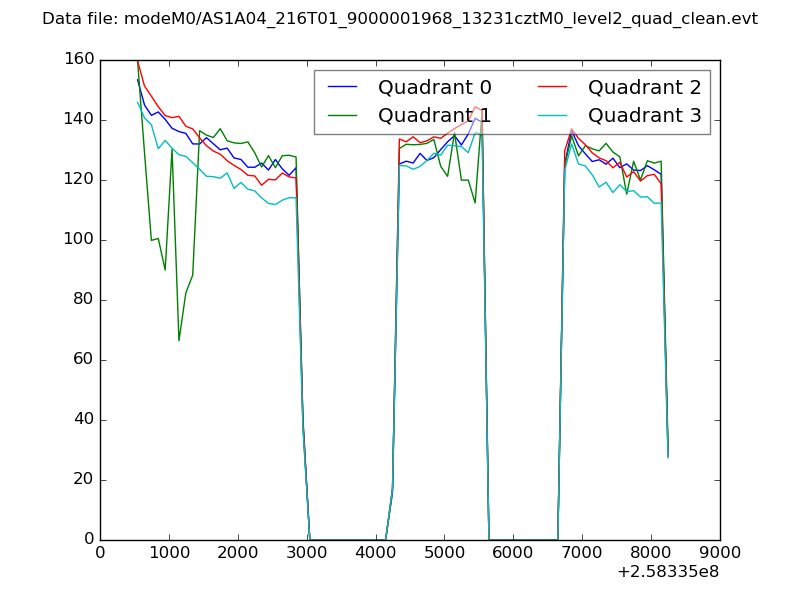 |
|
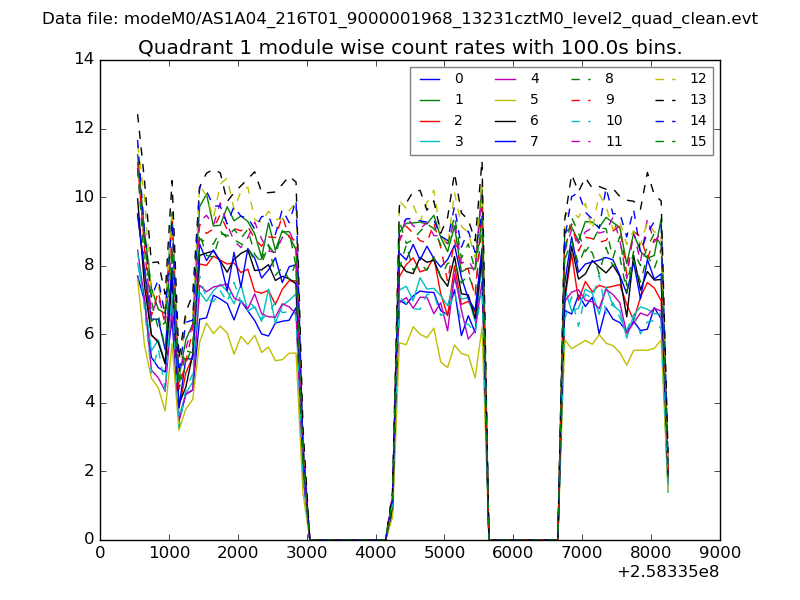
| Module-wise count rates for Quadrant A Data is divided into 100 sec bins |
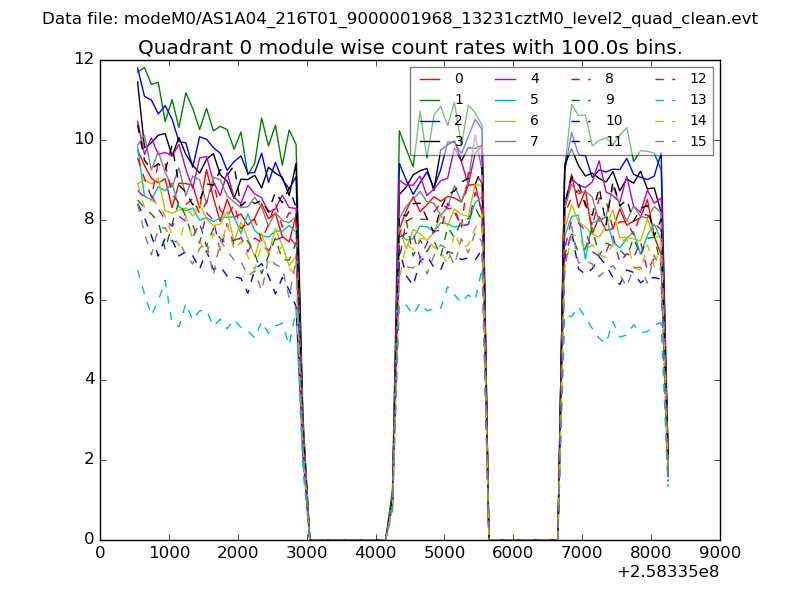 |
 |
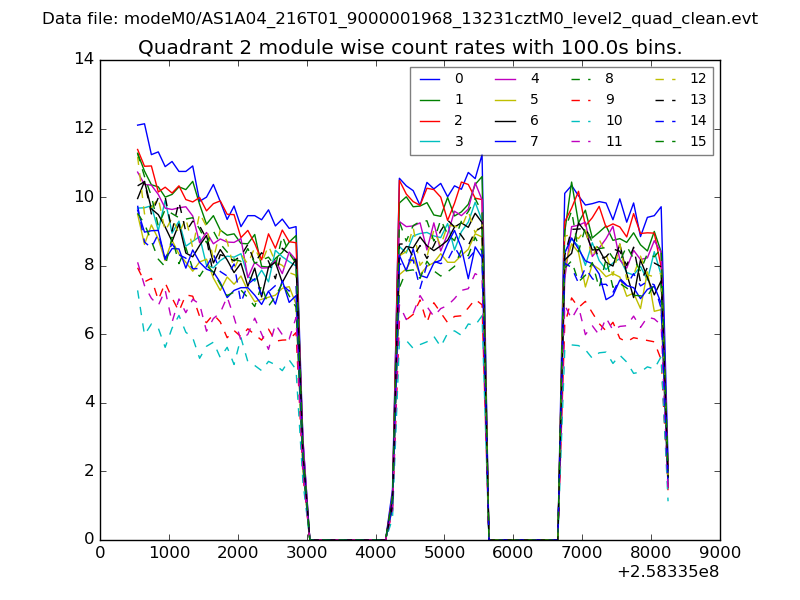
| Module-wise count rates for Quadrant B Data is divided into 100 sec bins |
 |
 |
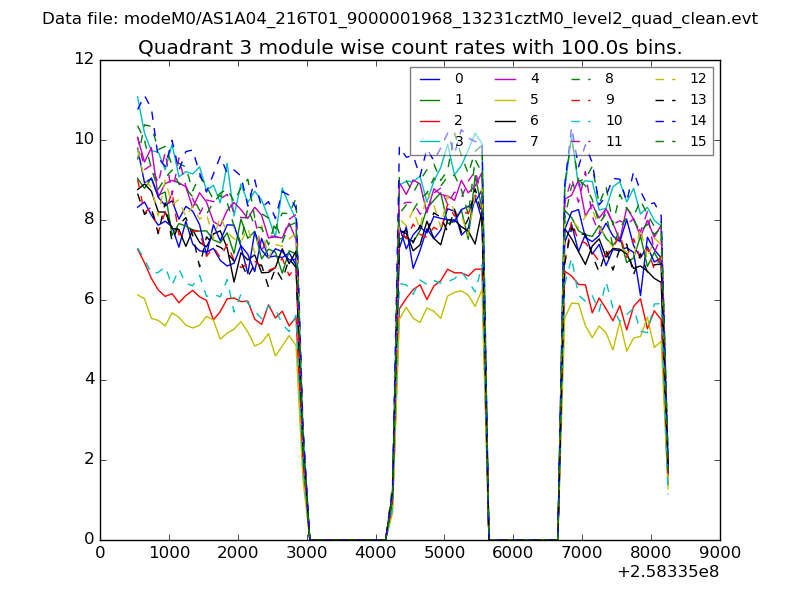
| Module-wise count rates for Quadrant C Data is divided into 100 sec bins |
 |
 |
| Module-wise count rates for Quadrant D Data is divided into 100 sec bins |
 |
 |
| Parameter | Plot |
|---|---|
| CZT HV Monitor | 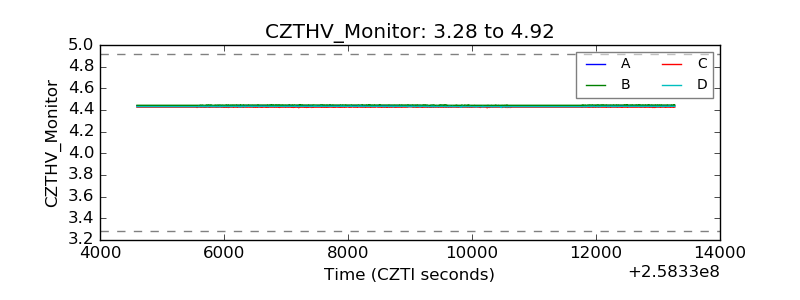 |
| D_VDD | 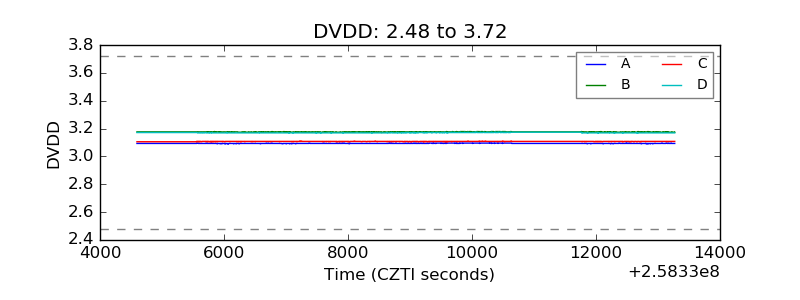 |
| Temperature 1 | 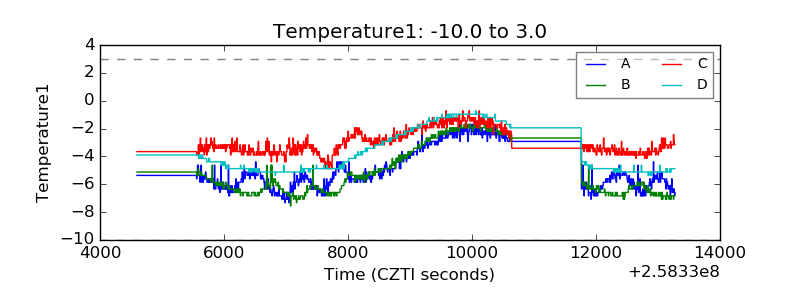 |
| Veto HV Monitor |  |
| Veto LLD | 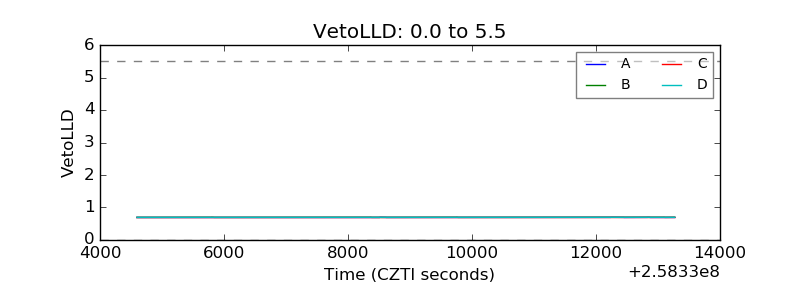 |
| Alpha Counter | 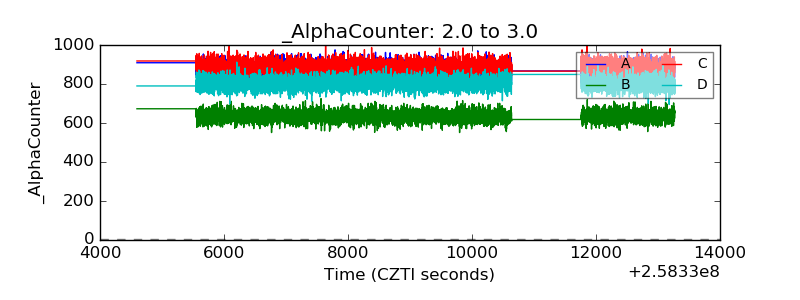 |
| _CPM_Rate | 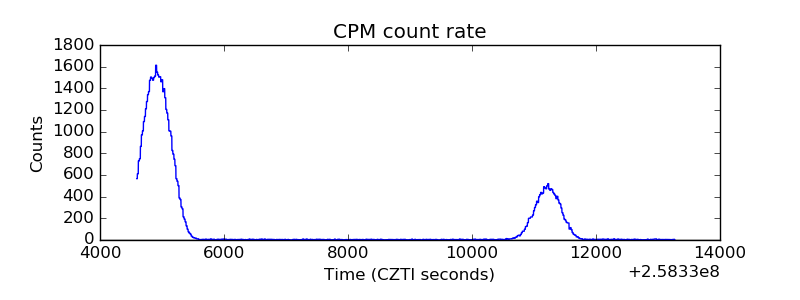 |
| CZT Counter | 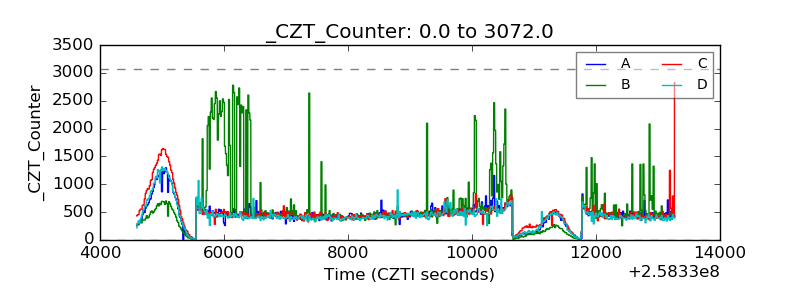 |
| +2.5 Volts monitor |  |
| +5 Volts monitor | 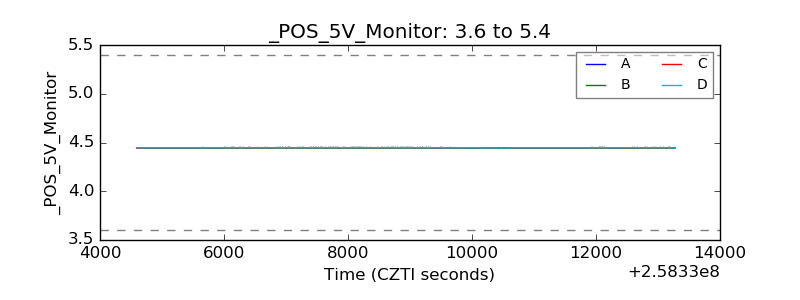 |
| _ROLL_ROT | 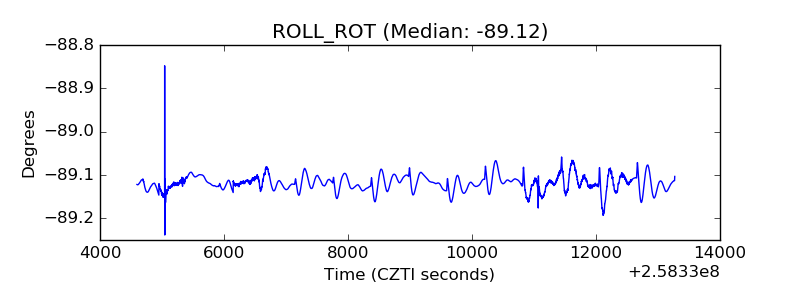 |
| _Roll_DEC | 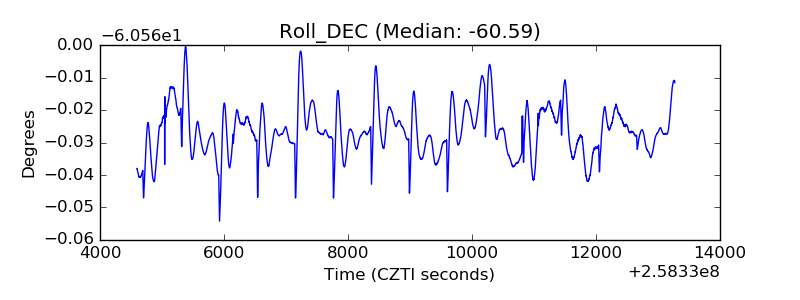 |
| _Roll_RA | 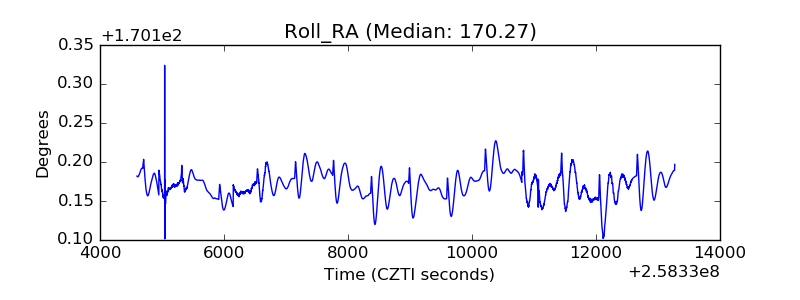 |
| Veto Counter | 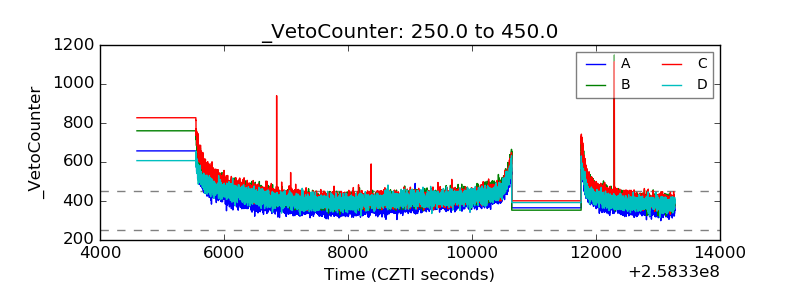 |