| Param | Original file | Final file |
|---|---|---|
| Filename | modeM0/AS1A04_216T01_9000001968_13233cztM0_level2.evt | modeM0/AS1A04_216T01_9000001968_13233cztM0_level2_quad_clean.evt |
| Size (bytes) | 654,269,760 | 123,370,560 |
| Size | 624.0 MB | 117.7 MB |
| Events in quadrant A | 4,867,310 | 807,684 |
| Events in quadrant B | 6,627,392 | 770,122 |
| Events in quadrant C | 3,779,587 | 817,238 |
| Events in quadrant D | 3,989,170 | 776,029 |
| Mode M0 | |||
|---|---|---|---|
| Quadrant | BADHDUFLAG | Total packets | Discarded packets |
| A | 0 | 19754 | 3 |
| B | 0 | 25110 | 2 |
| C | 0 | 16996 | 2 |
| D | 0 | 17715 | 2 |
| Mode M9 | |||
|---|---|---|---|
| Quadrant | BADHDUFLAG | Total packets | Discarded packets |
| A | 0 | 9 | 0 |
| B | 0 | 9 | 0 |
| C | 0 | 9 | 0 |
| D | 0 | 9 | 0 |
| Mode SS | |||
|---|---|---|---|
| Quadrant | BADHDUFLAG | Total packets | Discarded packets |
| A | 0 | 168 | 0 |
| B | 0 | 168 | 0 |
| C | 0 | 168 | 0 |
| D | 0 | 168 | 0 |
| Quadrant | Total seconds | Saturated seconds | Saturation percentage |
|---|---|---|---|
| A | 8128 | 435 | 5.351870% |
| B | 8128 | 1266 | 15.575787% |
| C | 8128 | 254 | 3.125000% |
| D | 8128 | 273 | 3.358760% |
Noise dominated data is calculated using 1-second bins in cleaned event files. If a bin has >2000 counts, and if more than 50% of those come from <1% of pixels, then it is considered to be noise-dominated and hence unusable.
| Quadrant | # 1 sec bins | Bins with >0 counts | Bins with >2000 counts | High rate bins dominated by noise | Noise dominated (total time) | Noise dominated (detector-on time) | Marked lightcurve |
|---|---|---|---|---|---|---|---|
| A | 8984 | 8132 | 140 | 140 | 1.56% | 1.72% | 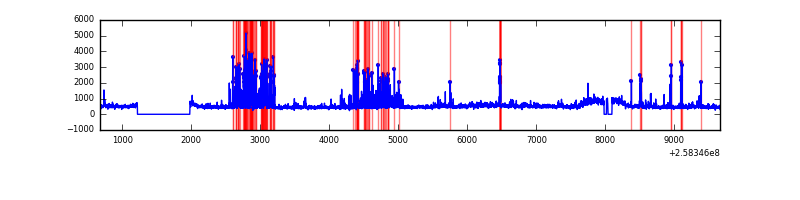 |
| B | 8984 | 8130 | 748 | 748 | 8.33% | 9.20% | 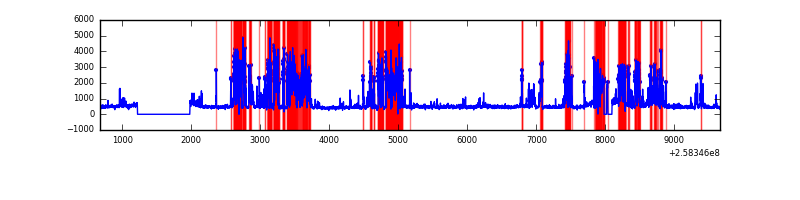 |
| C | 8984 | 8132 | 1 | 1 | 0.01% | 0.01% | 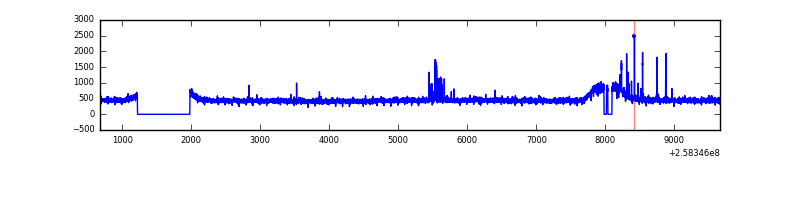 |
| D | 8984 | 8132 | 40 | 40 | 0.45% | 0.49% | 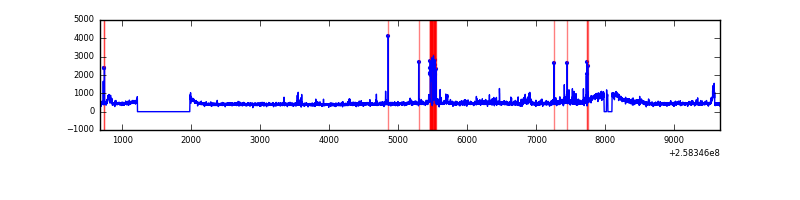 |
Top three noisy pixels from each quadrant. If the there are fewer than three noisy pixels in the level2.evt file, extra rows are filled as -1
| Pixel properties | Quadrant properties | ||||||
|---|---|---|---|---|---|---|---|
| Quadrant | DetID | PixID | Counts | Sigma | Mean | Median | Sigma |
| A | 15 | 239 | 893384 | 4603.01 | 956 | 933 | 193.9 |
| A | 12 | 189 | 200571 | 1029.68 | 956 | 933 | 193.9 |
| A | 1 | 162 | 30145 | 150.67 | 956 | 933 | 193.9 |
| B | 4 | 239 | 3078432 | 18197.96 | 887 | 863 | 169.1 |
| B | 0 | 197 | 24967 | 142.53 | 887 | 863 | 169.1 |
| B | 12 | 111 | 19538 | 110.43 | 887 | 863 | 169.1 |
| C | 15 | 208 | 81256 | 366.11 | 947 | 948 | 219.4 |
| C | 13 | 61 | 7047 | 27.8 | 947 | 948 | 219.4 |
| C | 8 | 222 | 4270 | 15.14 | 947 | 948 | 219.4 |
| D | 5 | 222 | 160485 | 712.29 | 935 | 906 | 224.0 |
| D | 1 | 52 | 122308 | 541.88 | 935 | 906 | 224.0 |
| D | 8 | 195 | 105023 | 464.73 | 935 | 906 | 224.0 |
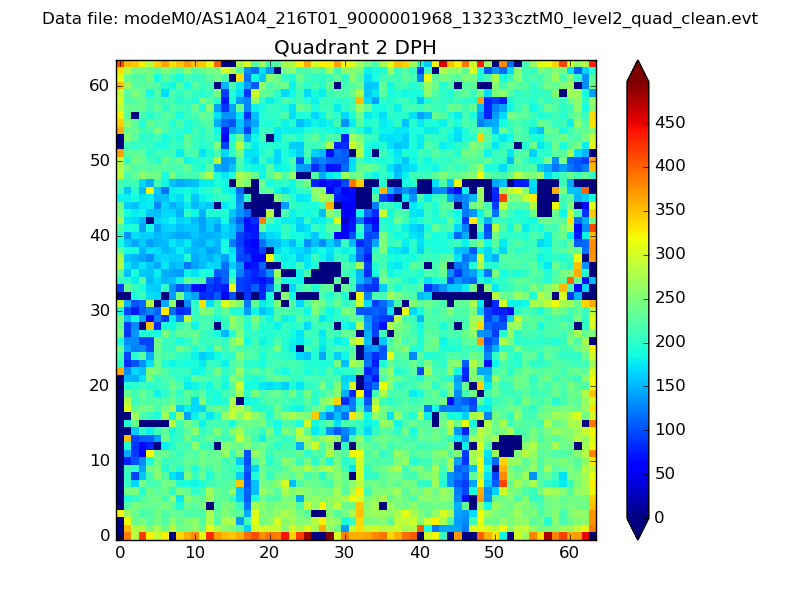
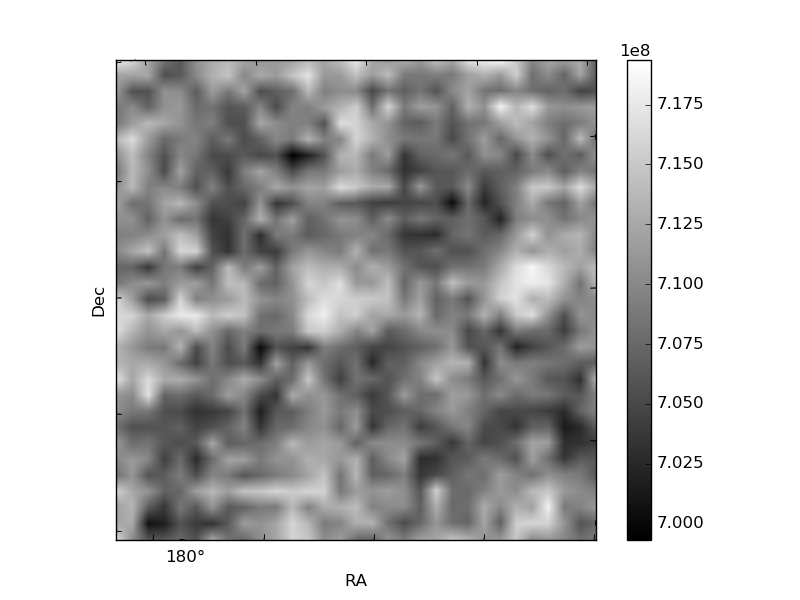
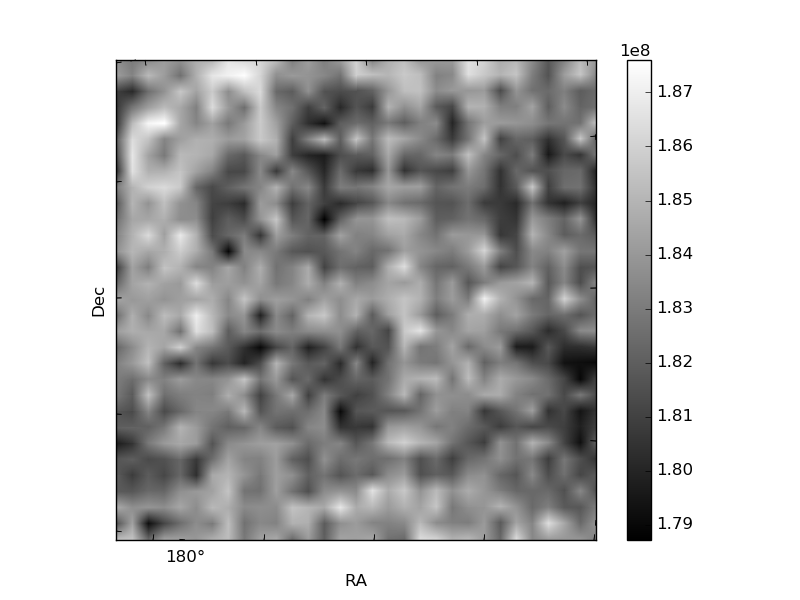
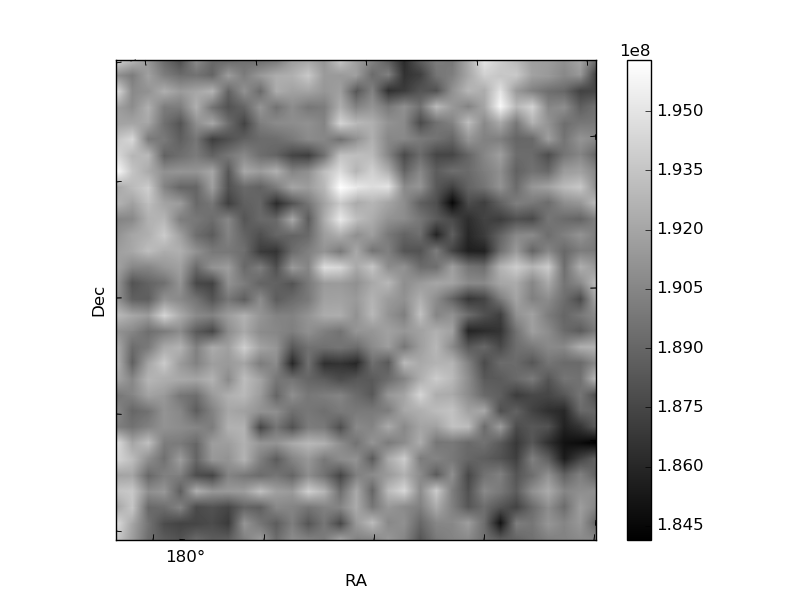
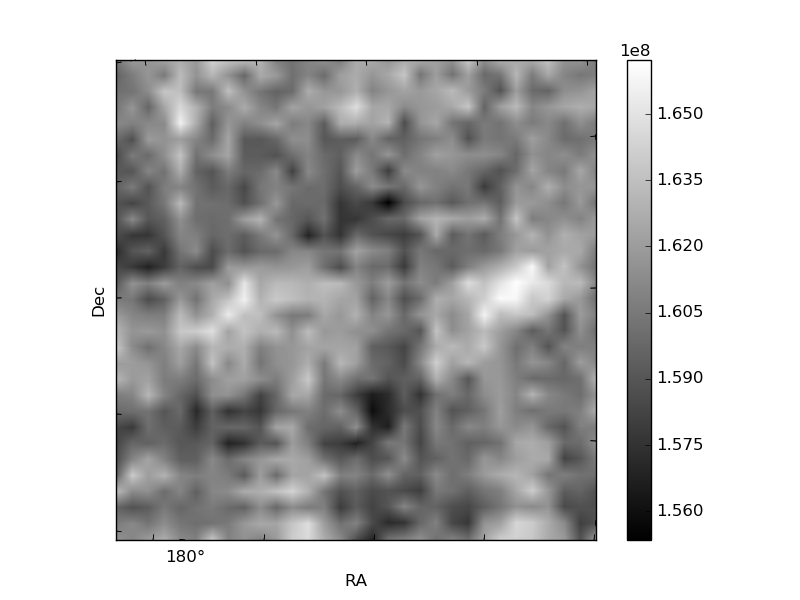
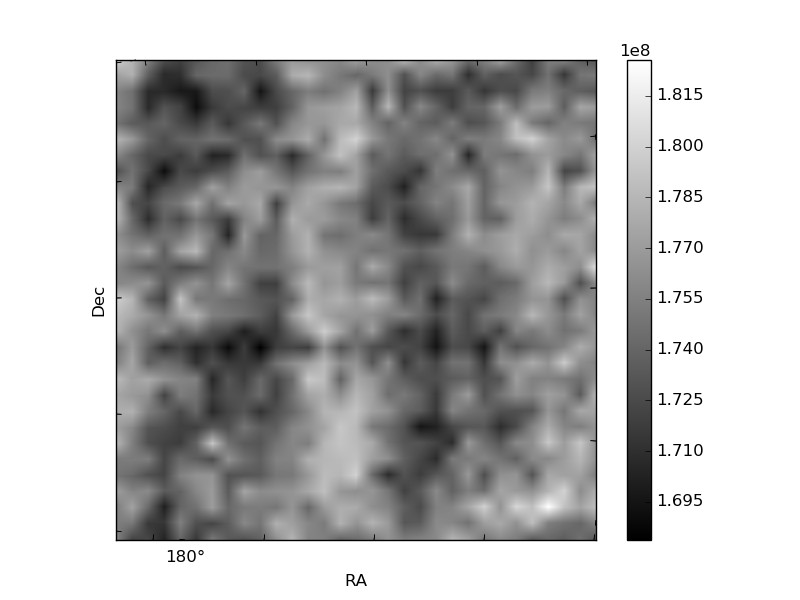
Histogram calculated using DETX and DETY for each event in the final _common_clean file
| Quadrant A | 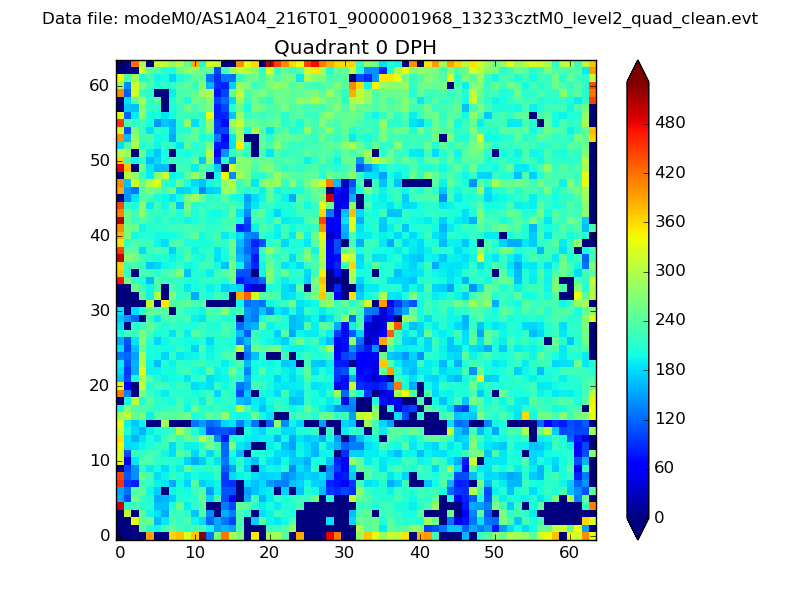 |
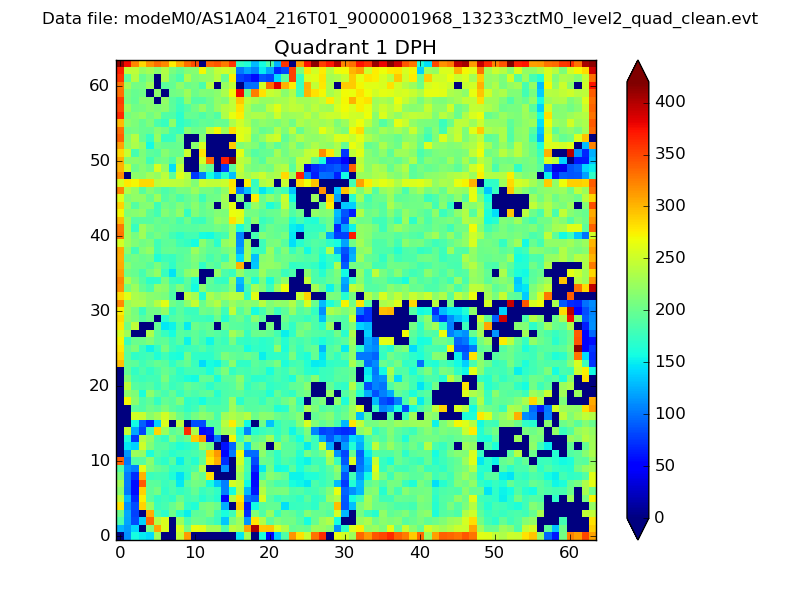 |
Quadrant B |
|---|---|---|---|
| Quadrant D | 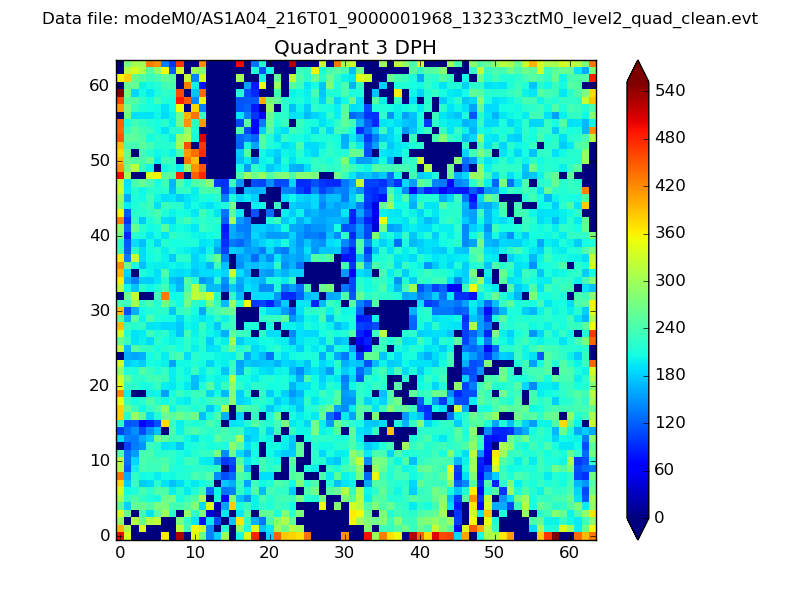 |
 |
Quadrant C |
| Plot type | Count rate plots | Images |
|---|---|---|
| Comparison with Poisson distribution Blue bars denote a histogram of data divided into 1 sec bins. Red curve is a Poisson curve with rate = median count rate of data. |
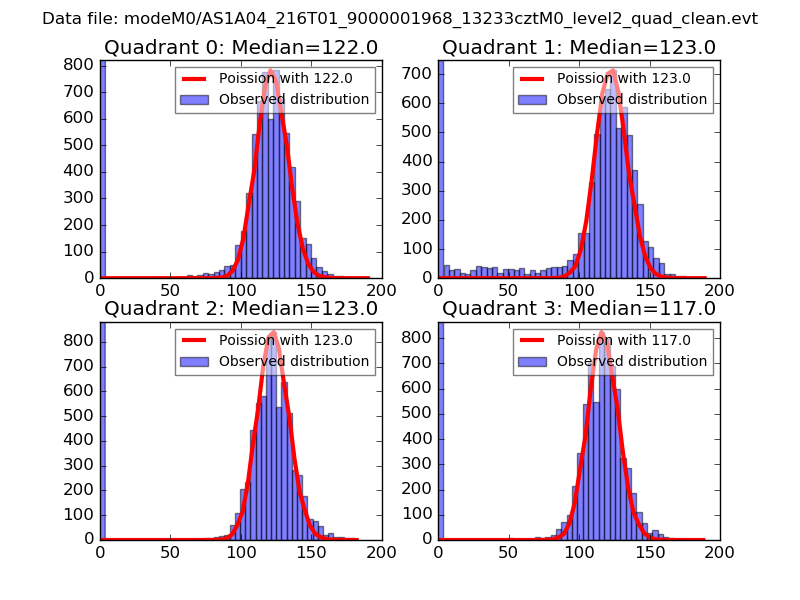 |
 |
| Quadrant-wise count rates Data is divided into 100 sec bins |
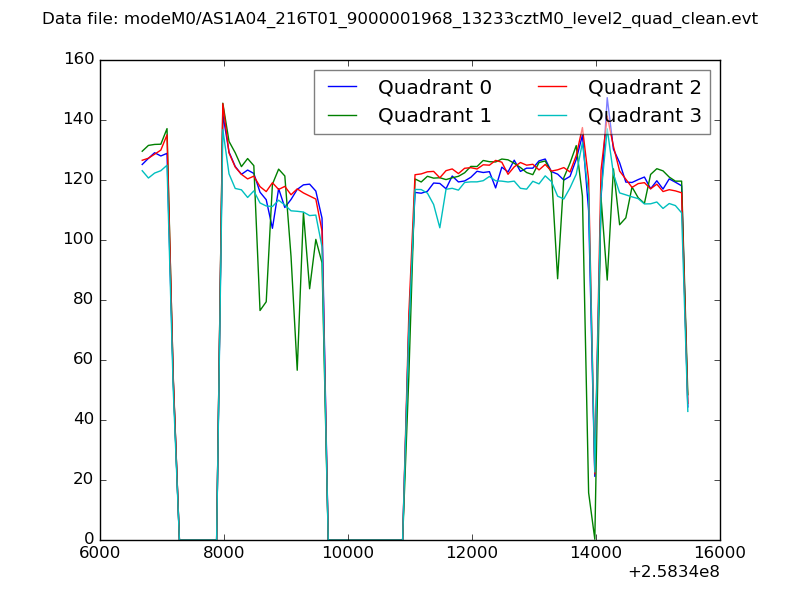 |
|
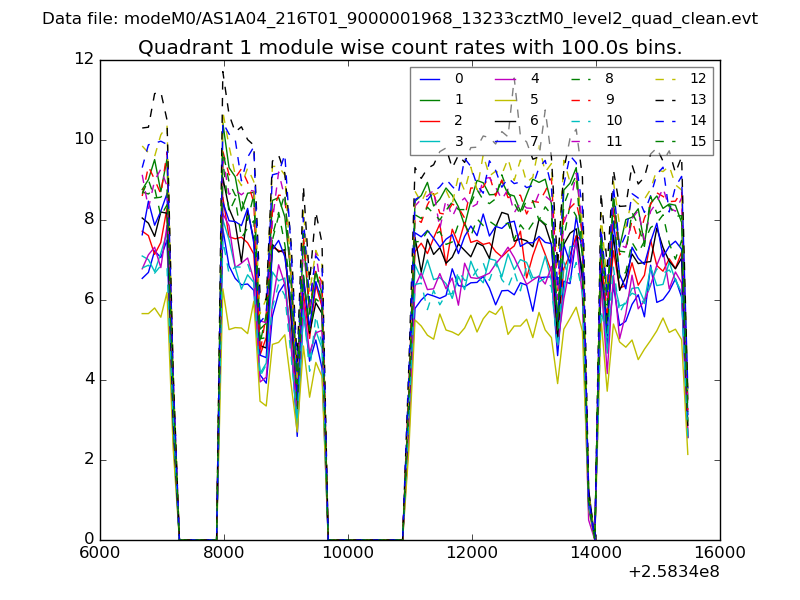
| Module-wise count rates for Quadrant A Data is divided into 100 sec bins |
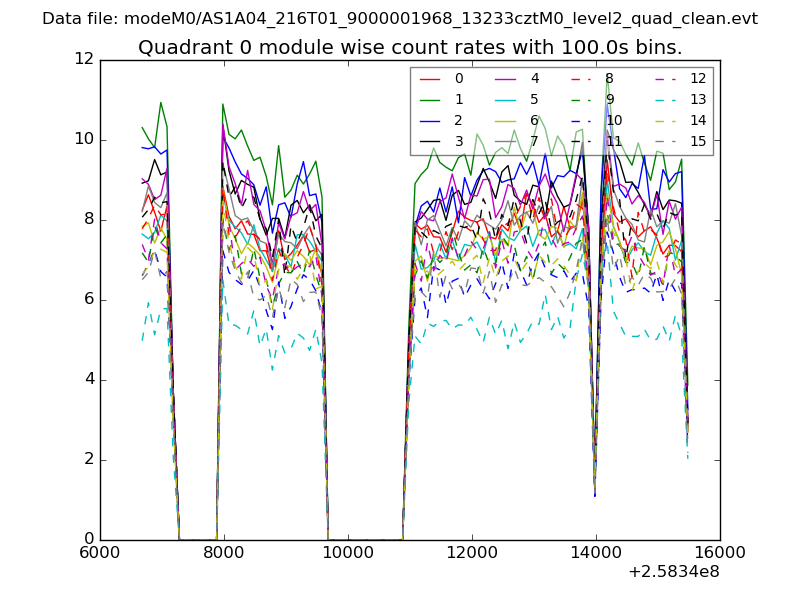 |
 |
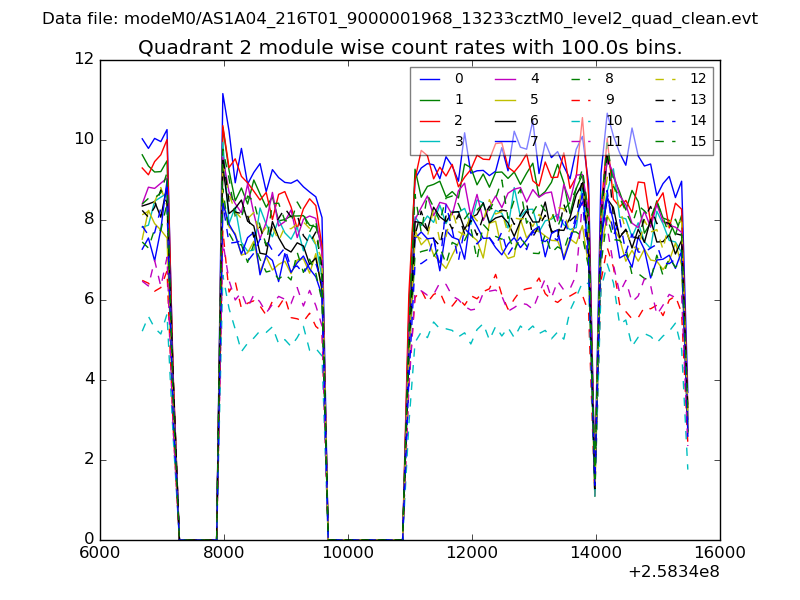
| Module-wise count rates for Quadrant B Data is divided into 100 sec bins |
 |
 |
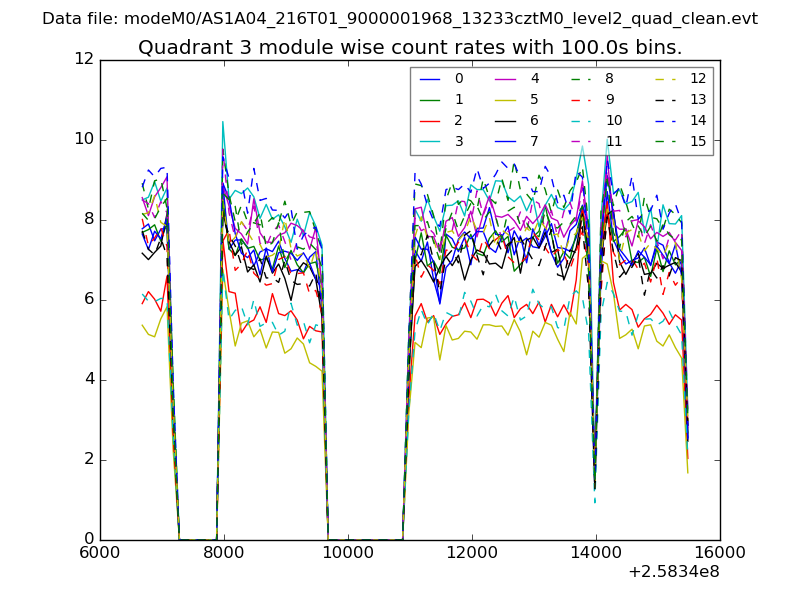
| Module-wise count rates for Quadrant C Data is divided into 100 sec bins |
 |
 |
| Module-wise count rates for Quadrant D Data is divided into 100 sec bins |
 |
 |
| Parameter | Plot |
|---|---|
| CZT HV Monitor | 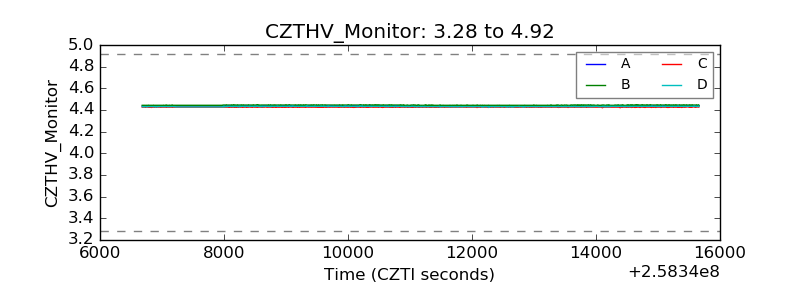 |
| D_VDD | 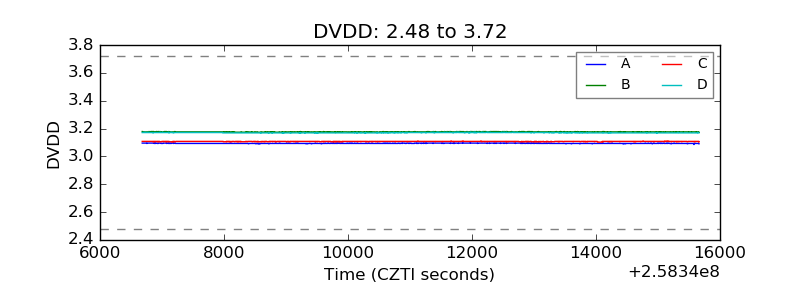 |
| Temperature 1 | 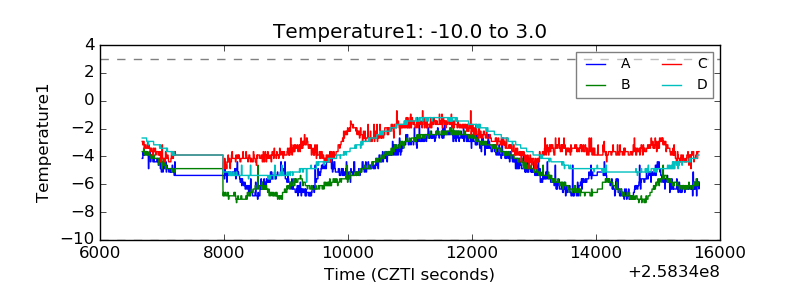 |
| Veto HV Monitor | 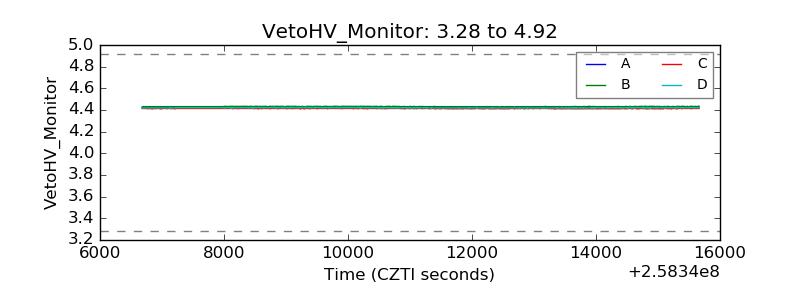 |
| Veto LLD | 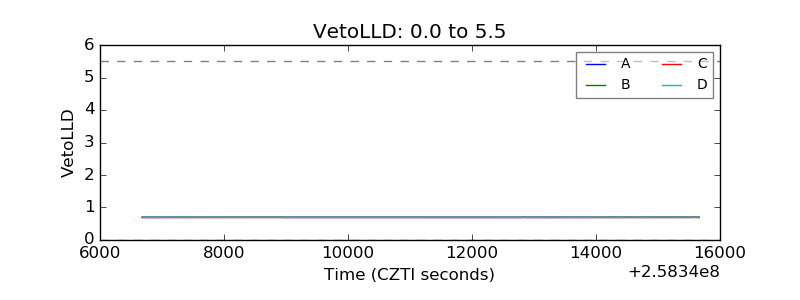 |
| Alpha Counter | 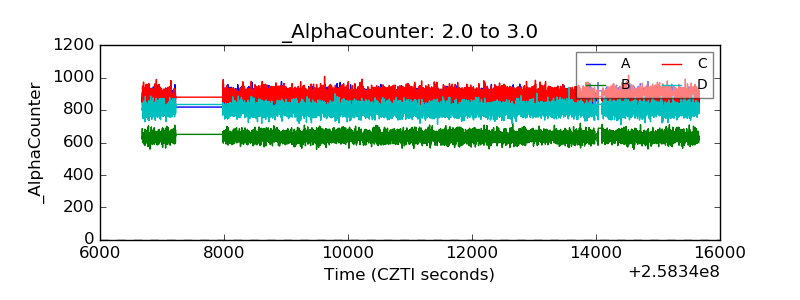 |
| _CPM_Rate | 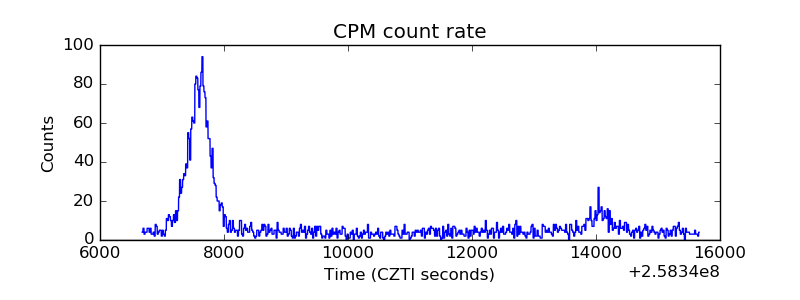 |
| CZT Counter | 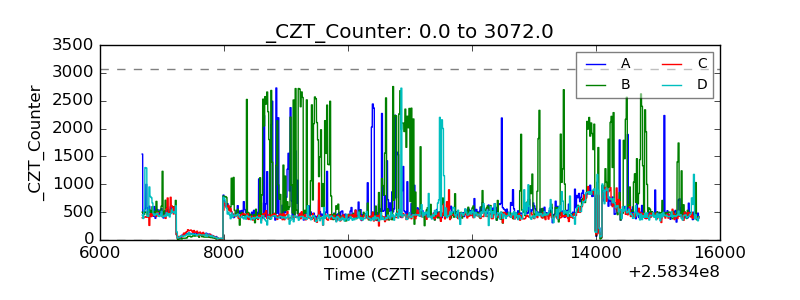 |
| +2.5 Volts monitor |  |
| +5 Volts monitor |  |
| _ROLL_ROT | 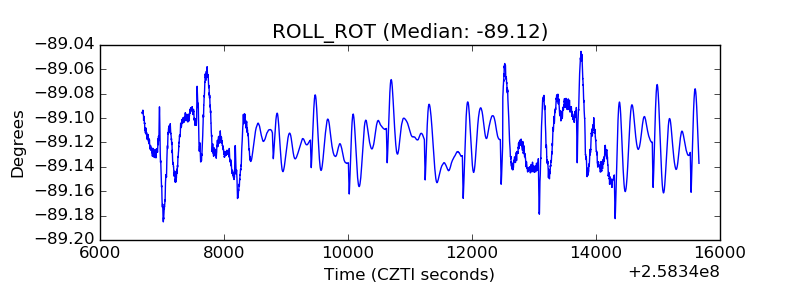 |
| _Roll_DEC |  |
| _Roll_RA | 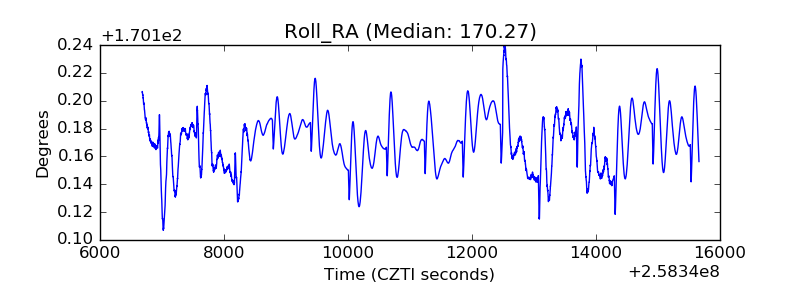 |
| Veto Counter | 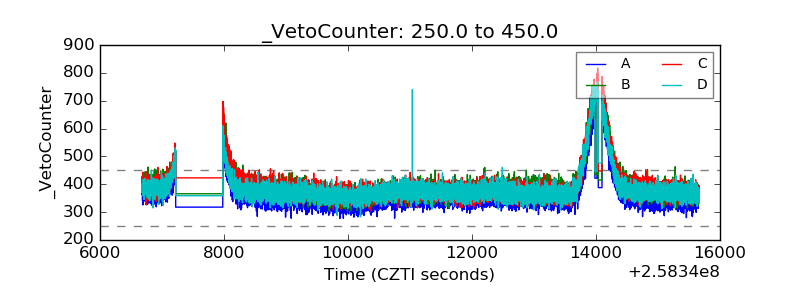 |