| Param | Original file | Final file |
|---|---|---|
| Filename | modeM0/AS1A04_216T01_9000001968_13234cztM0_level2.evt | modeM0/AS1A04_216T01_9000001968_13234cztM0_level2_quad_clean.evt |
| Size (bytes) | 302,256,000 | 53,953,920 |
| Size | 288.3 MB | 51.5 MB |
| Events in quadrant A | 2,174,569 | 337,408 |
| Events in quadrant B | 2,535,713 | 335,795 |
| Events in quadrant C | 1,850,927 | 342,840 |
| Events in quadrant D | 2,305,304 | 320,757 |
| Mode M0 | |||
|---|---|---|---|
| Quadrant | BADHDUFLAG | Total packets | Discarded packets |
| A | 0 | 9211 | 0 |
| B | 0 | 10339 | 0 |
| C | 0 | 8567 | 0 |
| D | 0 | 9791 | 0 |
| Mode SS | |||
|---|---|---|---|
| Quadrant | BADHDUFLAG | Total packets | Discarded packets |
| A | 0 | 84 | 0 |
| B | 0 | 84 | 0 |
| C | 0 | 84 | 0 |
| D | 0 | 84 | 0 |
| Quadrant | Total seconds | Saturated seconds | Saturation percentage |
|---|---|---|---|
| A | 4211 | 17 | 0.403705% |
| B | 4211 | 178 | 4.227024% |
| C | 4211 | 2 | 0.047495% |
| D | 4211 | 112 | 2.659701% |
Noise dominated data is calculated using 1-second bins in cleaned event files. If a bin has >2000 counts, and if more than 50% of those come from <1% of pixels, then it is considered to be noise-dominated and hence unusable.
| Quadrant | # 1 sec bins | Bins with >0 counts | Bins with >2000 counts | High rate bins dominated by noise | Noise dominated (total time) | Noise dominated (detector-on time) | Marked lightcurve |
|---|---|---|---|---|---|---|---|
| A | 4212 | 4212 | 11 | 11 | 0.26% | 0.26% | 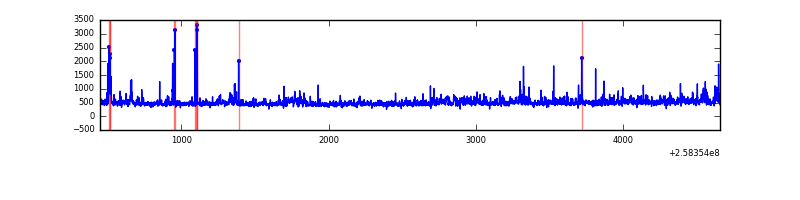 |
| B | 4212 | 4212 | 104 | 104 | 2.47% | 2.47% | 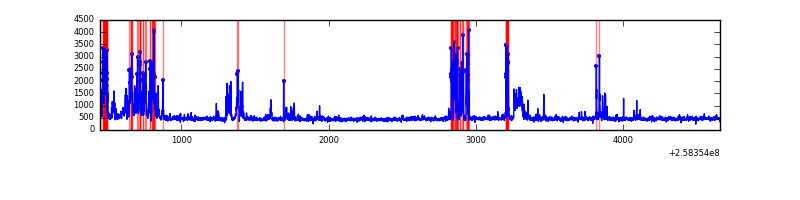 |
| C | 4212 | 4212 | 1 | 1 | 0.02% | 0.02% | 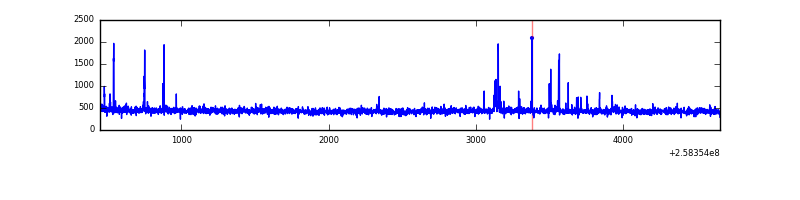 |
| D | 4212 | 4212 | 102 | 102 | 2.42% | 2.42% | 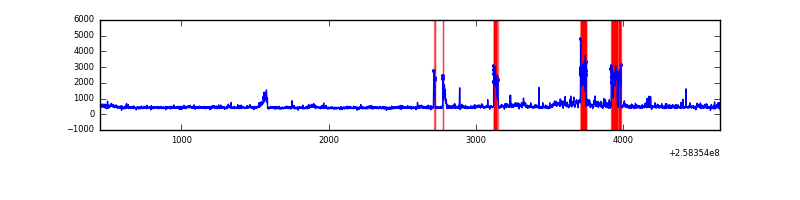 |
Top three noisy pixels from each quadrant. If the there are fewer than three noisy pixels in the level2.evt file, extra rows are filled as -1
| Pixel properties | Quadrant properties | ||||||
|---|---|---|---|---|---|---|---|
| Quadrant | DetID | PixID | Counts | Sigma | Mean | Median | Sigma |
| A | 15 | 239 | 244127 | 2537.94 | 467 | 455 | 96.0 |
| A | 12 | 189 | 58788 | 607.56 | 467 | 455 | 96.0 |
| A | 12 | 96 | 44940 | 463.33 | 467 | 455 | 96.0 |
| B | 4 | 239 | 637020 | 7158.31 | 459 | 447 | 88.9 |
| B | 0 | 230 | 46160 | 514.05 | 459 | 447 | 88.9 |
| B | 0 | 214 | 23299 | 256.97 | 459 | 447 | 88.9 |
| C | 15 | 208 | 58406 | 539.97 | 459 | 460 | 107.3 |
| C | 13 | 61 | 3403 | 27.42 | 459 | 460 | 107.3 |
| C | 14 | 234 | 1659 | 11.17 | 459 | 460 | 107.3 |
| D | 1 | 52 | 453240 | 4115.9 | 450 | 436 | 110.0 |
| D | 8 | 195 | 108310 | 980.55 | 450 | 436 | 110.0 |
| D | 14 | 34 | 21656 | 192.89 | 450 | 436 | 110.0 |
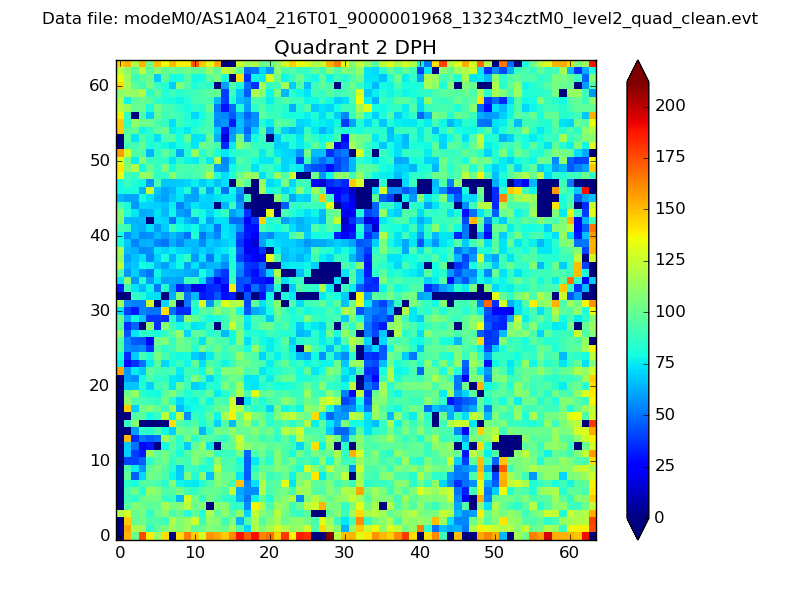
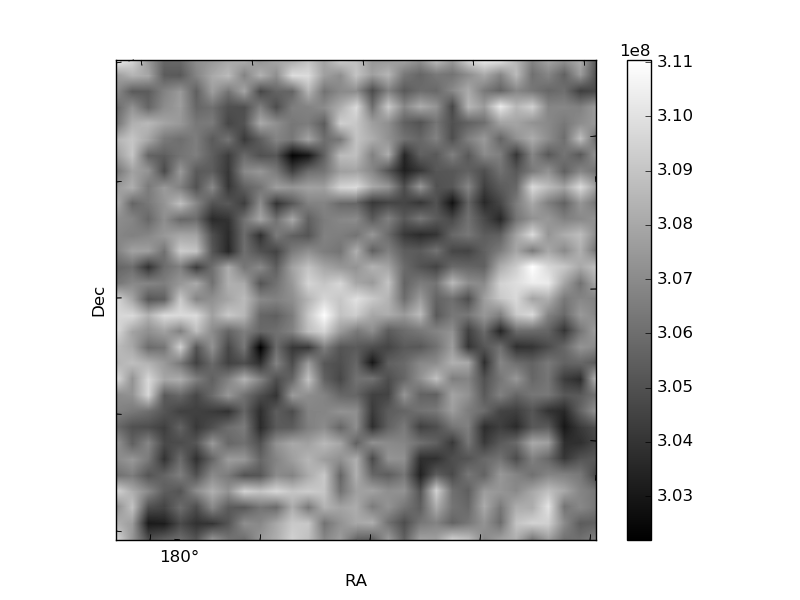
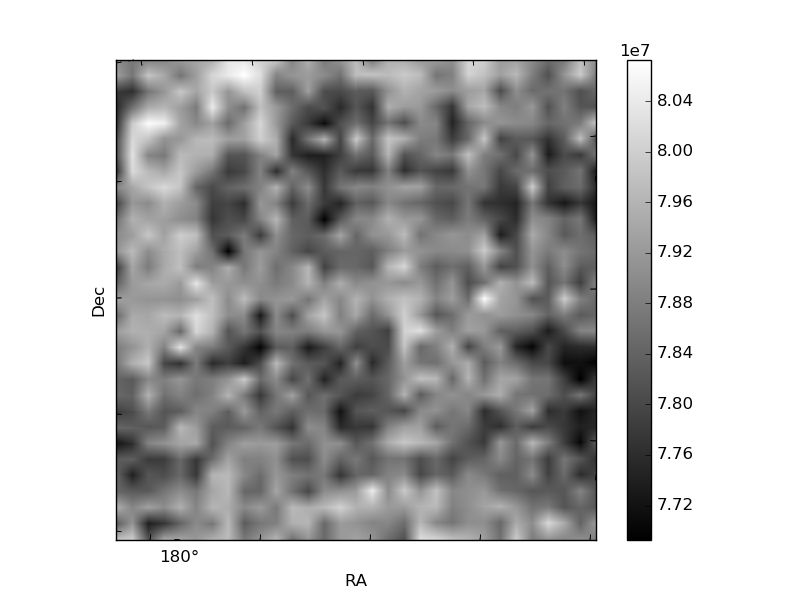
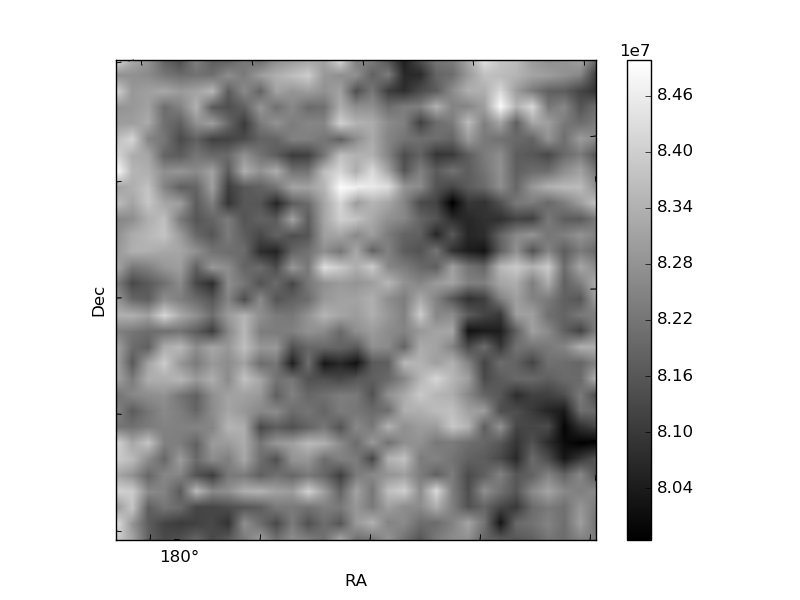
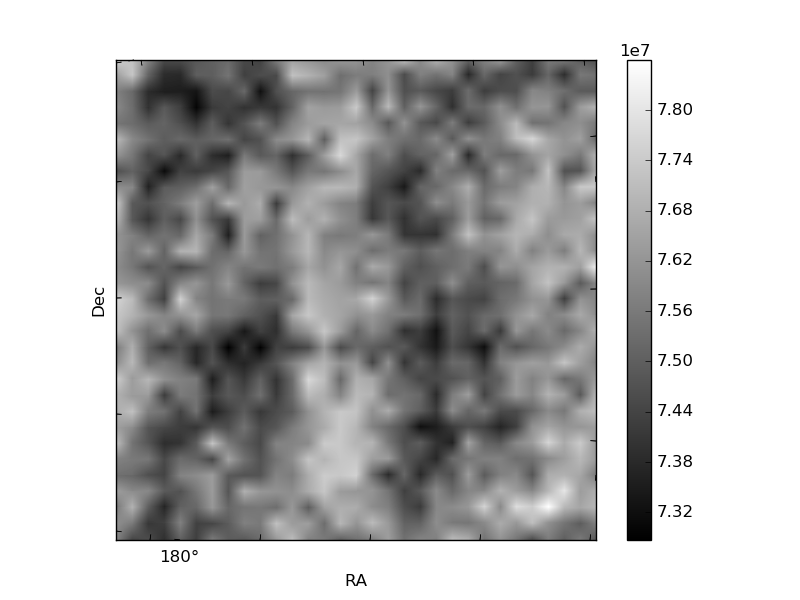
Histogram calculated using DETX and DETY for each event in the final _common_clean file
| Quadrant A | 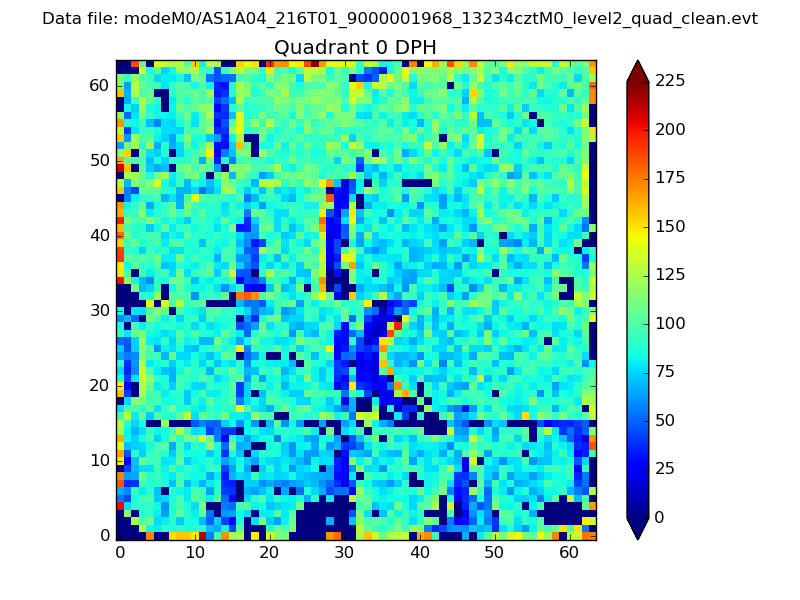 |
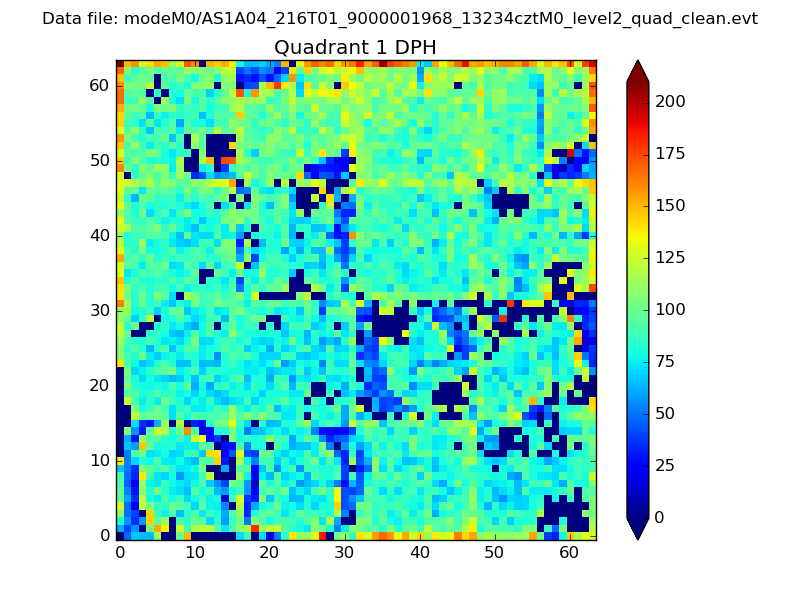 |
Quadrant B |
|---|---|---|---|
| Quadrant D | 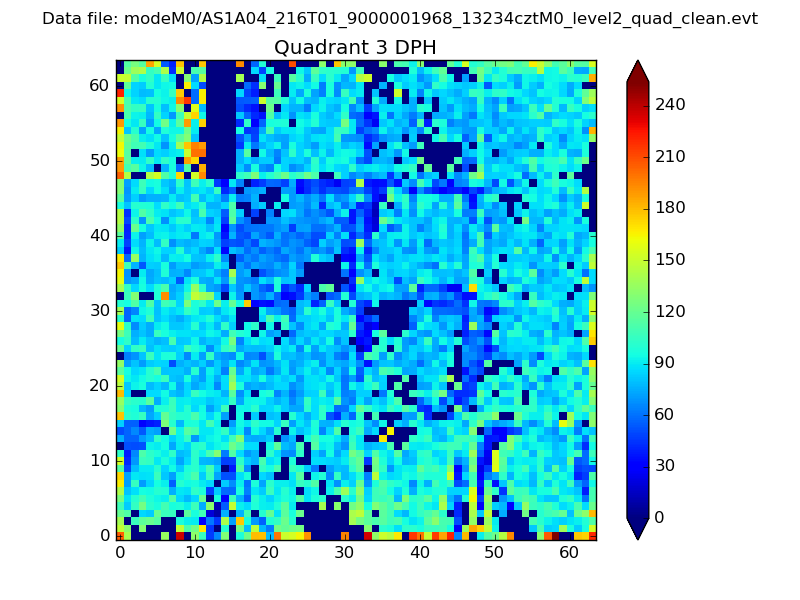 |
 |
Quadrant C |
| Plot type | Count rate plots | Images |
|---|---|---|
| Comparison with Poisson distribution Blue bars denote a histogram of data divided into 1 sec bins. Red curve is a Poisson curve with rate = median count rate of data. |
 |
 |
| Quadrant-wise count rates Data is divided into 100 sec bins |
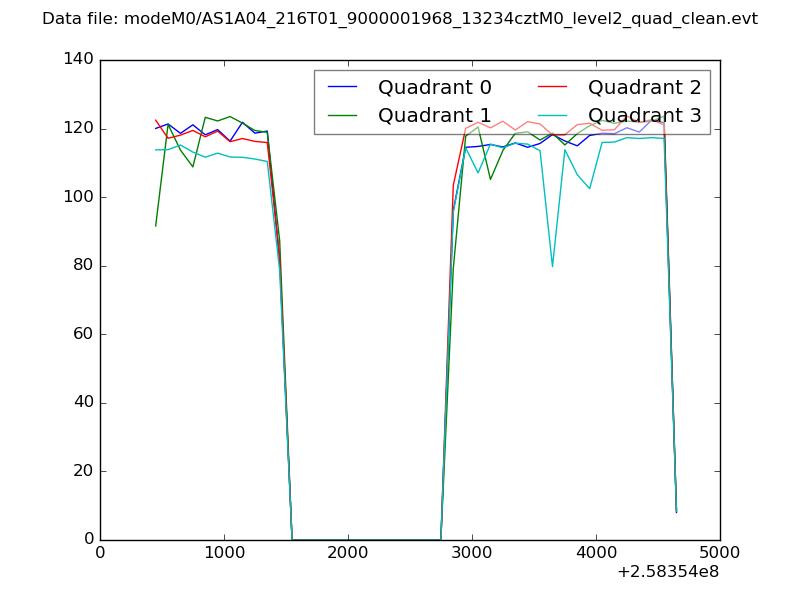 |
|
| Module-wise count rates for Quadrant A Data is divided into 100 sec bins |
 |
 |
| Module-wise count rates for Quadrant B Data is divided into 100 sec bins |
 |
 |
| Module-wise count rates for Quadrant C Data is divided into 100 sec bins |
 |
 |
| Module-wise count rates for Quadrant D Data is divided into 100 sec bins |
 |
 |
| Parameter | Plot |
|---|---|
| CZT HV Monitor | 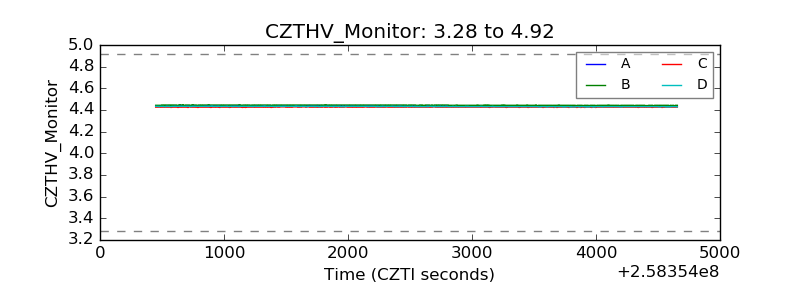 |
| D_VDD | 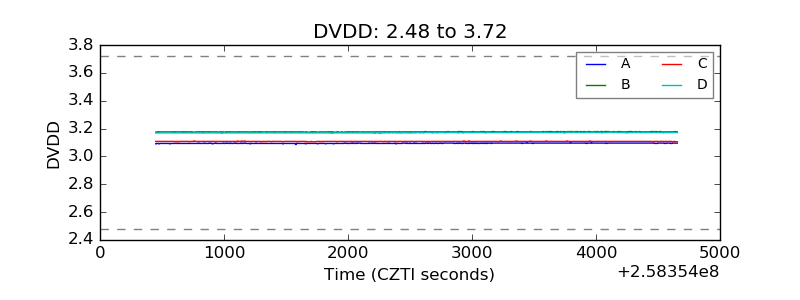 |
| Temperature 1 |  |
| Veto HV Monitor | 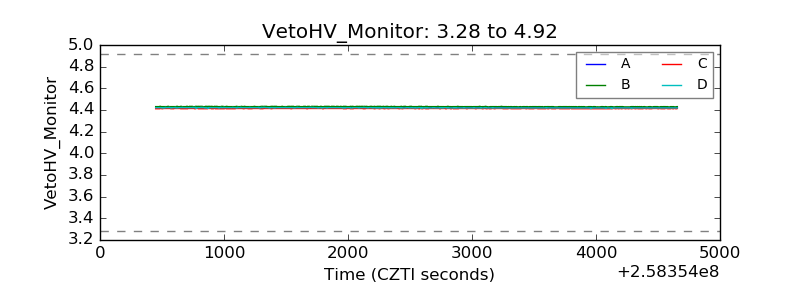 |
| Veto LLD | 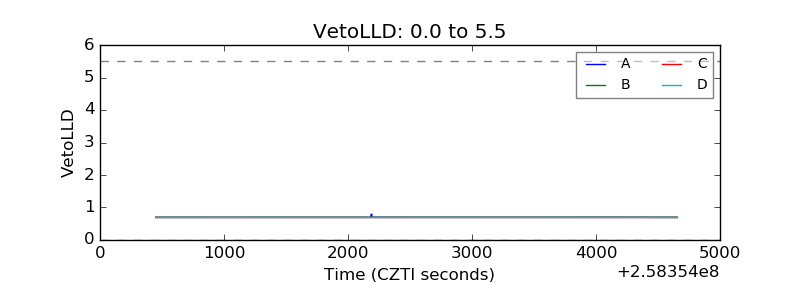 |
| Alpha Counter | 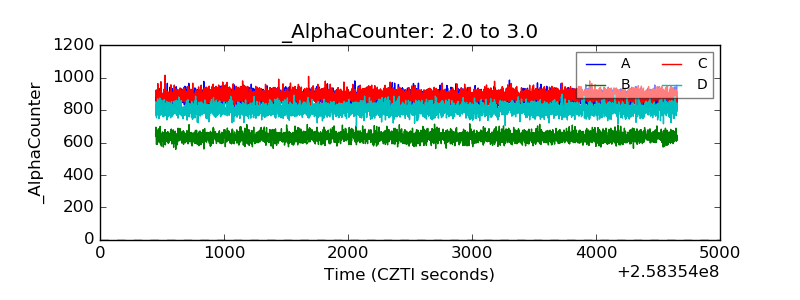 |
| _CPM_Rate | 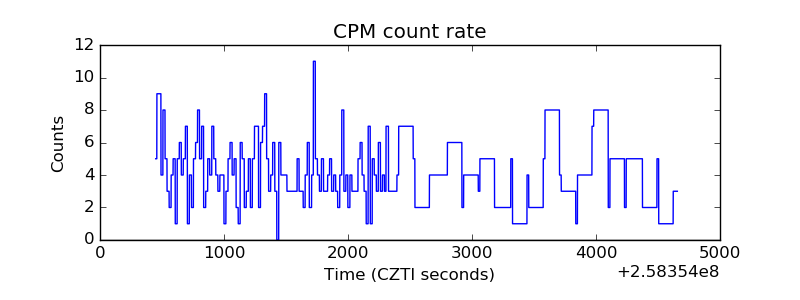 |
| CZT Counter | 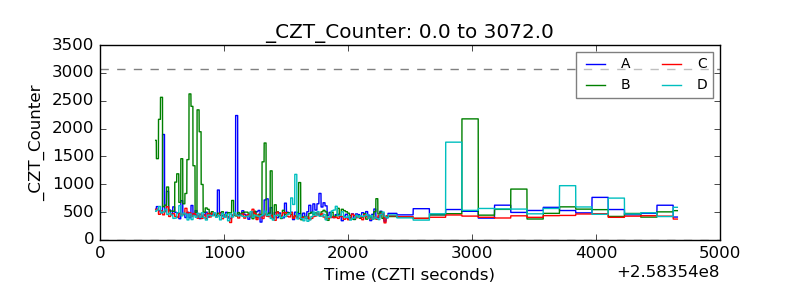 |
| +2.5 Volts monitor |  |
| +5 Volts monitor |  |
| _ROLL_ROT |  |
| _Roll_DEC |  |
| _Roll_RA | 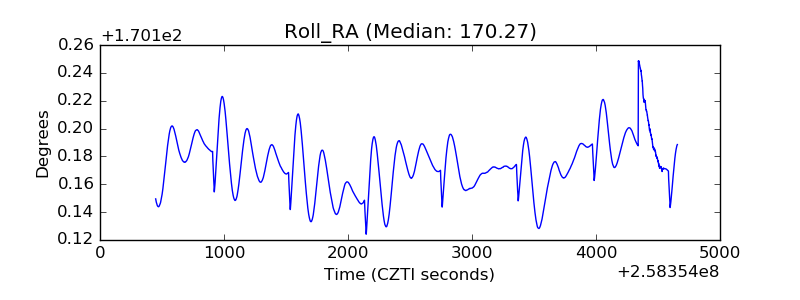 |
| Veto Counter | 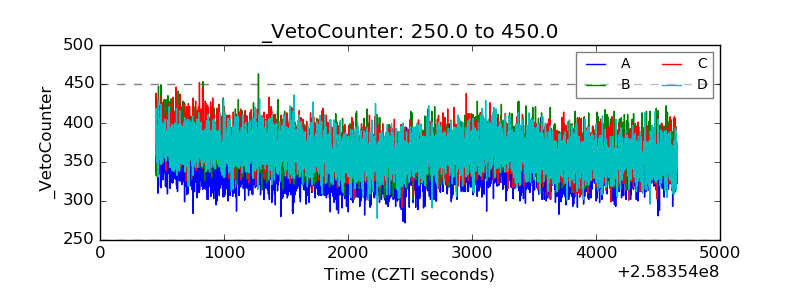 |