| Param | Original file | Final file |
|---|---|---|
| Filename | modeM0/AS1G08_077T01_9000001970_13234cztM0_level2.evt | modeM0/AS1G08_077T01_9000001970_13234cztM0_level2_quad_clean.evt |
| Size (bytes) | 198,979,200 | 24,105,600 |
| Size | 189.8 MB | 23.0 MB |
| Events in quadrant A | 993,306 | 164,537 |
| Events in quadrant B | 3,088,153 | 82,610 |
| Events in quadrant C | 893,769 | 174,129 |
| Events in quadrant D | 917,408 | 167,400 |
| Mode SS | |||
|---|---|---|---|
| Quadrant | BADHDUFLAG | Total packets | Discarded packets |
| A | 0 | 38 | 0 |
| B | 0 | 38 | 0 |
| C | 0 | 38 | 0 |
| D | 0 | 38 | 0 |
| Mode M0 | |||
|---|---|---|---|
| Quadrant | BADHDUFLAG | Total packets | Discarded packets |
| A | 0 | 4346 | 2 |
| B | 0 | 10505 | 1 |
| C | 0 | 4142 | 1 |
| D | 0 | 4238 | 1 |
| Quadrant | Total seconds | Saturated seconds | Saturation percentage |
|---|---|---|---|
| A | 1927 | 148 | 7.680332% |
| B | 1927 | 1124 | 58.329009% |
| C | 1927 | 62 | 3.217436% |
| D | 1927 | 58 | 3.009860% |
Noise dominated data is calculated using 1-second bins in cleaned event files. If a bin has >2000 counts, and if more than 50% of those come from <1% of pixels, then it is considered to be noise-dominated and hence unusable.
| Quadrant | # 1 sec bins | Bins with >0 counts | Bins with >2000 counts | High rate bins dominated by noise | Noise dominated (total time) | Noise dominated (detector-on time) | Marked lightcurve |
|---|---|---|---|---|---|---|---|
| A | 1978 | 1929 | 0 | 0 | 0.00% | 0.00% | 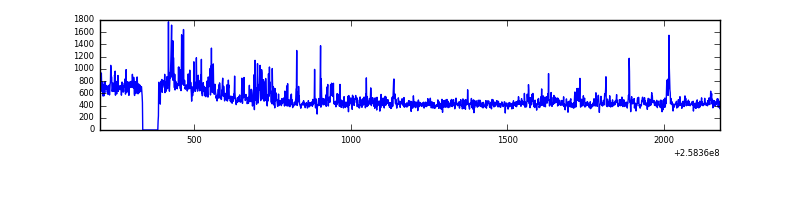 |
| B | 1977 | 1927 | 849 | 849 | 42.94% | 44.06% | 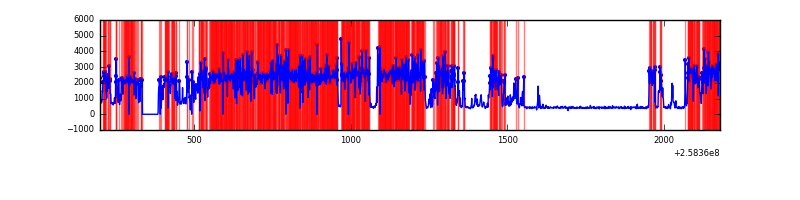 |
| C | 1978 | 1929 | 0 | 0 | 0.00% | 0.00% | 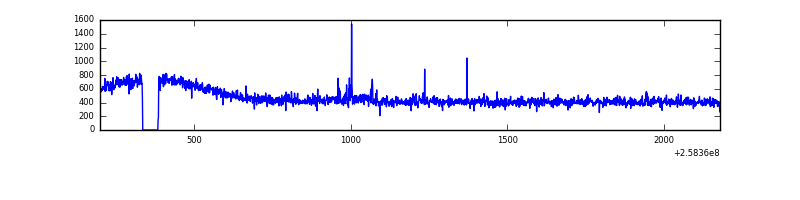 |
| D | 1978 | 1929 | 7 | 7 | 0.35% | 0.36% | 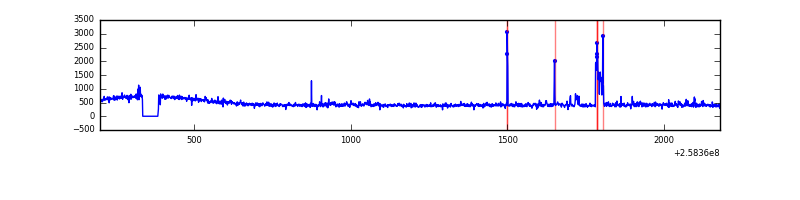 |
Top three noisy pixels from each quadrant. If the there are fewer than three noisy pixels in the level2.evt file, extra rows are filled as -1
| Pixel properties | Quadrant properties | ||||||
|---|---|---|---|---|---|---|---|
| Quadrant | DetID | PixID | Counts | Sigma | Mean | Median | Sigma |
| A | 15 | 239 | 85343 | 1738.29 | 229 | 223 | 49.0 |
| A | 12 | 189 | 9787 | 195.31 | 229 | 223 | 49.0 |
| A | 1 | 162 | 7205 | 142.58 | 229 | 223 | 49.0 |
| B | 4 | 239 | 2568641 | 94018.62 | 130 | 126 | 27.3 |
| B | 0 | 214 | 6615 | 237.53 | 130 | 126 | 27.3 |
| B | 12 | 111 | 3002 | 105.27 | 130 | 126 | 27.3 |
| C | 15 | 208 | 12271 | 225.06 | 224 | 223 | 53.5 |
| C | 8 | 128 | 3343 | 58.28 | 224 | 223 | 53.5 |
| C | 8 | 112 | 1743 | 28.39 | 224 | 223 | 53.5 |
| D | 1 | 52 | 47772 | 862.08 | 222 | 215 | 55.2 |
| D | 8 | 195 | 30946 | 557.07 | 222 | 215 | 55.2 |
| D | 2 | 234 | 6860 | 120.46 | 222 | 215 | 55.2 |
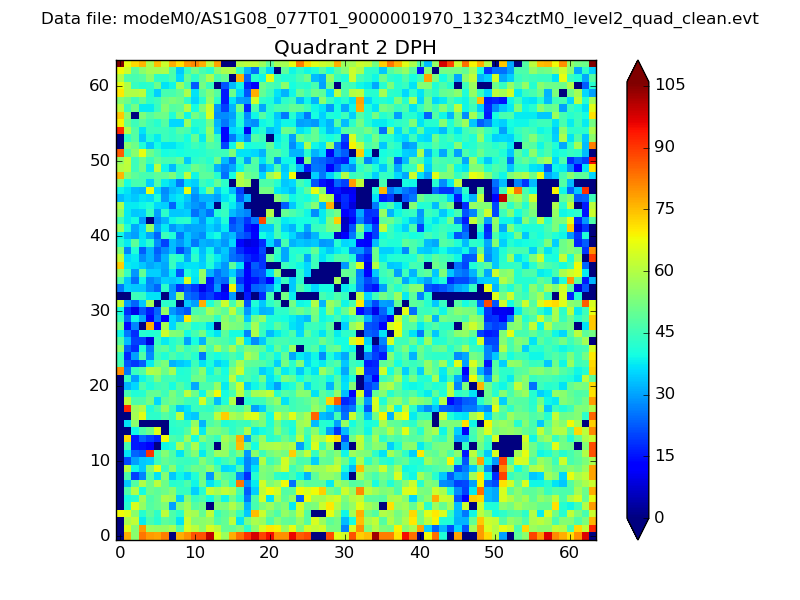
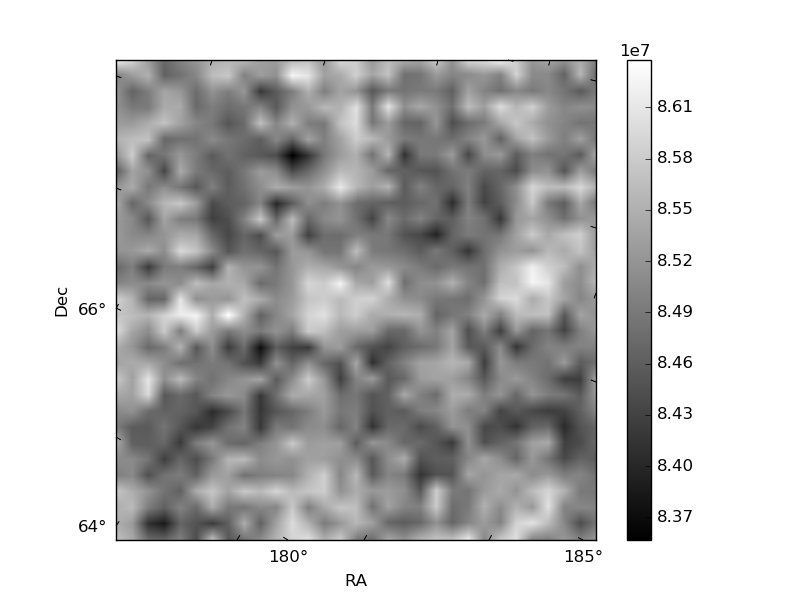
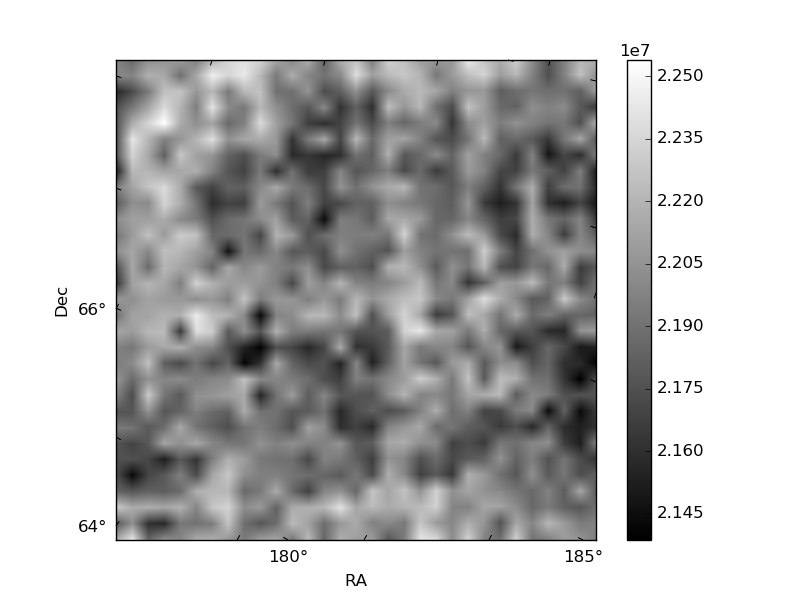
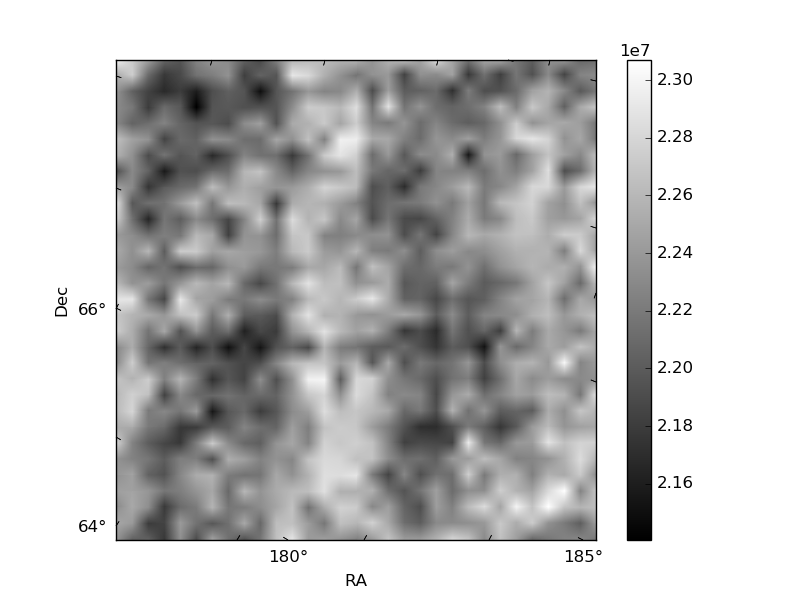
Histogram calculated using DETX and DETY for each event in the final _common_clean file
| Quadrant A | 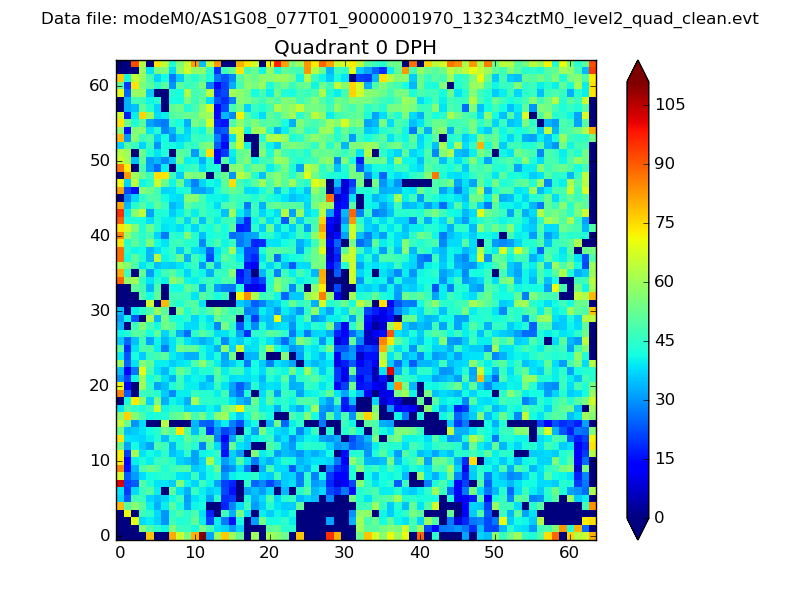 |
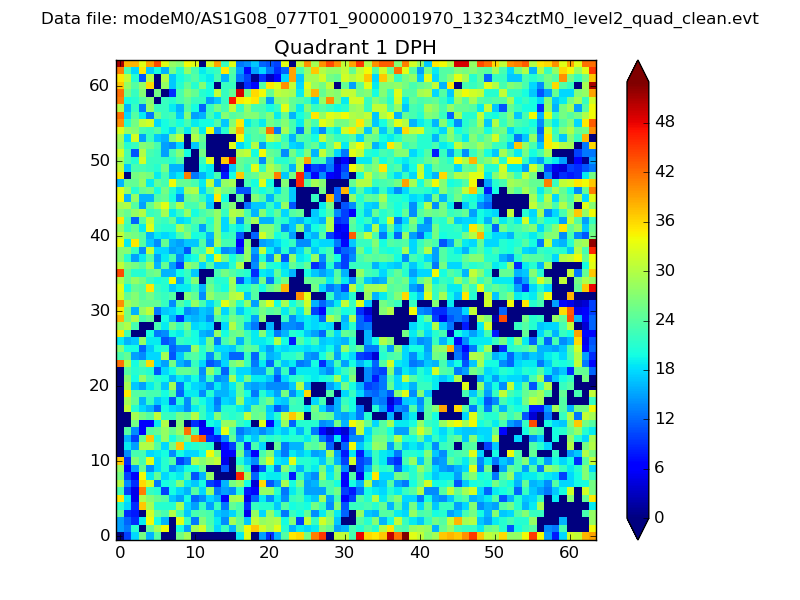 |
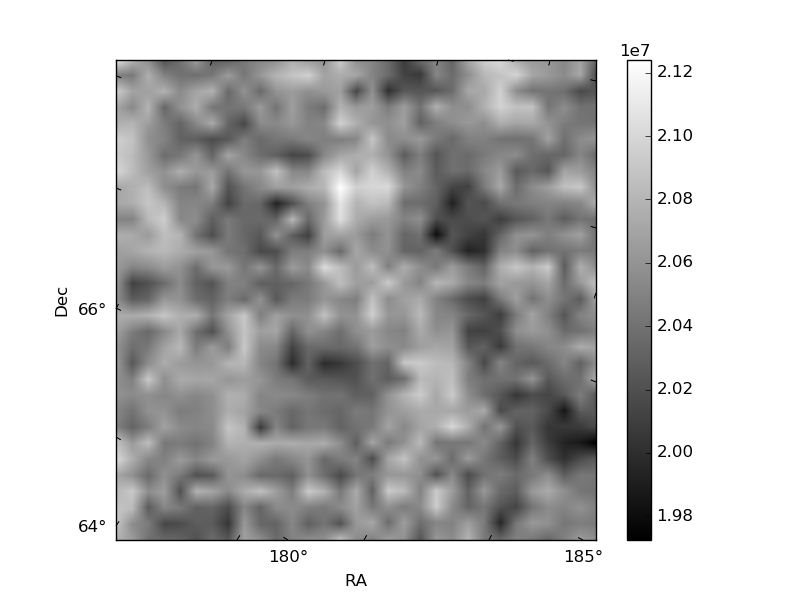
Quadrant B |
|---|---|---|---|
| Quadrant D | 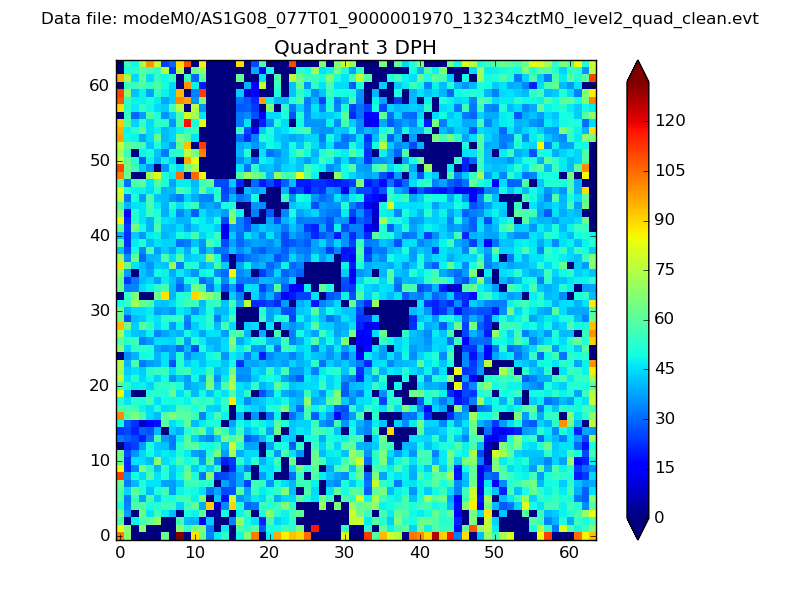 |
 |
Quadrant C |
| Plot type | Count rate plots | Images |
|---|---|---|
| Comparison with Poisson distribution Blue bars denote a histogram of data divided into 1 sec bins. Red curve is a Poisson curve with rate = median count rate of data. |
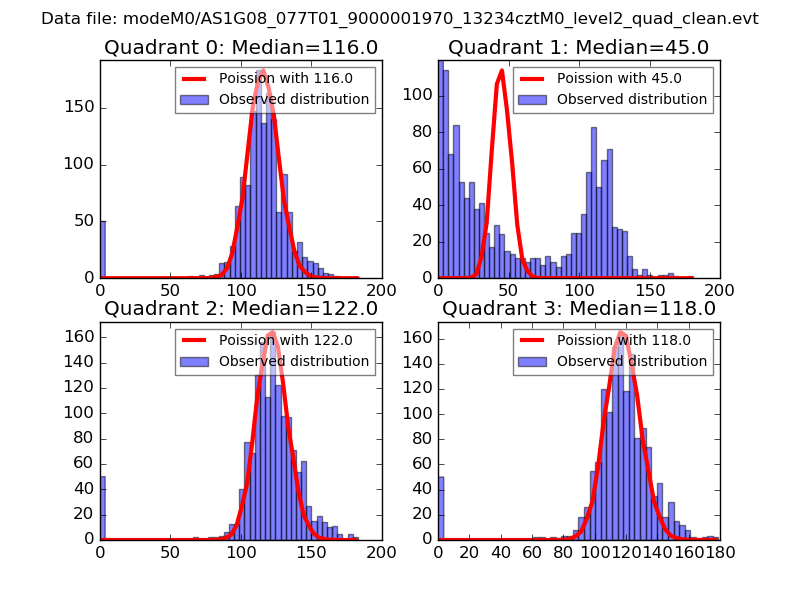 |
 |
| Quadrant-wise count rates Data is divided into 100 sec bins |
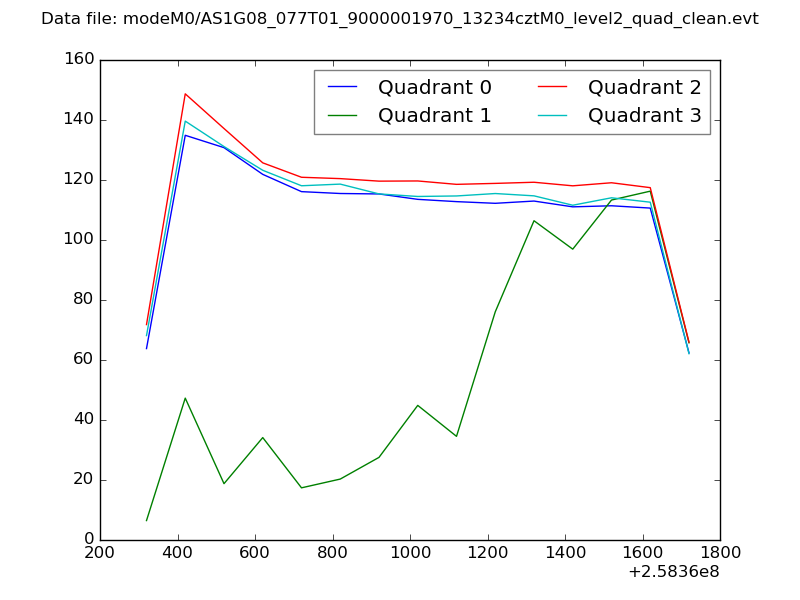 |
|
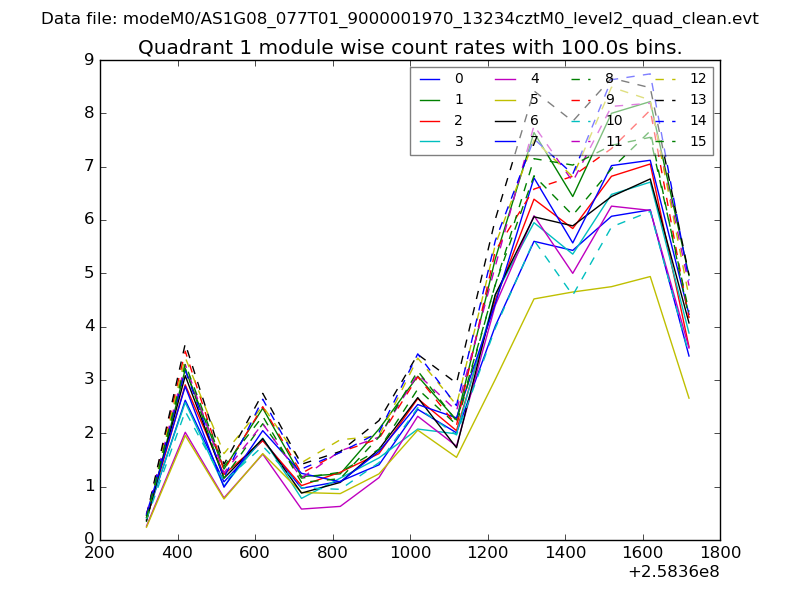
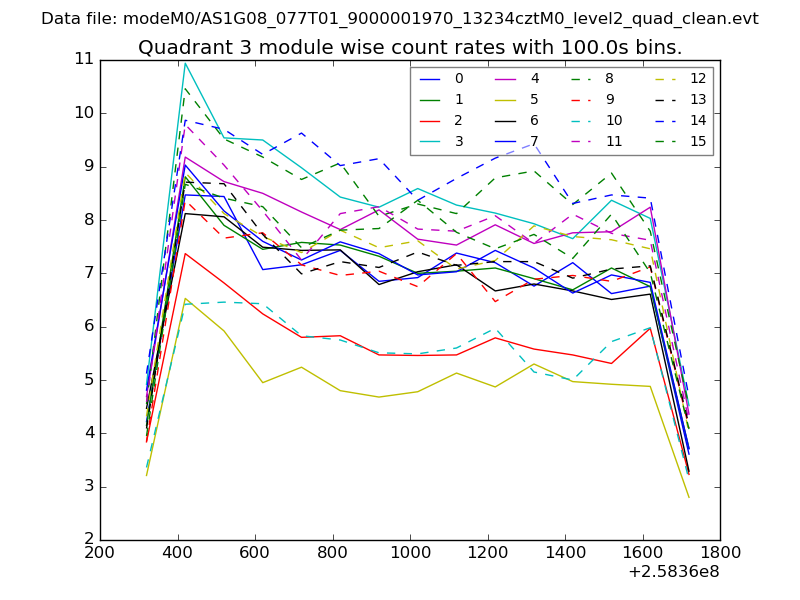
| Module-wise count rates for Quadrant A Data is divided into 100 sec bins |
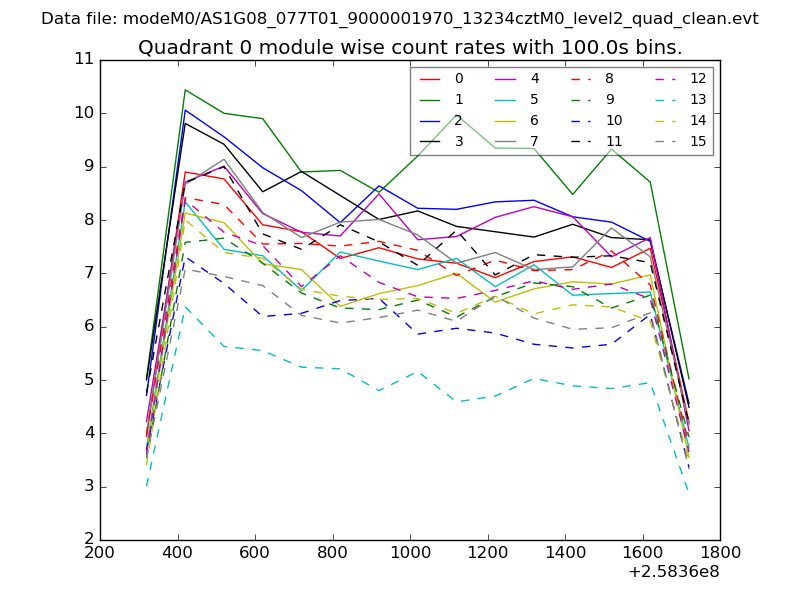 |
 |
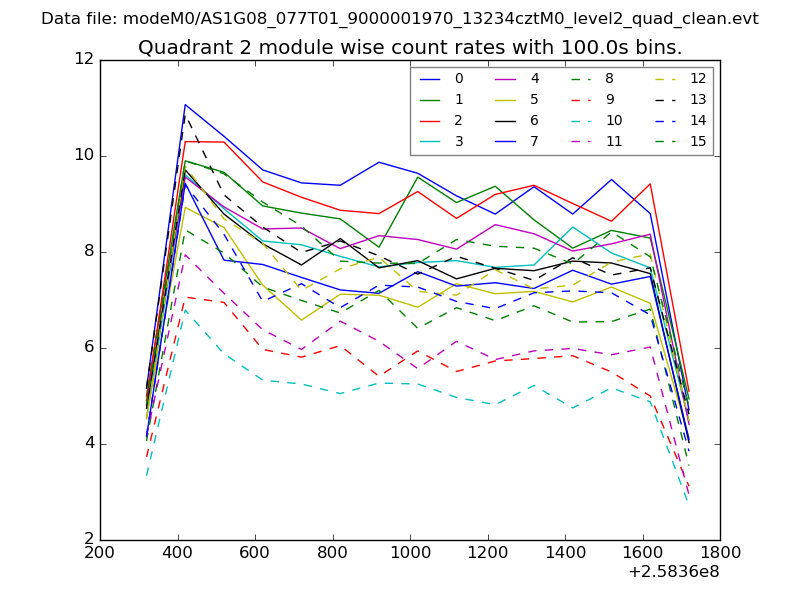
| Module-wise count rates for Quadrant B Data is divided into 100 sec bins |
 |
 |
| Module-wise count rates for Quadrant C Data is divided into 100 sec bins |
 |
 |
| Module-wise count rates for Quadrant D Data is divided into 100 sec bins |
 |
 |
| Parameter | Plot |
|---|---|
| CZT HV Monitor | 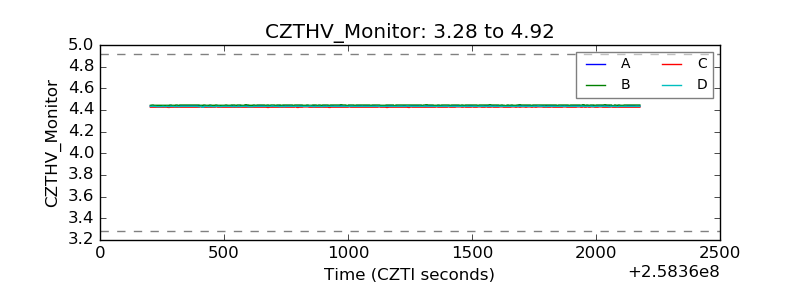 |
| D_VDD | 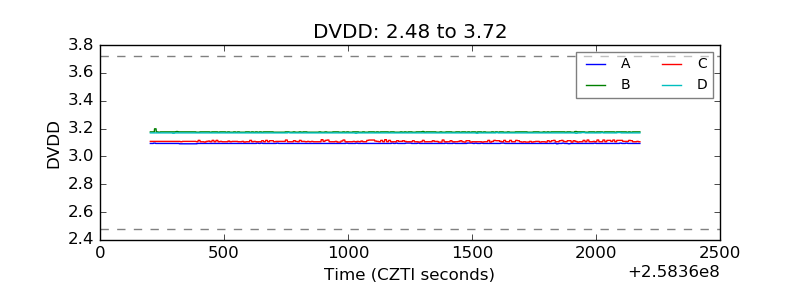 |
| Temperature 1 | 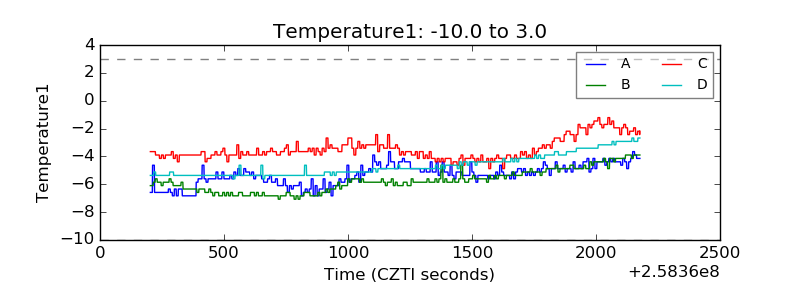 |
| Veto HV Monitor | 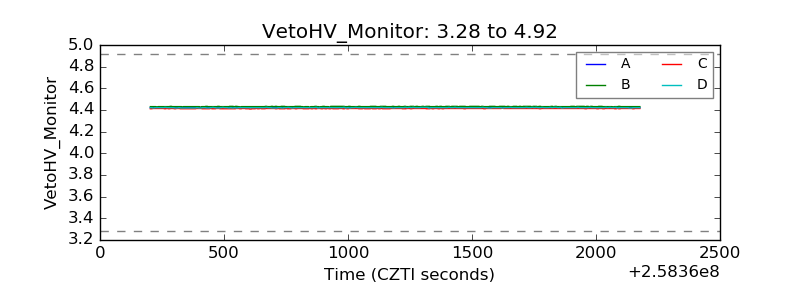 |
| Veto LLD |  |
| Alpha Counter |  |
| _CPM_Rate | 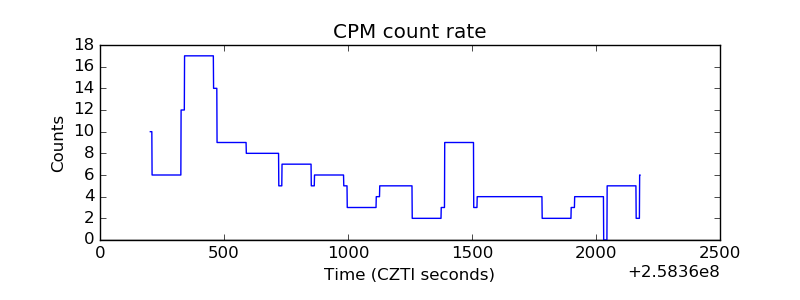 |
| CZT Counter | 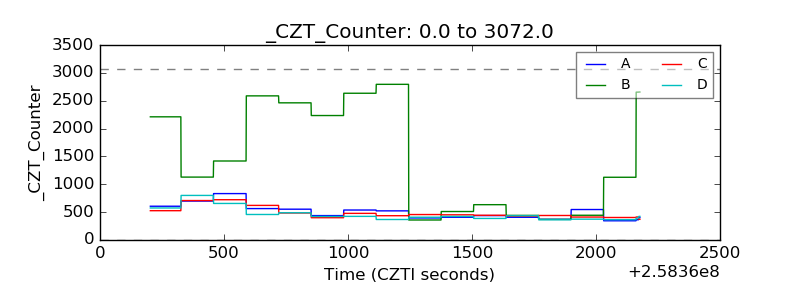 |
| +2.5 Volts monitor |  |
| +5 Volts monitor | 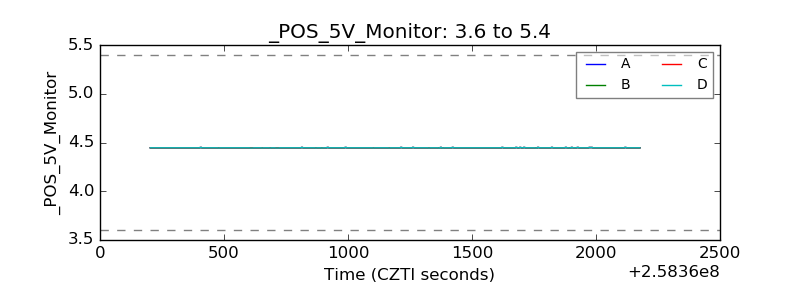 |
| _ROLL_ROT | 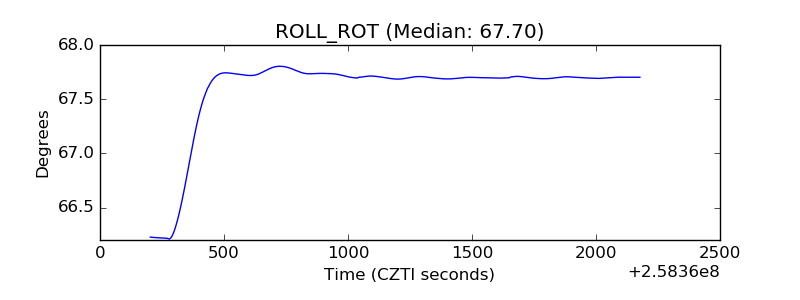 |
| _Roll_DEC | 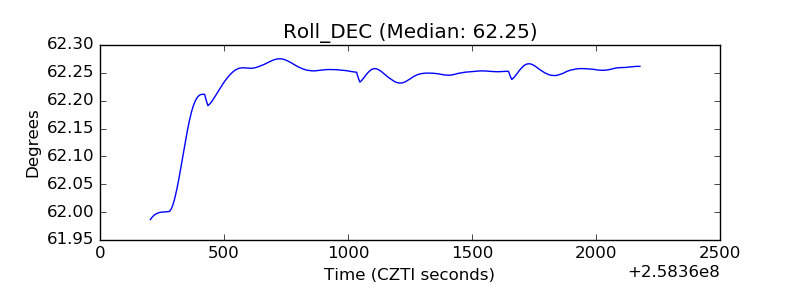 |
| _Roll_RA | 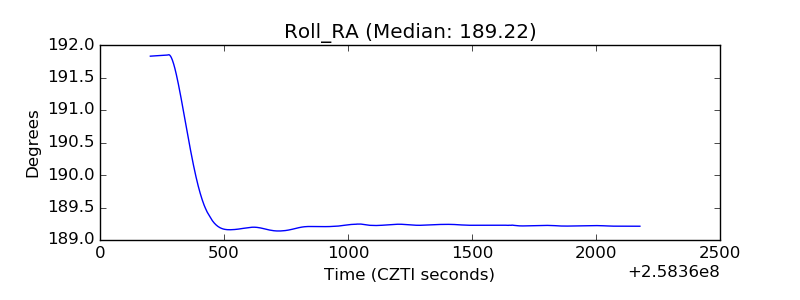 |
| Veto Counter | 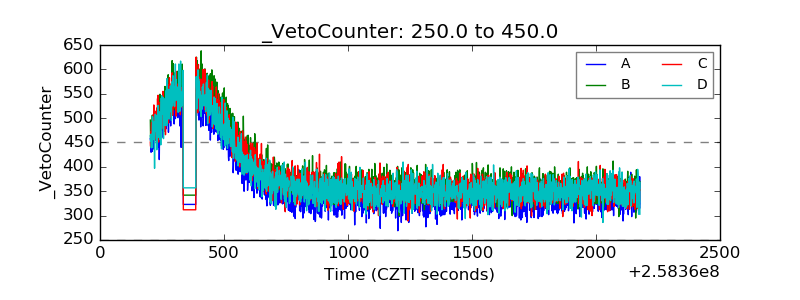 |