| Param | Original file | Final file |
|---|---|---|
| Filename | modeM0/AS1G08_077T01_9000001970_13235cztM0_level2.evt | modeM0/AS1G08_077T01_9000001970_13235cztM0_level2_quad_clean.evt |
| Size (bytes) | 641,148,480 | 86,466,240 |
| Size | 611.4 MB | 82.5 MB |
| Events in quadrant A | 3,844,652 | 551,957 |
| Events in quadrant B | 8,350,364 | 445,501 |
| Events in quadrant C | 3,221,724 | 571,187 |
| Events in quadrant D | 3,510,673 | 546,607 |
| Mode M9 | |||
|---|---|---|---|
| Quadrant | BADHDUFLAG | Total packets | Discarded packets |
| A | 0 | 2 | 0 |
| B | 0 | 2 | 0 |
| C | 0 | 2 | 0 |
| D | 0 | 2 | 0 |
| Mode SS | |||
|---|---|---|---|
| Quadrant | BADHDUFLAG | Total packets | Discarded packets |
| A | 0 | 146 | 0 |
| B | 0 | 146 | 0 |
| C | 0 | 146 | 0 |
| D | 0 | 146 | 0 |
| Mode M0 | |||
|---|---|---|---|
| Quadrant | BADHDUFLAG | Total packets | Discarded packets |
| A | 0 | 16168 | 2 |
| B | 0 | 29657 | 1 |
| C | 0 | 14792 | 1 |
| D | 0 | 15633 | 1 |
| Quadrant | Total seconds | Saturated seconds | Saturation percentage |
|---|---|---|---|
| A | 7216 | 222 | 3.076497% |
| B | 7216 | 2355 | 32.635809% |
| C | 7216 | 117 | 1.621397% |
| D | 7216 | 145 | 2.009424% |
Noise dominated data is calculated using 1-second bins in cleaned event files. If a bin has >2000 counts, and if more than 50% of those come from <1% of pixels, then it is considered to be noise-dominated and hence unusable.
| Quadrant | # 1 sec bins | Bins with >0 counts | Bins with >2000 counts | High rate bins dominated by noise | Noise dominated (total time) | Noise dominated (detector-on time) | Marked lightcurve |
|---|---|---|---|---|---|---|---|
| A | 7467 | 7218 | 62 | 62 | 0.83% | 0.86% | 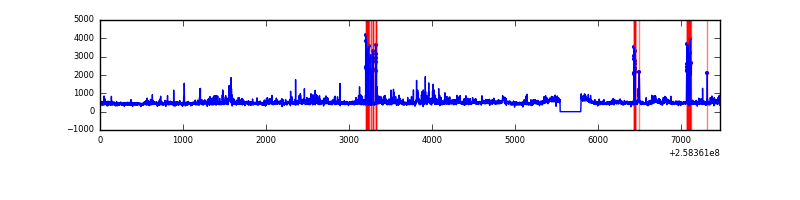 |
| B | 7467 | 7217 | 1677 | 1677 | 22.46% | 23.24% | 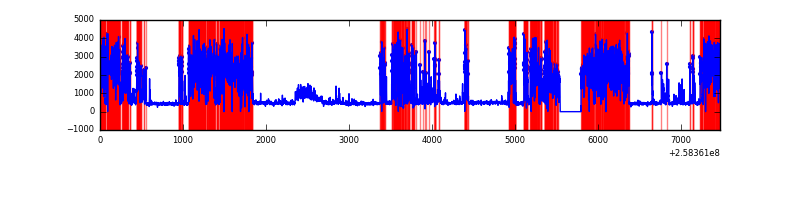 |
| C | 7467 | 7218 | 1 | 1 | 0.01% | 0.01% | 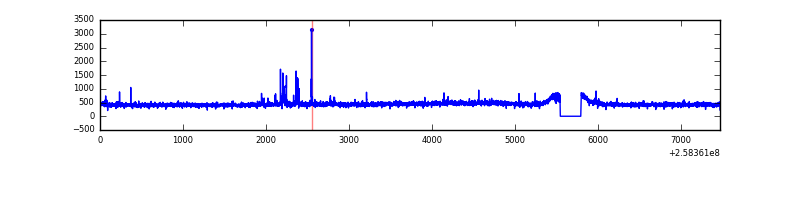 |
| D | 7467 | 7218 | 35 | 35 | 0.47% | 0.48% | 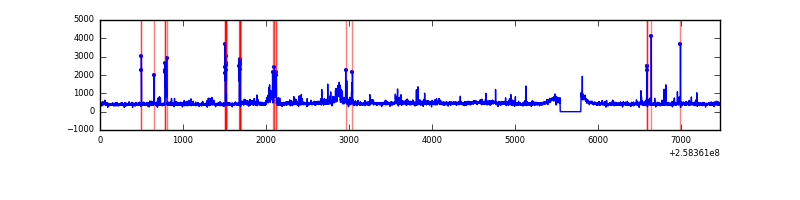 |
Top three noisy pixels from each quadrant. If the there are fewer than three noisy pixels in the level2.evt file, extra rows are filled as -1
| Pixel properties | Quadrant properties | ||||||
|---|---|---|---|---|---|---|---|
| Quadrant | DetID | PixID | Counts | Sigma | Mean | Median | Sigma |
| A | 15 | 239 | 482547 | 2898.5 | 820 | 801 | 166.2 |
| A | 12 | 189 | 164590 | 985.46 | 820 | 801 | 166.2 |
| A | 8 | 15 | 23724 | 137.92 | 820 | 801 | 166.2 |
| B | 4 | 239 | 5570732 | 44055.09 | 657 | 640 | 126.4 |
| B | 0 | 230 | 155084 | 1221.53 | 657 | 640 | 126.4 |
| B | 3 | 209 | 21192 | 162.55 | 657 | 640 | 126.4 |
| C | 15 | 208 | 55317 | 293.26 | 806 | 806 | 185.9 |
| C | 8 | 128 | 9519 | 46.88 | 806 | 806 | 185.9 |
| C | 13 | 61 | 5910 | 27.46 | 806 | 806 | 185.9 |
| D | 1 | 52 | 222282 | 1146.93 | 800 | 776 | 193.1 |
| D | 8 | 195 | 176693 | 910.87 | 800 | 776 | 193.1 |
| D | 2 | 14 | 36996 | 187.54 | 800 | 776 | 193.1 |
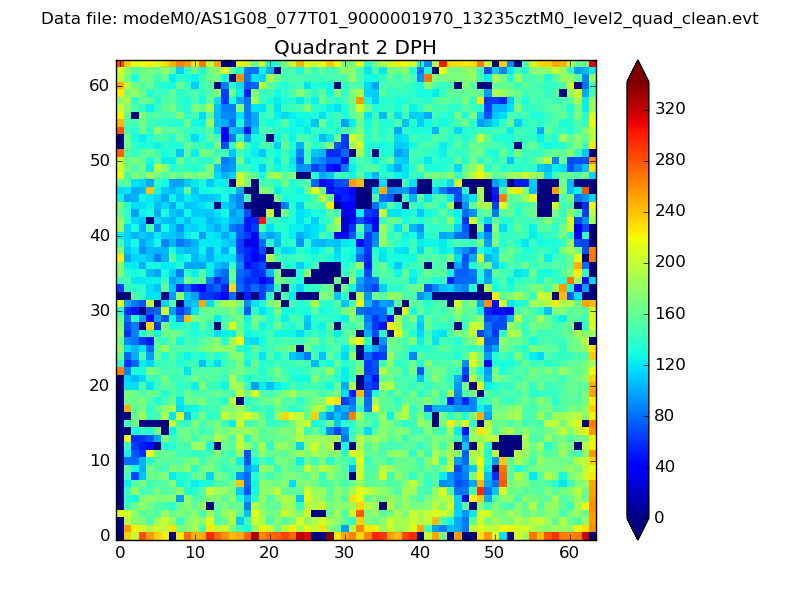
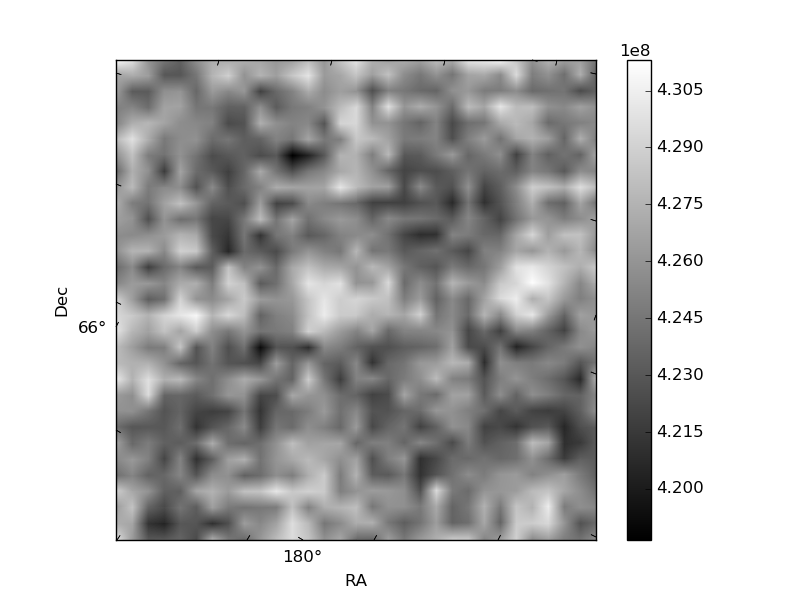
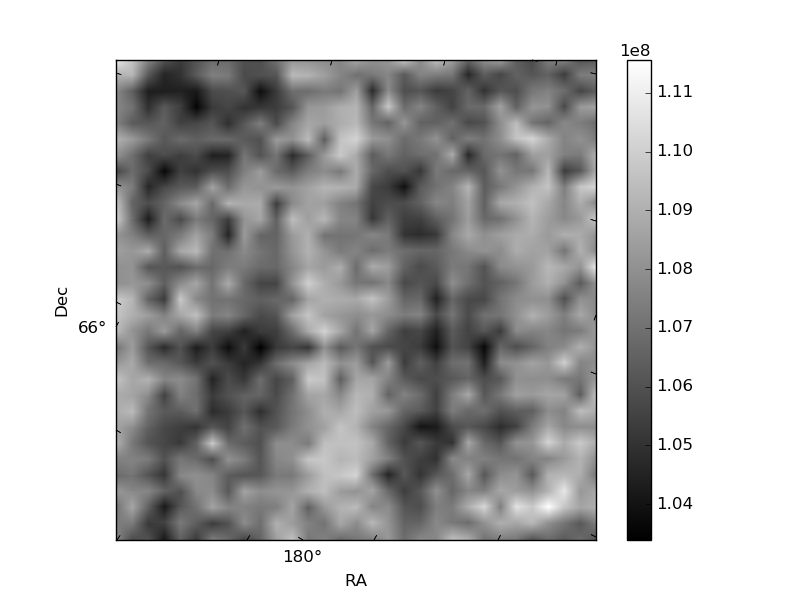
Histogram calculated using DETX and DETY for each event in the final _common_clean file
| Quadrant A | 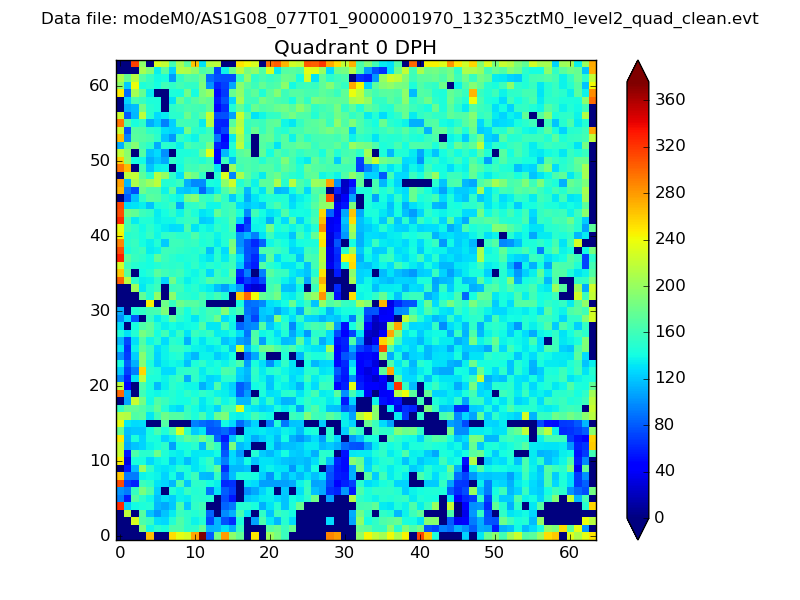 |
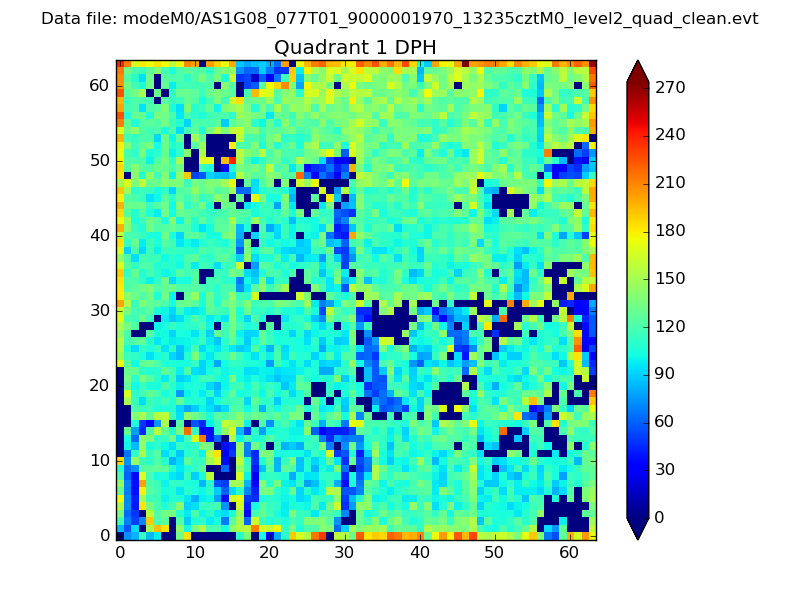 |
Quadrant B |
|---|---|---|---|
| Quadrant D | 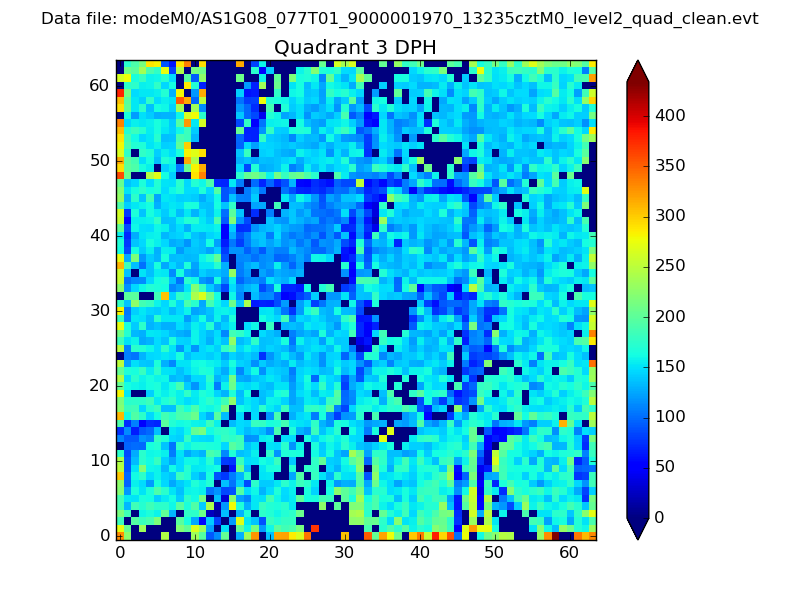 |
 |
Quadrant C |
| Plot type | Count rate plots | Images |
|---|---|---|
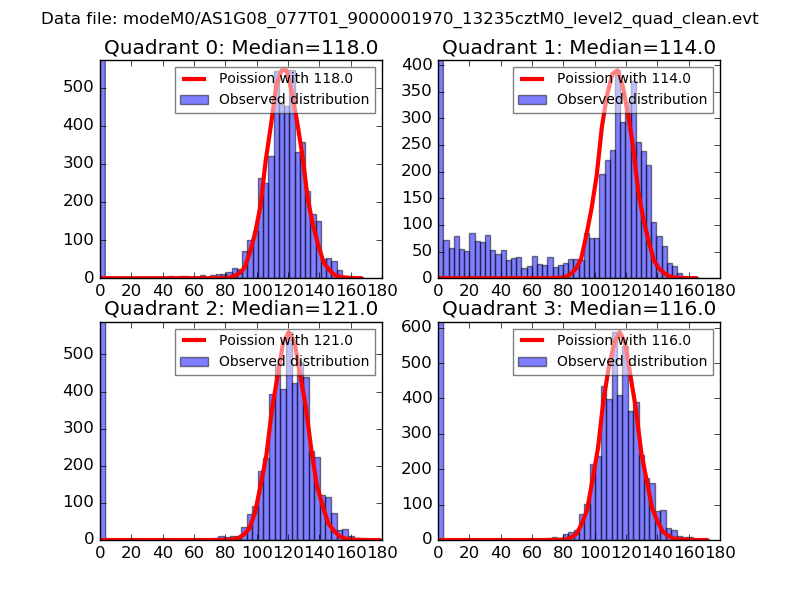
| Comparison with Poisson distribution Blue bars denote a histogram of data divided into 1 sec bins. Red curve is a Poisson curve with rate = median count rate of data. |
 |
 |
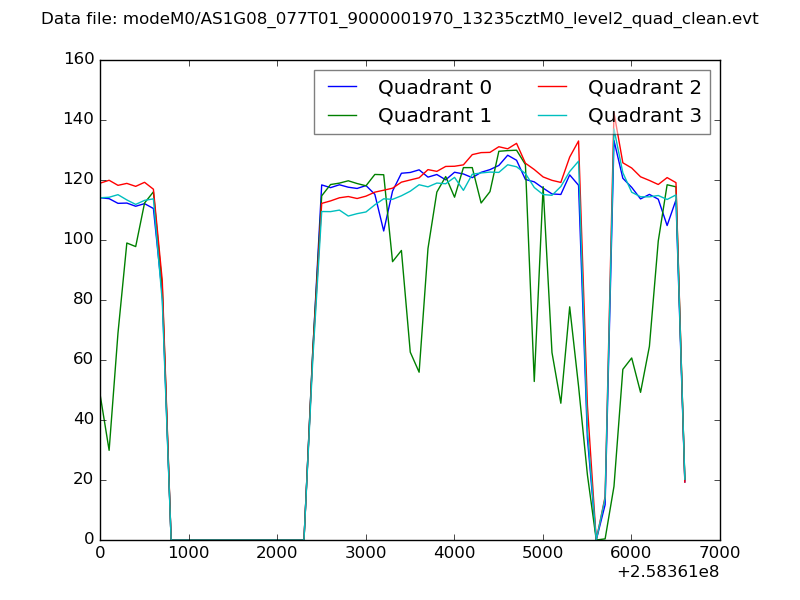
| Quadrant-wise count rates Data is divided into 100 sec bins |
 |
|
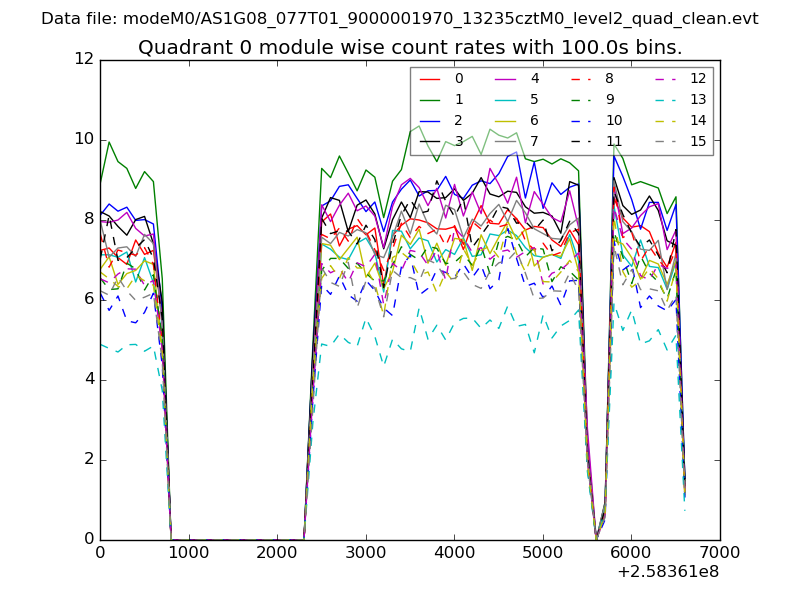
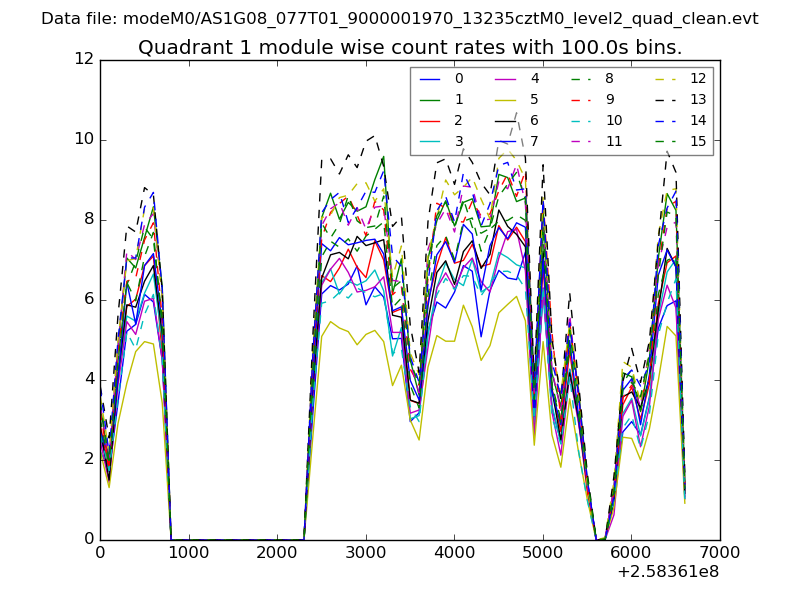
| Module-wise count rates for Quadrant A Data is divided into 100 sec bins |
 |
 |
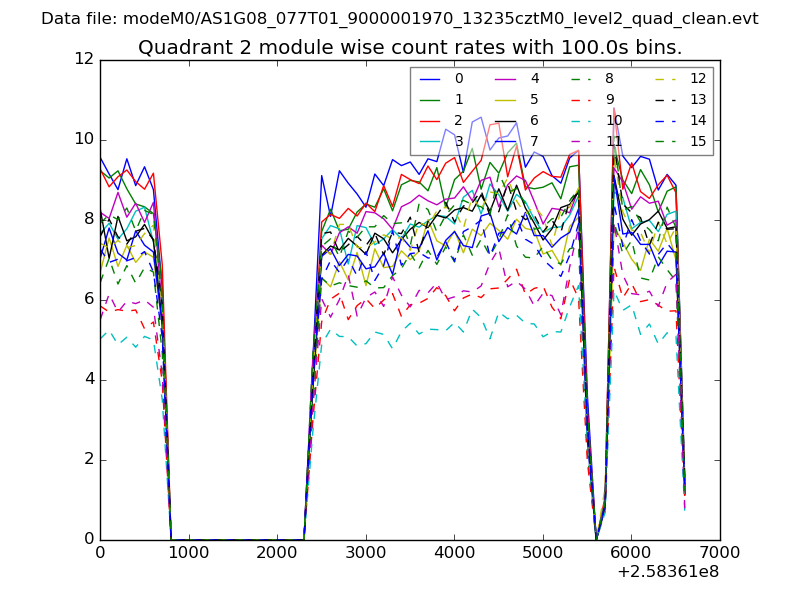
| Module-wise count rates for Quadrant B Data is divided into 100 sec bins |
 |
 |
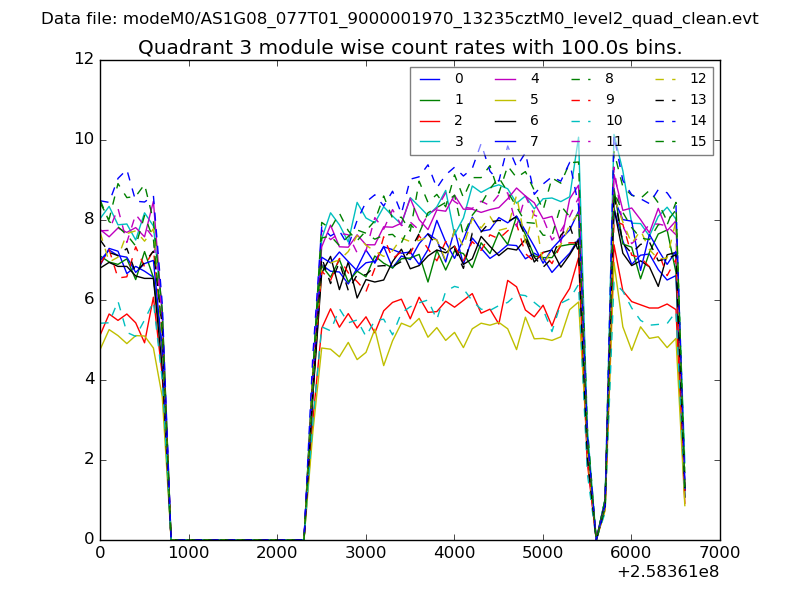
| Module-wise count rates for Quadrant C Data is divided into 100 sec bins |
 |
 |
| Module-wise count rates for Quadrant D Data is divided into 100 sec bins |
 |
 |
| Parameter | Plot |
|---|---|
| CZT HV Monitor | 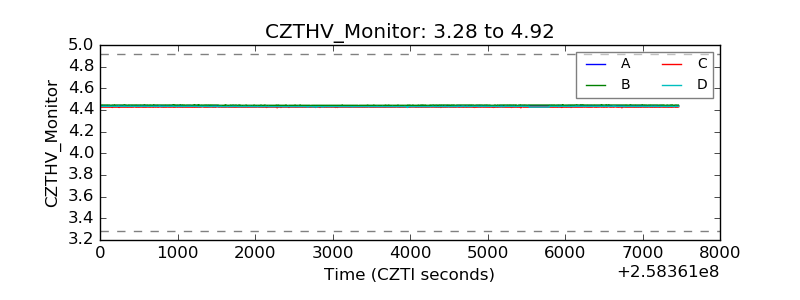 |
| D_VDD |  |
| Temperature 1 | 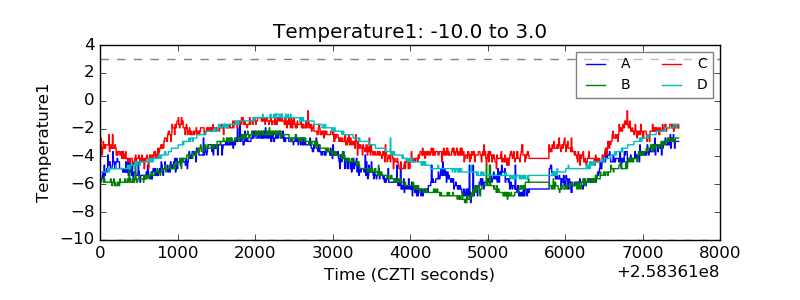 |
| Veto HV Monitor | 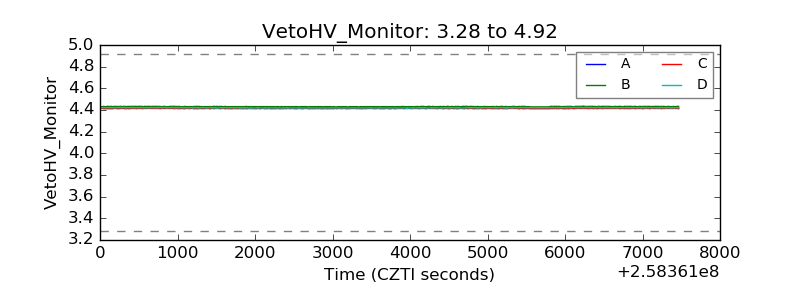 |
| Veto LLD | 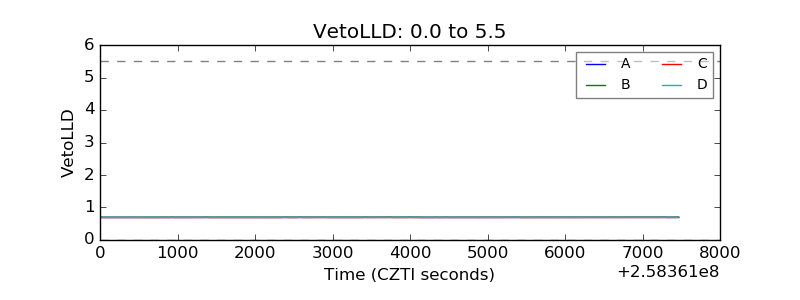 |
| Alpha Counter | 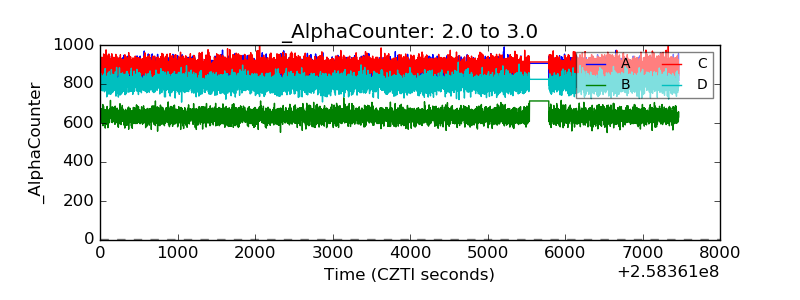 |
| _CPM_Rate | 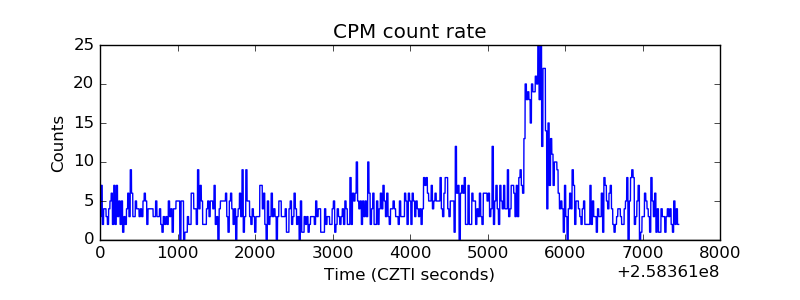 |
| CZT Counter | 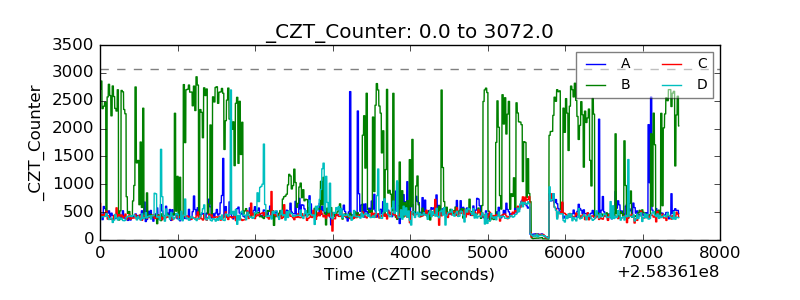 |
| +2.5 Volts monitor | 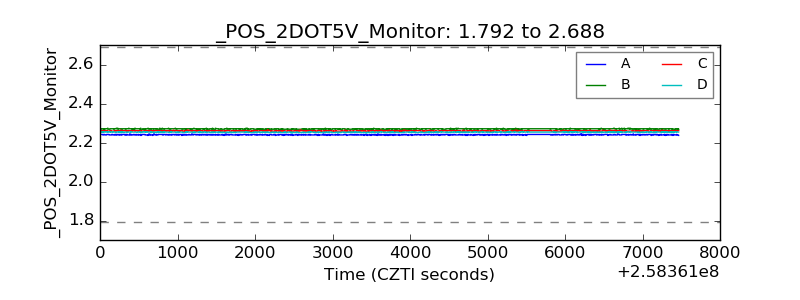 |
| +5 Volts monitor |  |
| _ROLL_ROT | 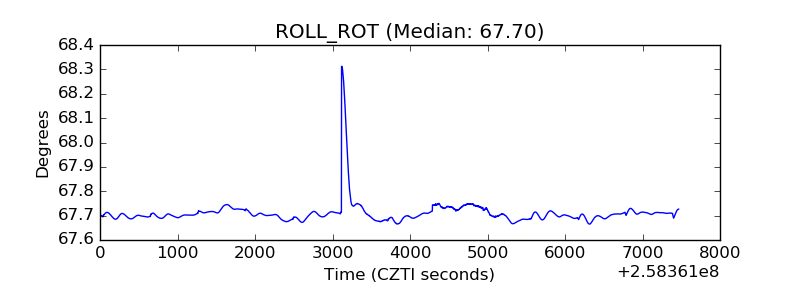 |
| _Roll_DEC | 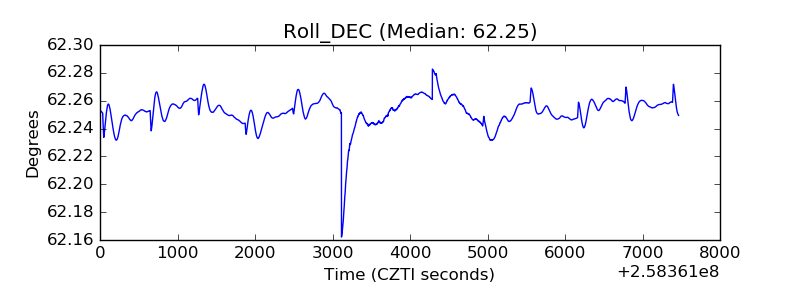 |
| _Roll_RA | 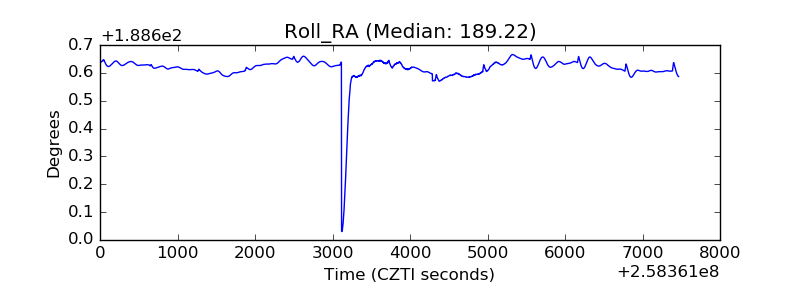 |
| Veto Counter | 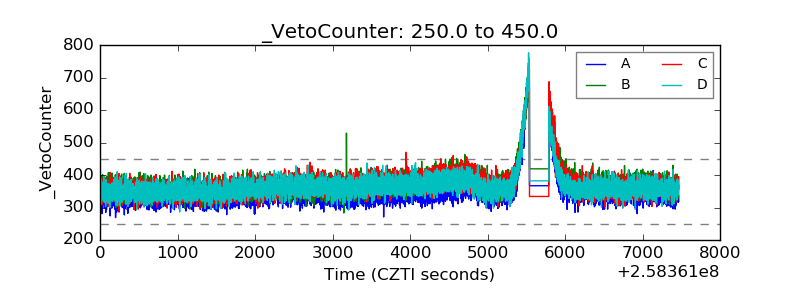 |