| Param | Original file | Final file |
|---|---|---|
| Filename | modeM0/AS1G08_077T01_9000001970_13237cztM0_level2.evt | modeM0/AS1G08_077T01_9000001970_13237cztM0_level2_quad_clean.evt |
| Size (bytes) | 746,087,040 | 81,757,440 |
| Size | 711.5 MB | 78.0 MB |
| Events in quadrant A | 4,186,870 | 515,411 |
| Events in quadrant B | 8,991,340 | 390,913 |
| Events in quadrant C | 3,413,726 | 531,470 |
| Events in quadrant D | 5,476,802 | 496,546 |
| Mode M9 | |||
|---|---|---|---|
| Quadrant | BADHDUFLAG | Total packets | Discarded packets |
| A | 0 | 5 | 0 |
| B | 0 | 5 | 0 |
| C | 0 | 5 | 0 |
| D | 0 | 5 | 0 |
| Mode SS | |||
|---|---|---|---|
| Quadrant | BADHDUFLAG | Total packets | Discarded packets |
| A | 0 | 158 | 0 |
| B | 0 | 158 | 0 |
| C | 0 | 158 | 0 |
| D | 0 | 158 | 0 |
| Mode M0 | |||
|---|---|---|---|
| Quadrant | BADHDUFLAG | Total packets | Discarded packets |
| A | 0 | 17457 | 2 |
| B | 0 | 31838 | 1 |
| C | 0 | 15741 | 1 |
| D | 0 | 21611 | 1 |
| Quadrant | Total seconds | Saturated seconds | Saturation percentage |
|---|---|---|---|
| A | 7770 | 196 | 2.522523% |
| B | 7770 | 2568 | 33.050193% |
| C | 7770 | 49 | 0.630631% |
| D | 7770 | 673 | 8.661519% |
Noise dominated data is calculated using 1-second bins in cleaned event files. If a bin has >2000 counts, and if more than 50% of those come from <1% of pixels, then it is considered to be noise-dominated and hence unusable.
| Quadrant | # 1 sec bins | Bins with >0 counts | Bins with >2000 counts | High rate bins dominated by noise | Noise dominated (total time) | Noise dominated (detector-on time) | Marked lightcurve |
|---|---|---|---|---|---|---|---|
| A | 8296 | 7772 | 107 | 107 | 1.29% | 1.38% | 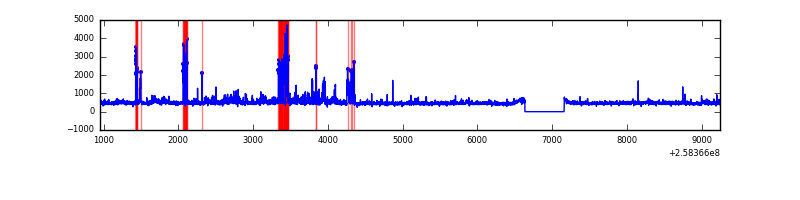 |
| B | 8296 | 7771 | 1887 | 1887 | 22.75% | 24.28% | 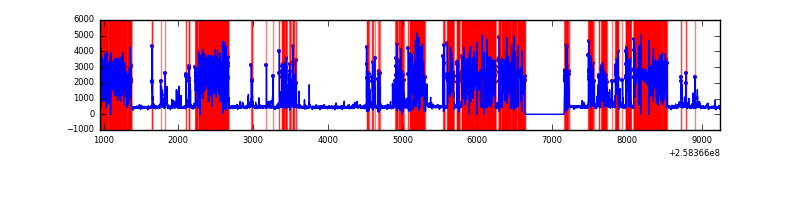 |
| C | 8296 | 7772 | 1 | 1 | 0.01% | 0.01% | 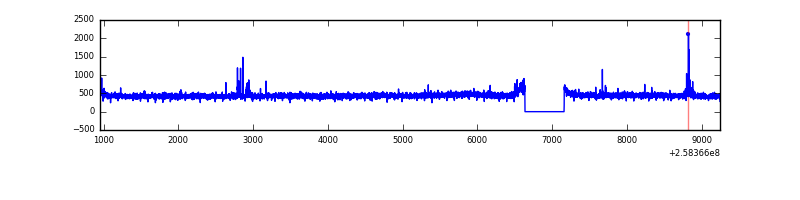 |
| D | 8296 | 7772 | 534 | 534 | 6.44% | 6.87% | 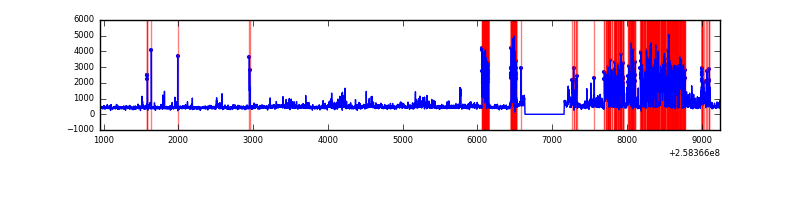 |
Top three noisy pixels from each quadrant. If the there are fewer than three noisy pixels in the level2.evt file, extra rows are filled as -1
| Pixel properties | Quadrant properties | ||||||
|---|---|---|---|---|---|---|---|
| Quadrant | DetID | PixID | Counts | Sigma | Mean | Median | Sigma |
| A | 15 | 239 | 569947 | 3157.21 | 886 | 866 | 180.2 |
| A | 12 | 189 | 180610 | 997.2 | 886 | 866 | 180.2 |
| A | 1 | 162 | 19471 | 103.22 | 886 | 866 | 180.2 |
| B | 4 | 239 | 6116975 | 45962.17 | 696 | 677 | 133.1 |
| B | 0 | 214 | 35165 | 259.16 | 696 | 677 | 133.1 |
| B | 0 | 219 | 33169 | 244.16 | 696 | 677 | 133.1 |
| C | 15 | 208 | 38112 | 186.93 | 865 | 867 | 199.3 |
| C | 13 | 61 | 6358 | 27.56 | 865 | 867 | 199.3 |
| C | 14 | 234 | 3306 | 12.24 | 865 | 867 | 199.3 |
| D | 10 | 157 | 1948539 | 9606.76 | 833 | 807 | 202.7 |
| D | 8 | 195 | 149660 | 734.18 | 833 | 807 | 202.7 |
| D | 5 | 222 | 73589 | 358.98 | 833 | 807 | 202.7 |
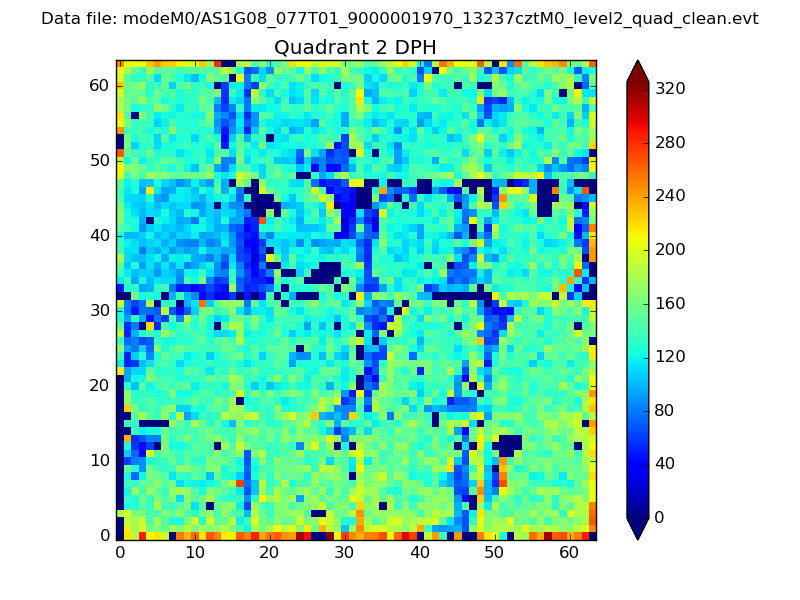
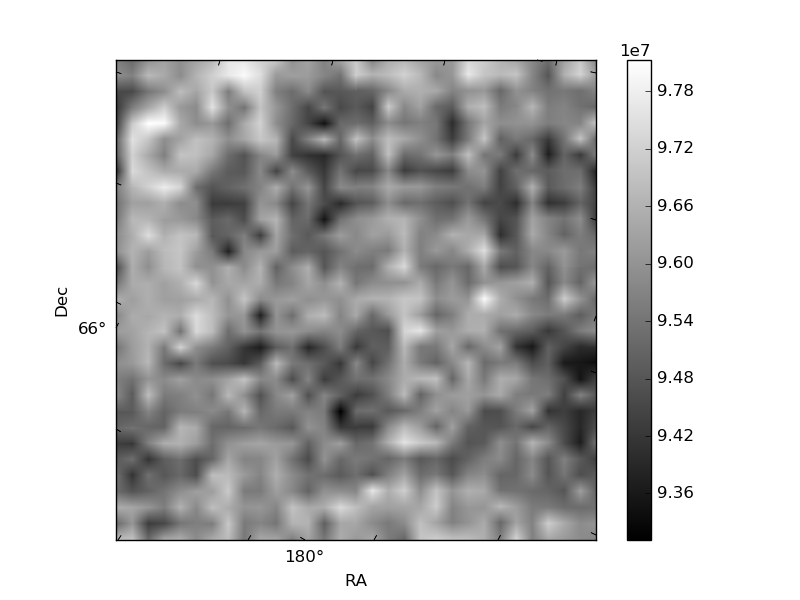
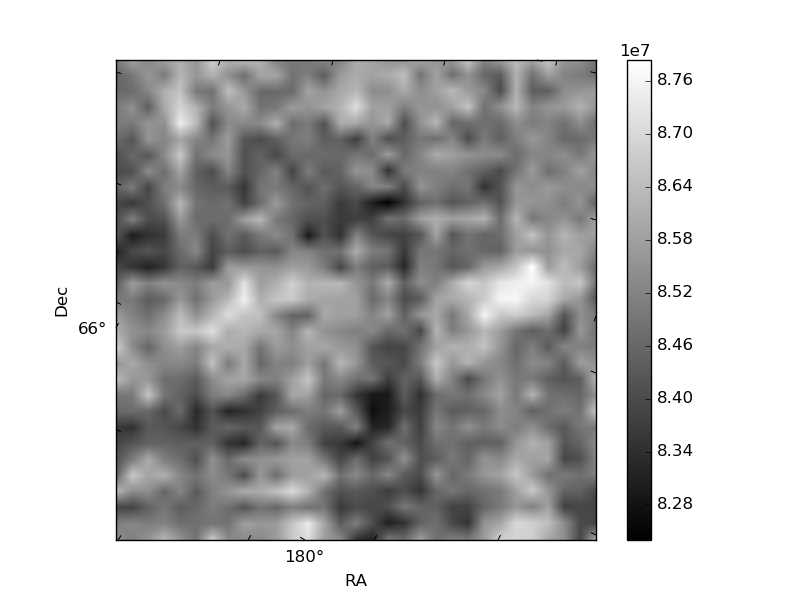
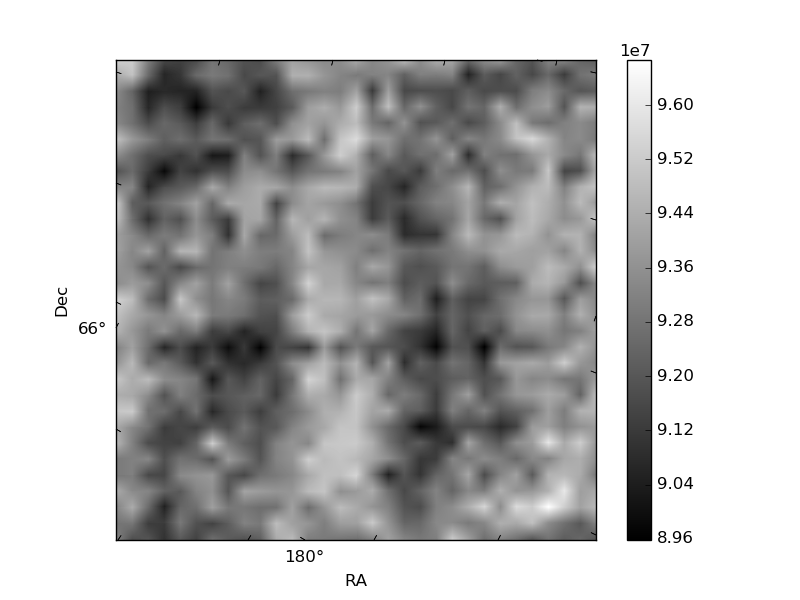
Histogram calculated using DETX and DETY for each event in the final _common_clean file
| Quadrant A | 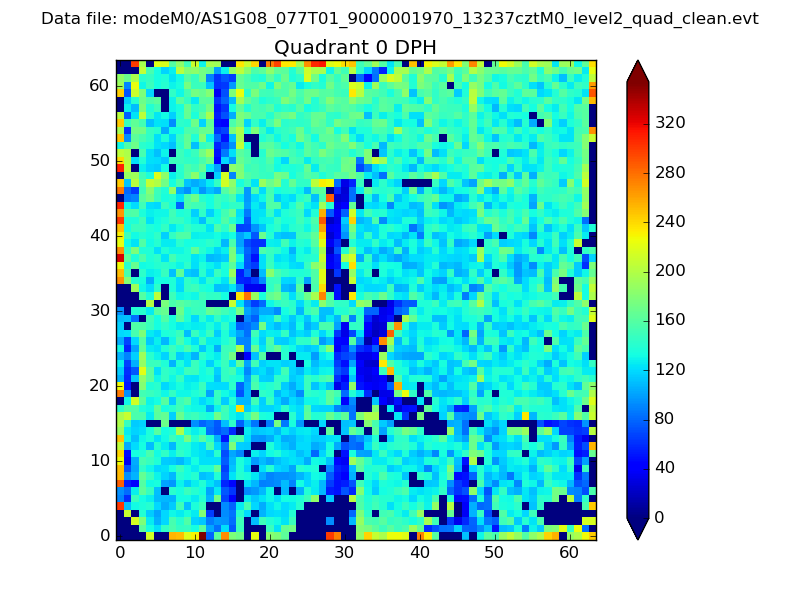 |
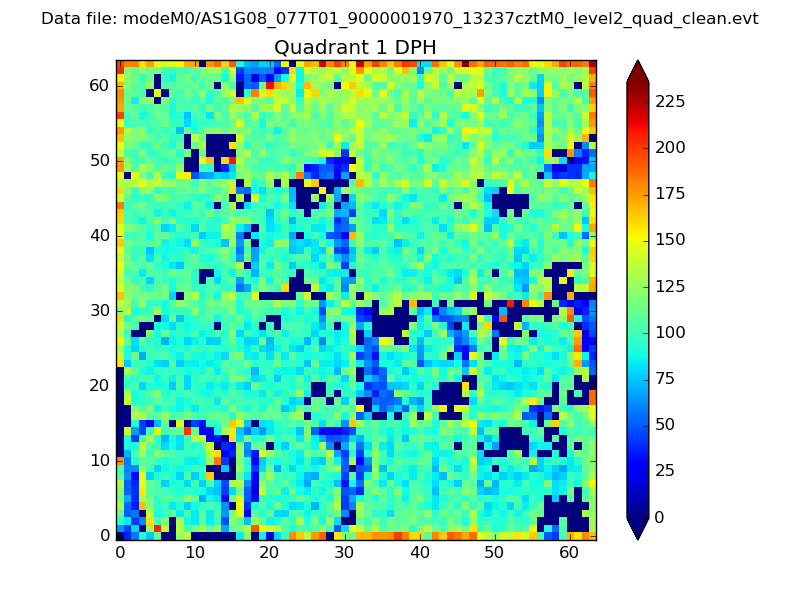 |
Quadrant B |
|---|---|---|---|
| Quadrant D | 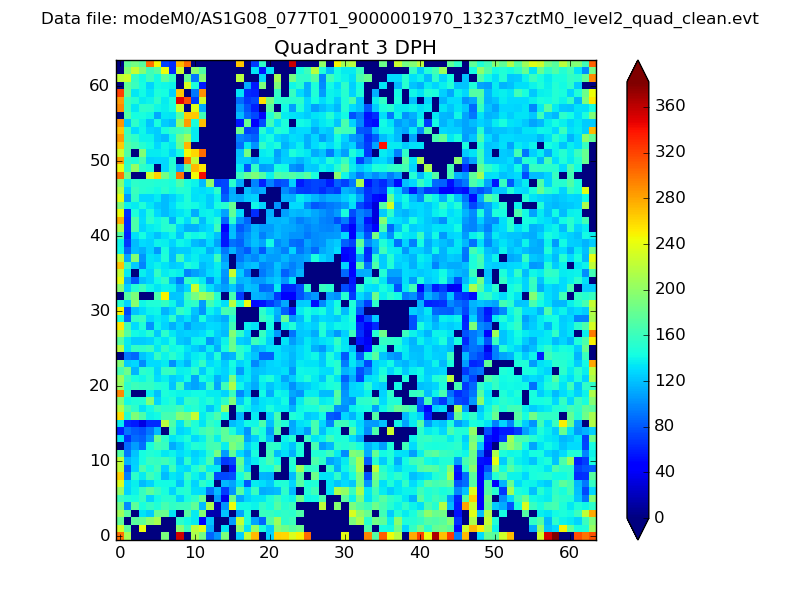 |
 |
Quadrant C |
| Plot type | Count rate plots | Images |
|---|---|---|
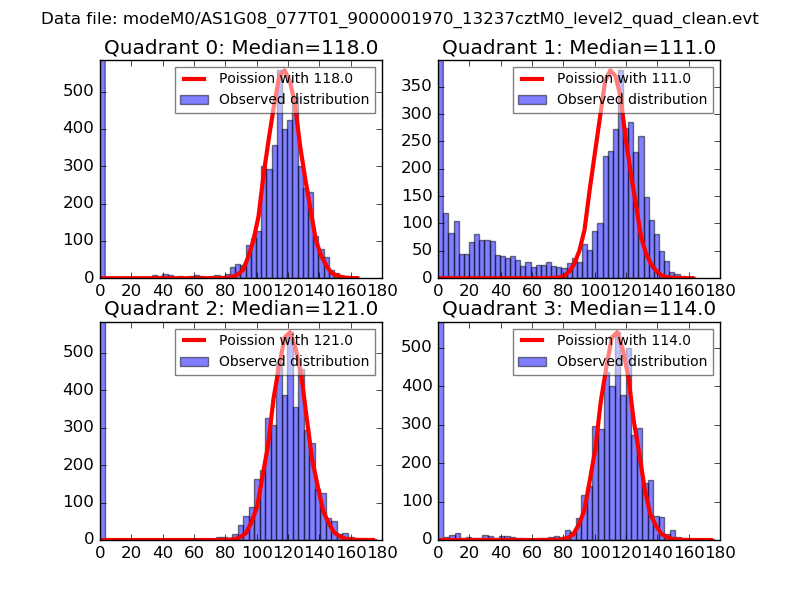
| Comparison with Poisson distribution Blue bars denote a histogram of data divided into 1 sec bins. Red curve is a Poisson curve with rate = median count rate of data. |
 |
 |
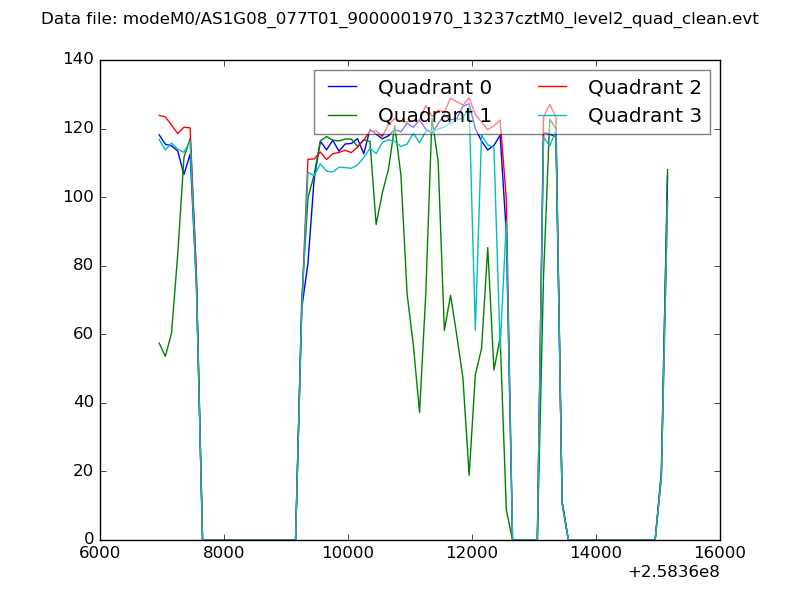
| Quadrant-wise count rates Data is divided into 100 sec bins |
 |
|
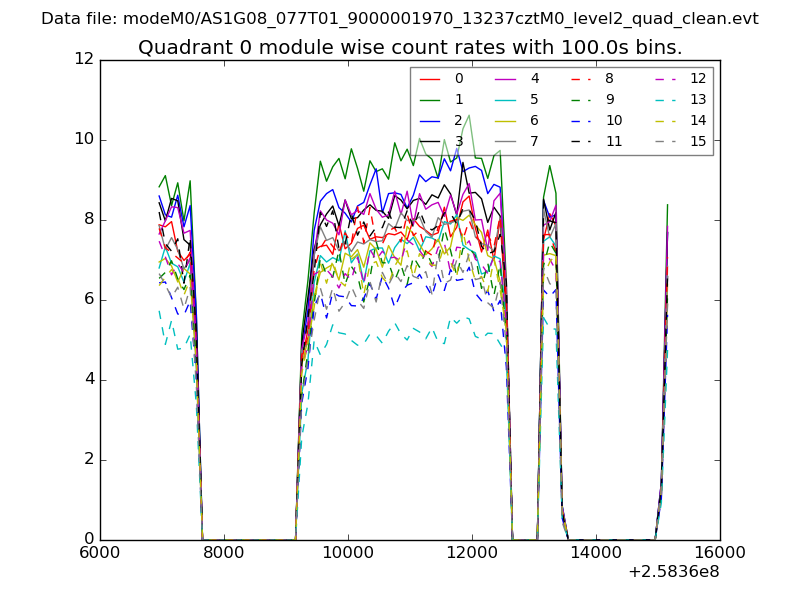
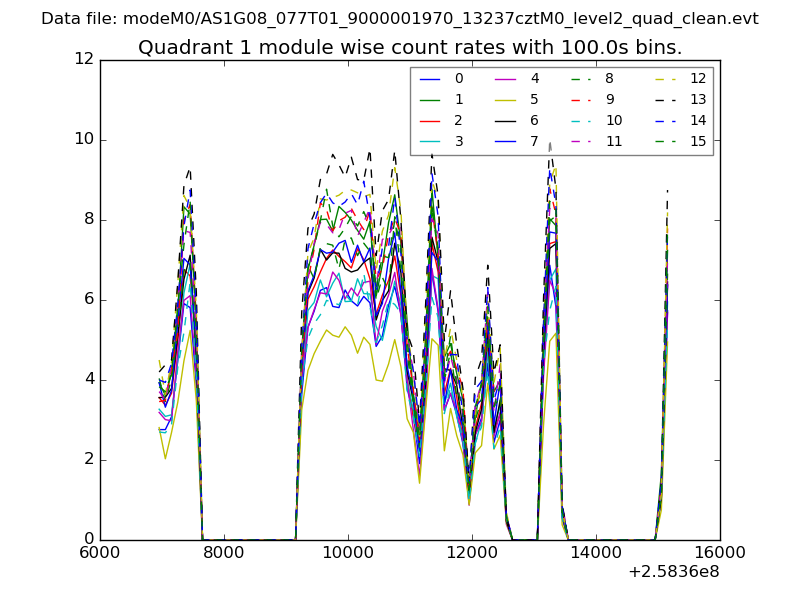
| Module-wise count rates for Quadrant A Data is divided into 100 sec bins |
 |
 |
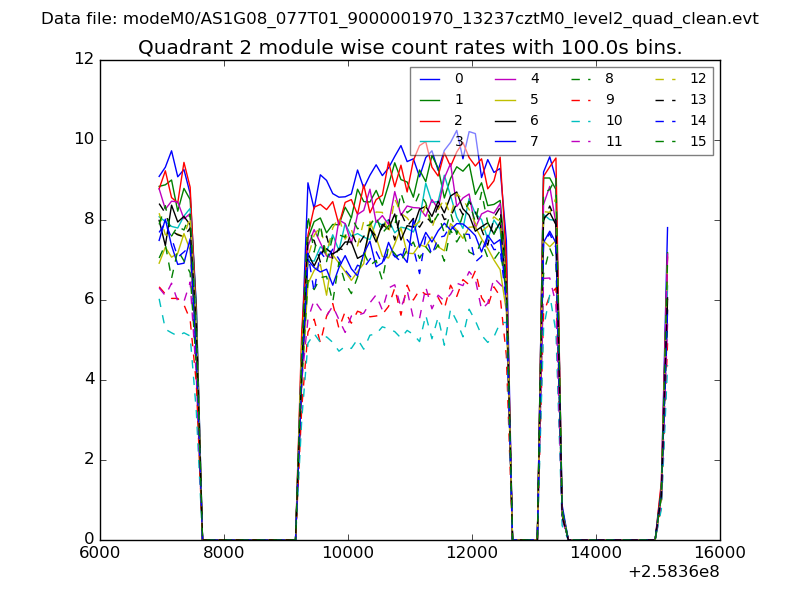
| Module-wise count rates for Quadrant B Data is divided into 100 sec bins |
 |
 |
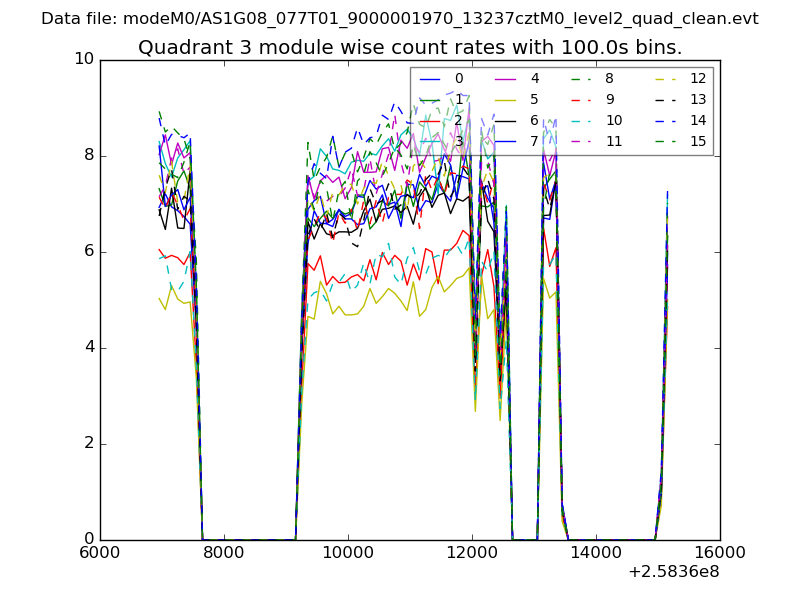
| Module-wise count rates for Quadrant C Data is divided into 100 sec bins |
 |
 |
| Module-wise count rates for Quadrant D Data is divided into 100 sec bins |
 |
 |
| Parameter | Plot |
|---|---|
| CZT HV Monitor | 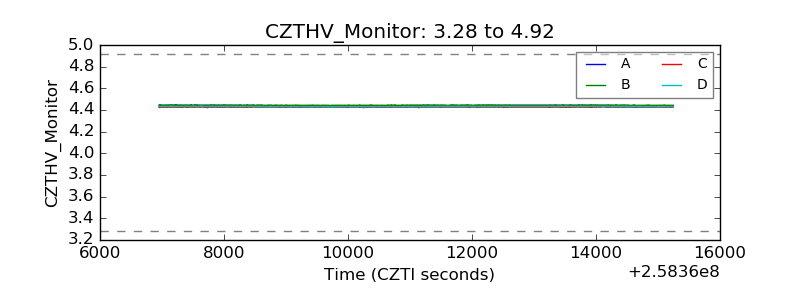 |
| D_VDD | 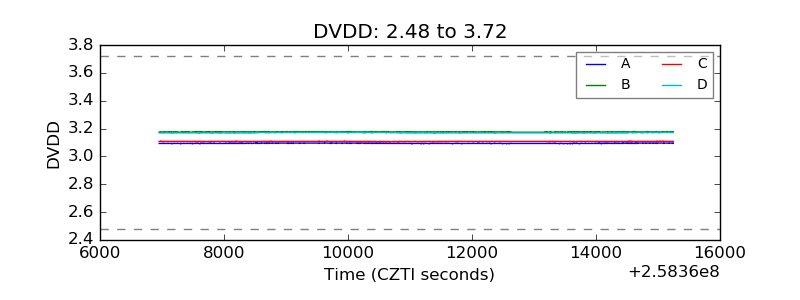 |
| Temperature 1 | 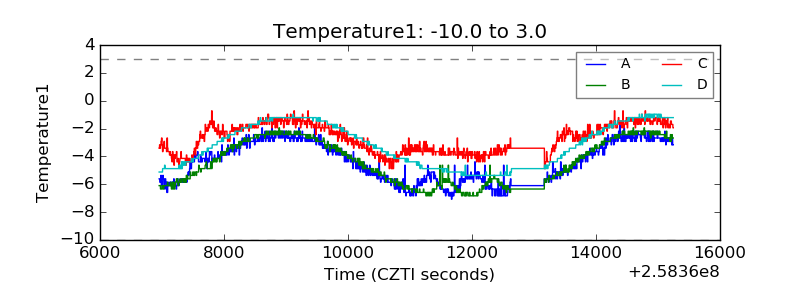 |
| Veto HV Monitor | 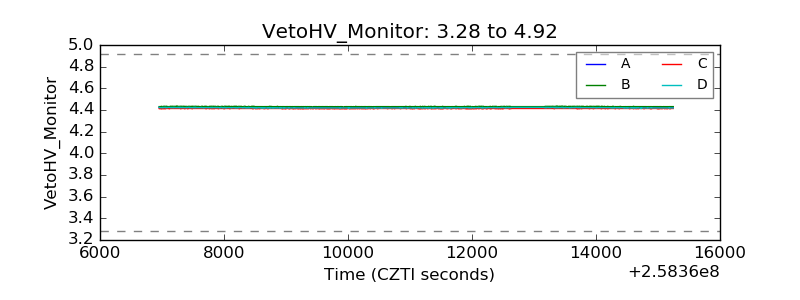 |
| Veto LLD | 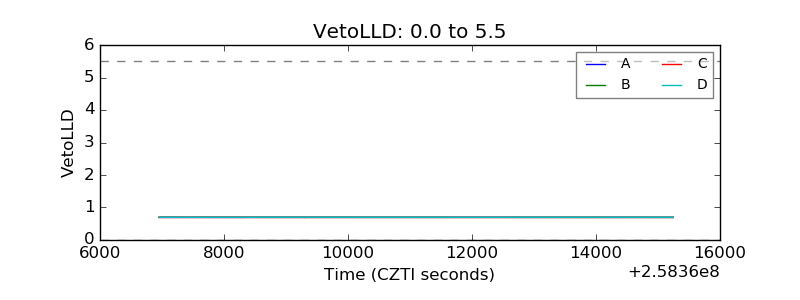 |
| Alpha Counter | 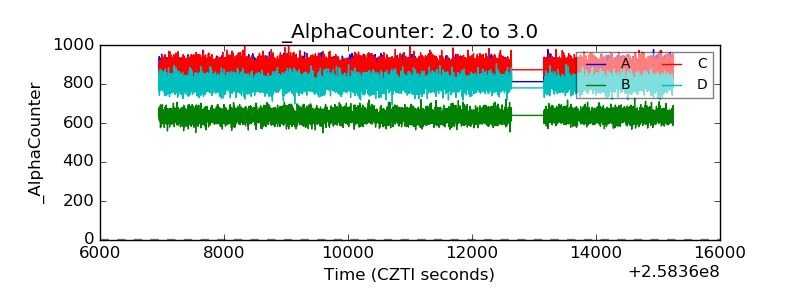 |
| _CPM_Rate | 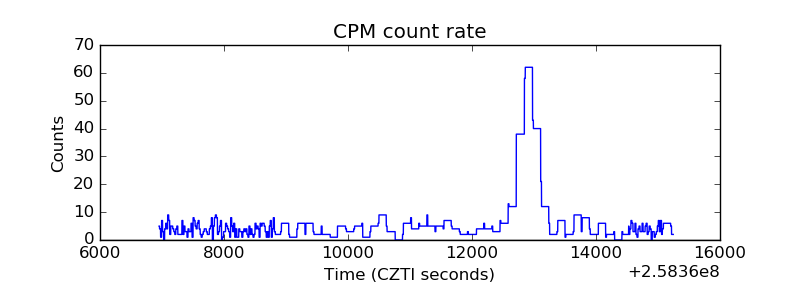 |
| CZT Counter | 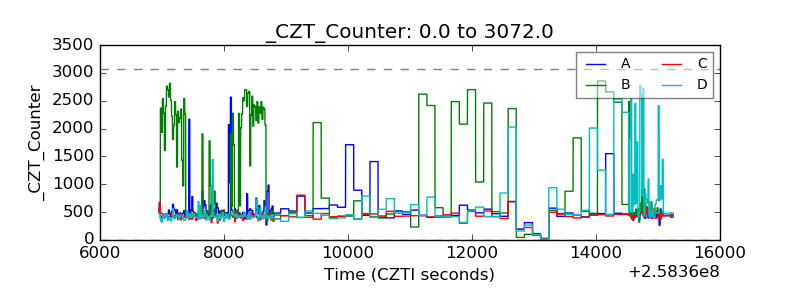 |
| +2.5 Volts monitor | 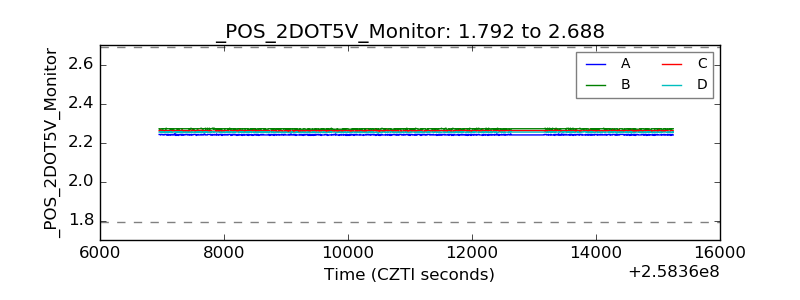 |
| +5 Volts monitor |  |
| _ROLL_ROT | 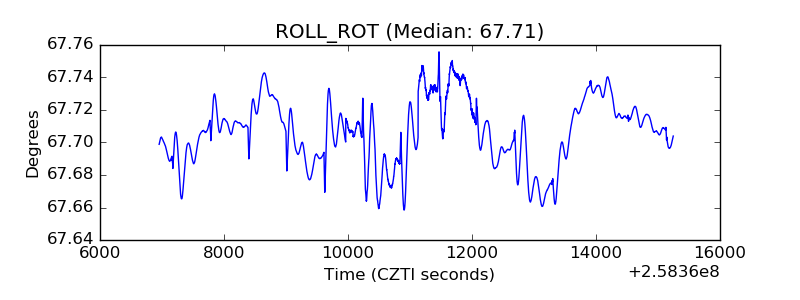 |
| _Roll_DEC | 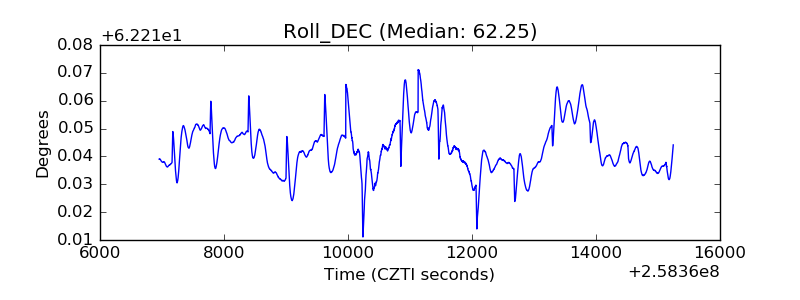 |
| _Roll_RA | 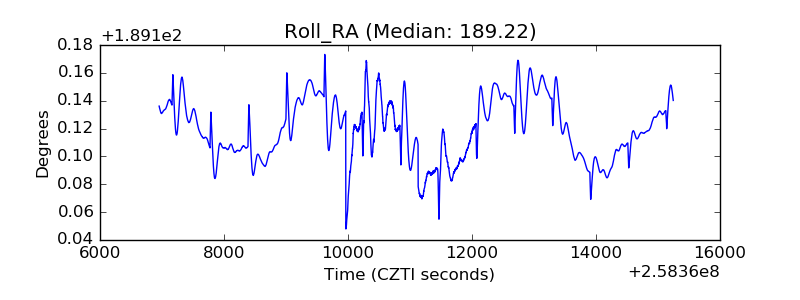 |
| Veto Counter | 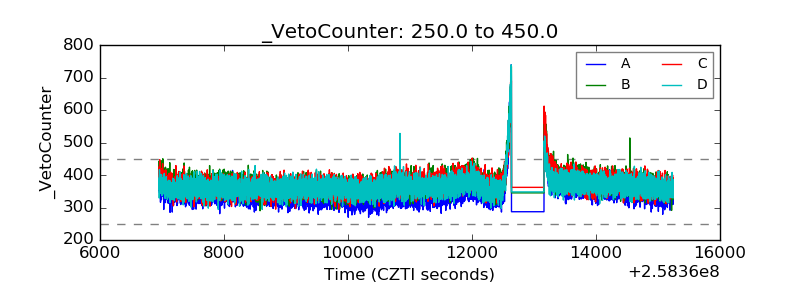 |