| Param | Original file | Final file |
|---|---|---|
| Filename | modeM0/AS1G08_077T01_9000001970_13238cztM0_level2.evt | modeM0/AS1G08_077T01_9000001970_13238cztM0_level2_quad_clean.evt |
| Size (bytes) | 929,056,320 | 141,059,520 |
| Size | 886.0 MB | 134.5 MB |
| Events in quadrant A | 5,197,999 | 918,749 |
| Events in quadrant B | 10,738,675 | 827,305 |
| Events in quadrant C | 4,660,082 | 928,591 |
| Events in quadrant D | 6,833,316 | 873,526 |
| Mode M9 | |||
|---|---|---|---|
| Quadrant | BADHDUFLAG | Total packets | Discarded packets |
| A | 0 | 16 | 0 |
| B | 0 | 16 | 0 |
| C | 0 | 16 | 0 |
| D | 0 | 16 | 0 |
| Mode SS | |||
|---|---|---|---|
| Quadrant | BADHDUFLAG | Total packets | Discarded packets |
| A | 0 | 212 | 0 |
| B | 0 | 212 | 0 |
| C | 0 | 212 | 0 |
| D | 0 | 212 | 0 |
| Mode M0 | |||
|---|---|---|---|
| Quadrant | BADHDUFLAG | Total packets | Discarded packets |
| A | 0 | 22469 | 3 |
| B | 0 | 38943 | 2 |
| C | 0 | 21197 | 2 |
| D | 0 | 27046 | 2 |
| Quadrant | Total seconds | Saturated seconds | Saturation percentage |
|---|---|---|---|
| A | 10441 | 172 | 1.647352% |
| B | 10441 | 2584 | 24.748587% |
| C | 10441 | 85 | 0.814098% |
| D | 10441 | 720 | 6.895891% |
Noise dominated data is calculated using 1-second bins in cleaned event files. If a bin has >2000 counts, and if more than 50% of those come from <1% of pixels, then it is considered to be noise-dominated and hence unusable.
| Quadrant | # 1 sec bins | Bins with >0 counts | Bins with >2000 counts | High rate bins dominated by noise | Noise dominated (total time) | Noise dominated (detector-on time) | Marked lightcurve |
|---|---|---|---|---|---|---|---|
| A | 12017 | 10444 | 39 | 39 | 0.32% | 0.37% | 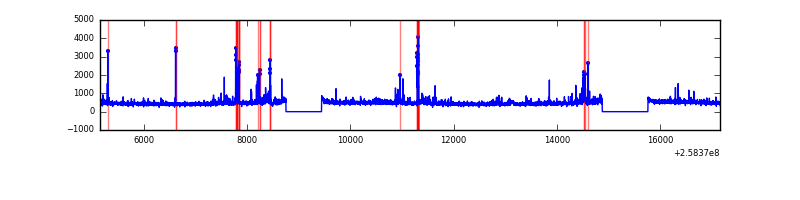 |
| B | 12017 | 10442 | 1849 | 1849 | 15.39% | 17.71% | 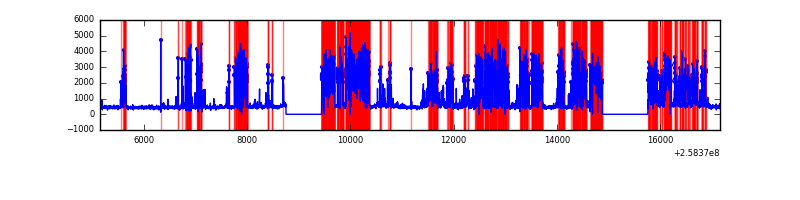 |
| C | 12017 | 10444 | 2 | 2 | 0.02% | 0.02% | 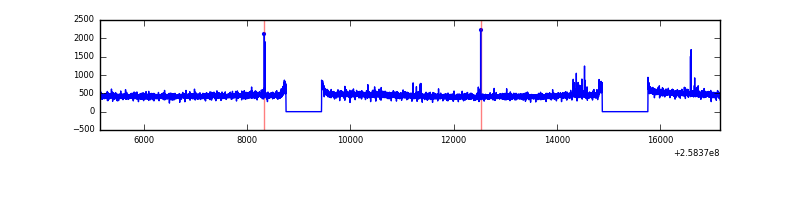 |
| D | 12017 | 10444 | 592 | 592 | 4.93% | 5.67% | 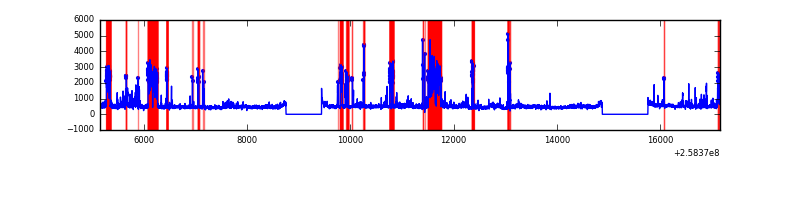 |
Top three noisy pixels from each quadrant. If the there are fewer than three noisy pixels in the level2.evt file, extra rows are filled as -1
| Pixel properties | Quadrant properties | ||||||
|---|---|---|---|---|---|---|---|
| Quadrant | DetID | PixID | Counts | Sigma | Mean | Median | Sigma |
| A | 12 | 189 | 370595 | 1511.6 | 1207 | 1179 | 244.4 |
| A | 15 | 239 | 89274 | 360.47 | 1207 | 1179 | 244.4 |
| A | 15 | 69 | 60687 | 243.5 | 1207 | 1179 | 244.4 |
| B | 4 | 239 | 6465267 | 32476.49 | 1042 | 1014 | 199.0 |
| B | 3 | 64 | 64003 | 316.46 | 1042 | 1014 | 199.0 |
| B | 4 | 142 | 41137 | 201.58 | 1042 | 1014 | 199.0 |
| C | 15 | 208 | 29962 | 105.06 | 1185 | 1187 | 273.9 |
| C | 13 | 61 | 8689 | 27.39 | 1185 | 1187 | 273.9 |
| C | 8 | 222 | 5732 | 16.59 | 1185 | 1187 | 273.9 |
| D | 1 | 52 | 1353634 | 4878.64 | 1155 | 1120 | 277.2 |
| D | 10 | 157 | 668224 | 2406.3 | 1155 | 1120 | 277.2 |
| D | 5 | 222 | 258437 | 928.17 | 1155 | 1120 | 277.2 |
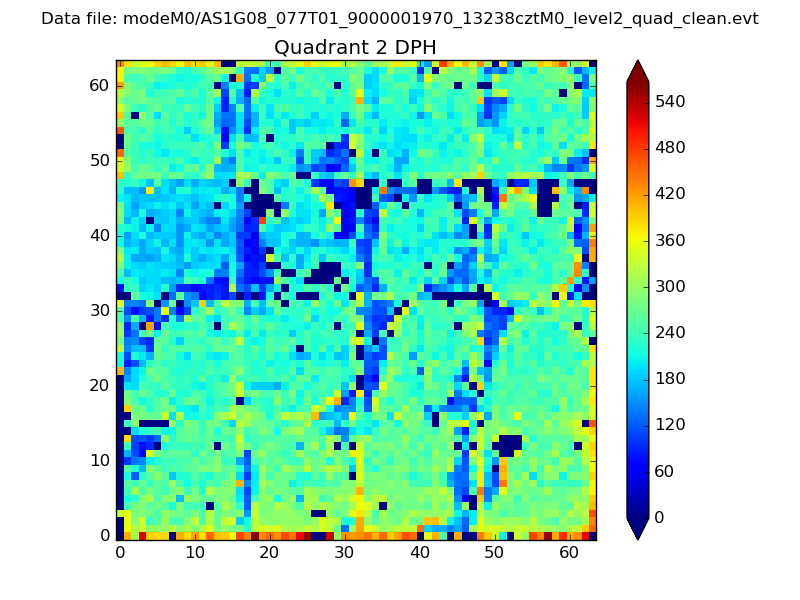
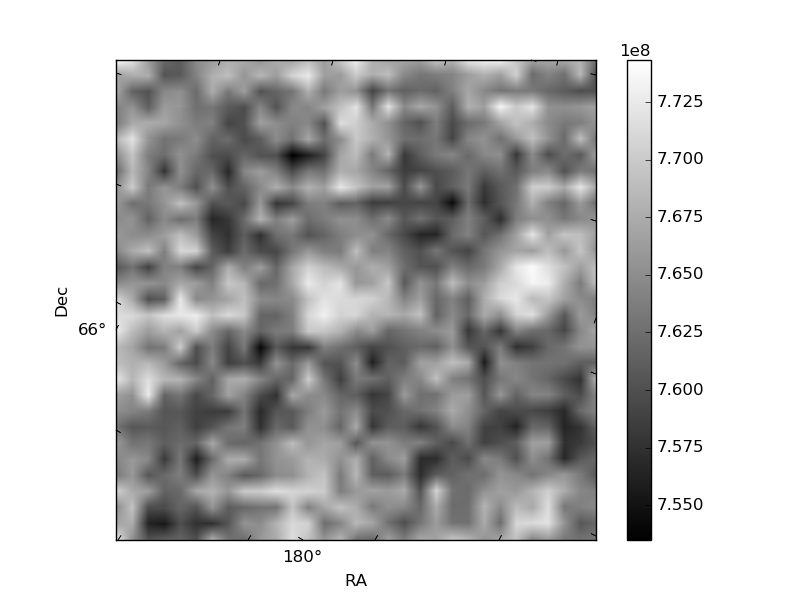
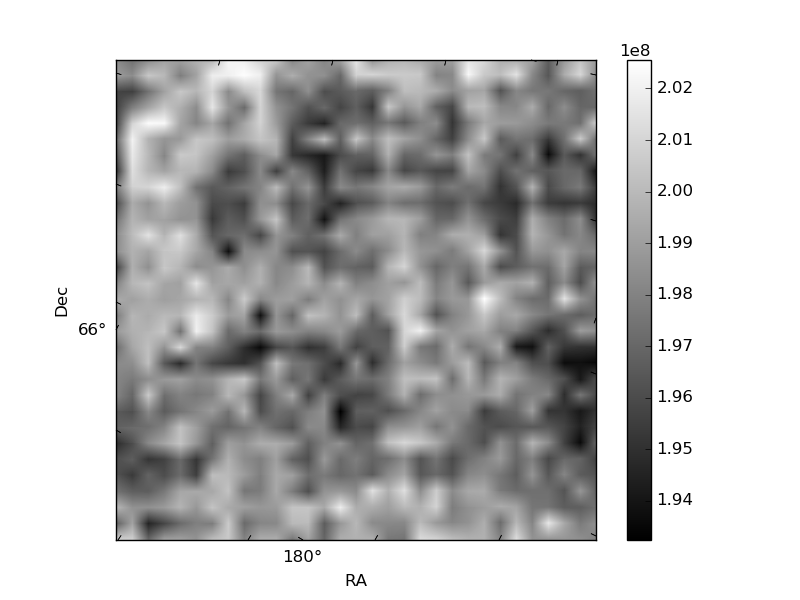
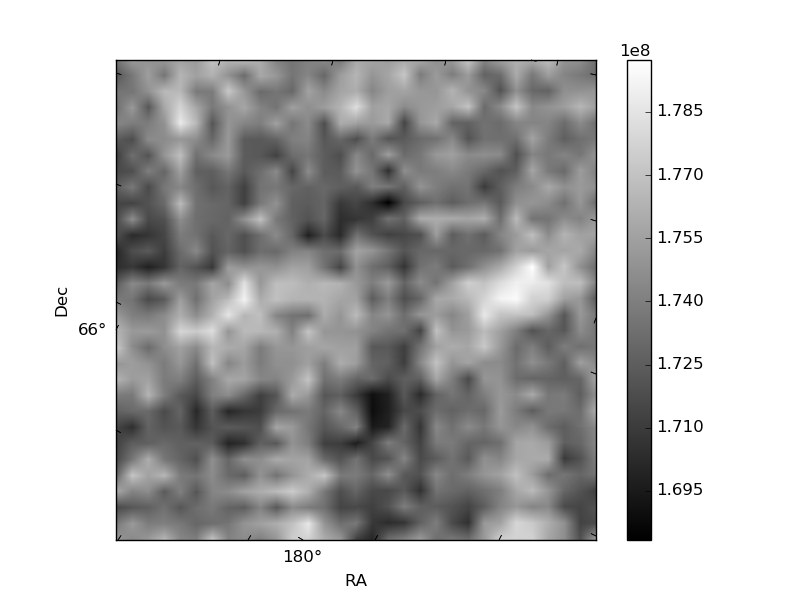
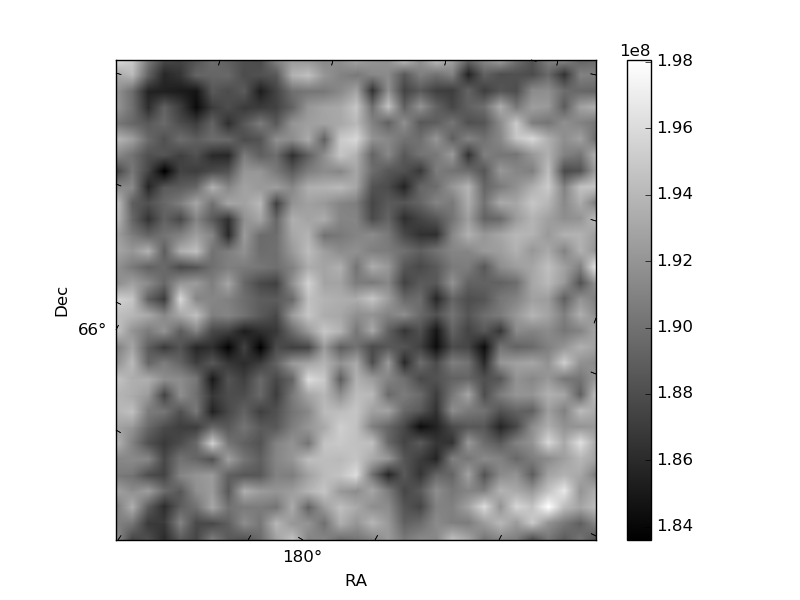
Histogram calculated using DETX and DETY for each event in the final _common_clean file
| Quadrant A | 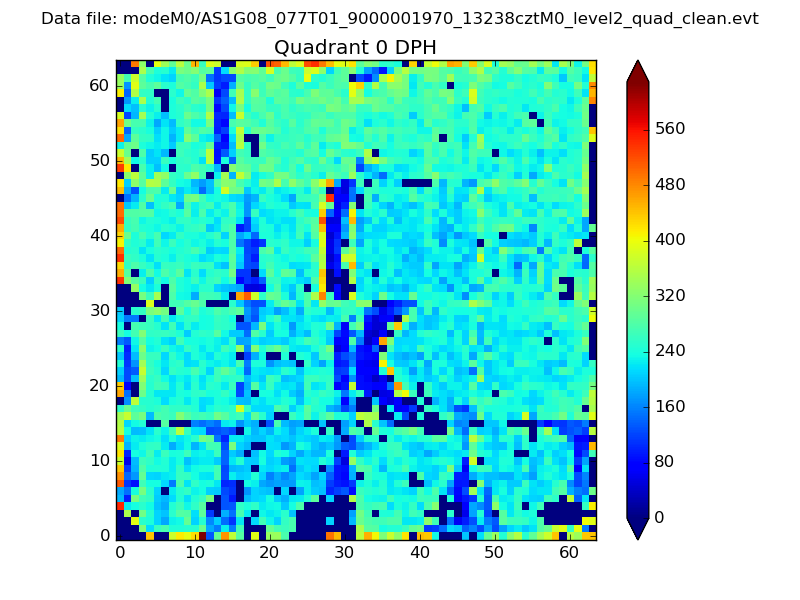 |
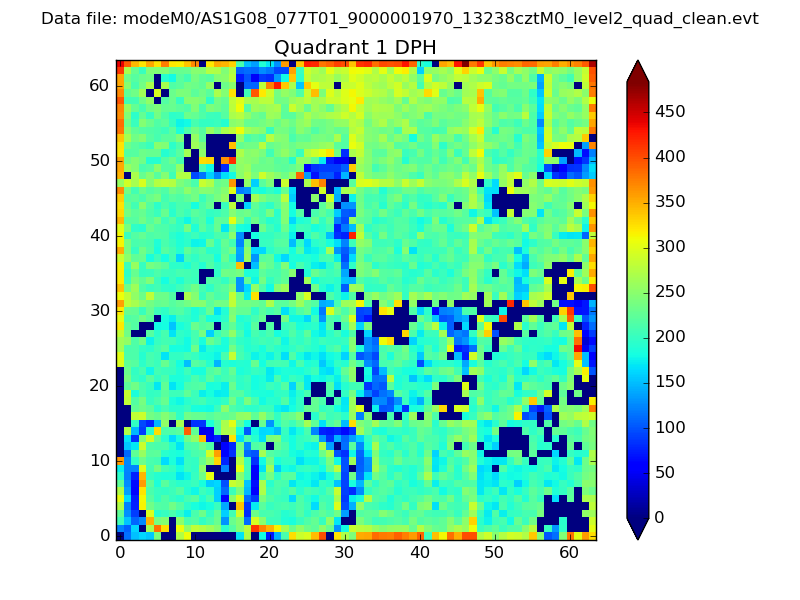 |
Quadrant B |
|---|---|---|---|
| Quadrant D | 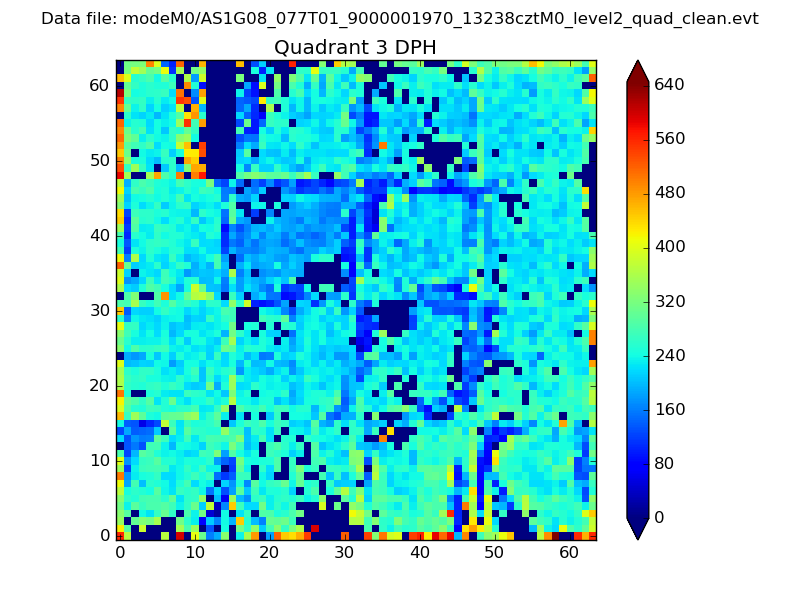 |
 |
Quadrant C |
| Plot type | Count rate plots | Images |
|---|---|---|
| Comparison with Poisson distribution Blue bars denote a histogram of data divided into 1 sec bins. Red curve is a Poisson curve with rate = median count rate of data. |
 |
 |
| Quadrant-wise count rates Data is divided into 100 sec bins |
 |
|
| Module-wise count rates for Quadrant A Data is divided into 100 sec bins |
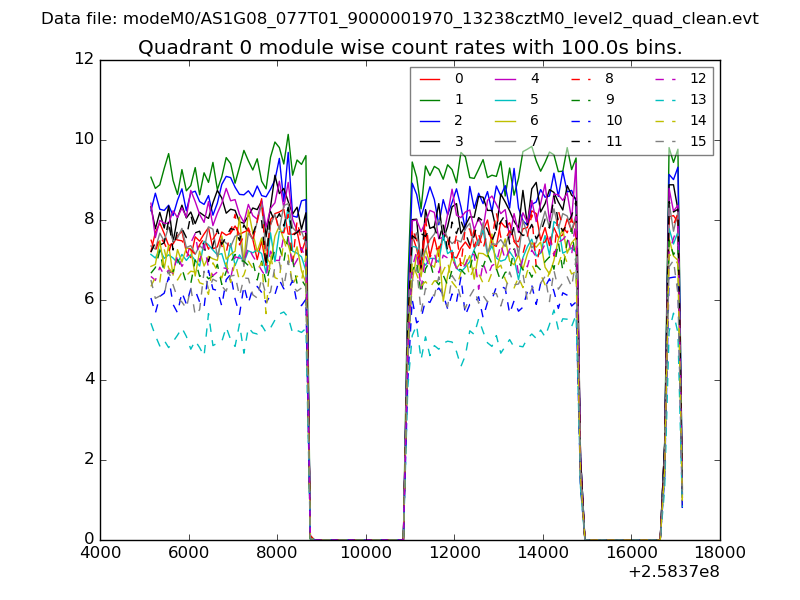 |
 |
| Module-wise count rates for Quadrant B Data is divided into 100 sec bins |
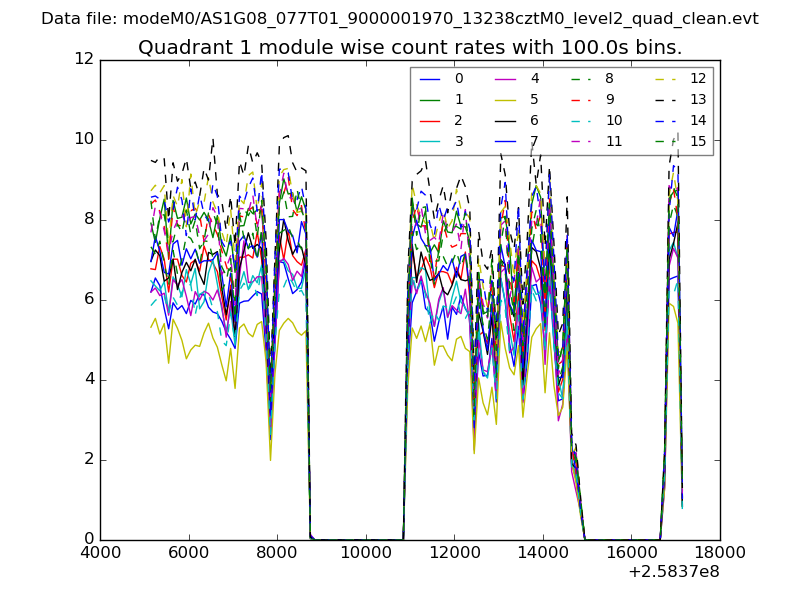 |
 |
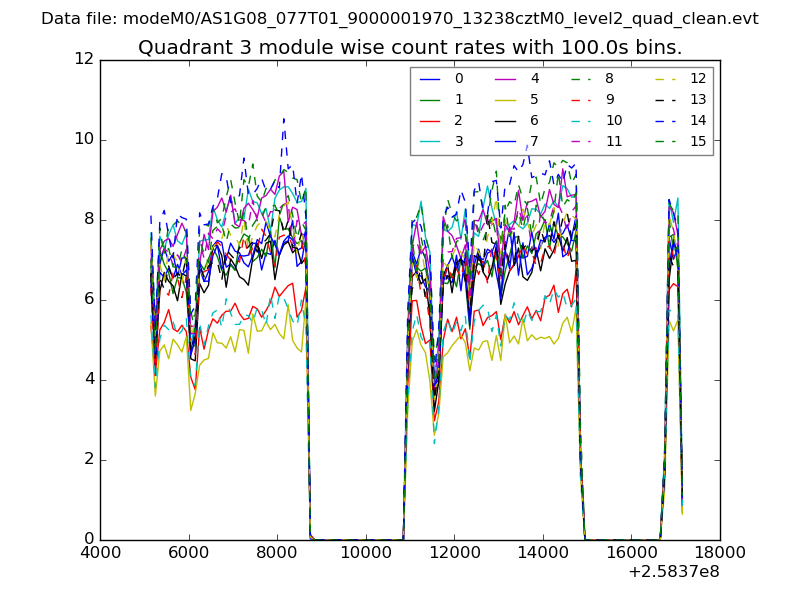
| Module-wise count rates for Quadrant C Data is divided into 100 sec bins |
 |
 |
| Module-wise count rates for Quadrant D Data is divided into 100 sec bins |
 |
 |
| Parameter | Plot |
|---|---|
| CZT HV Monitor |  |
| D_VDD | 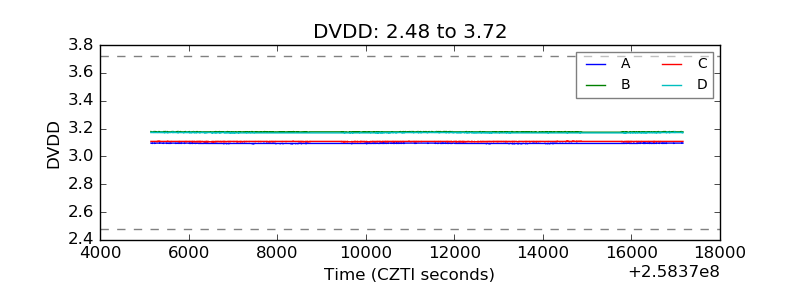 |
| Temperature 1 | 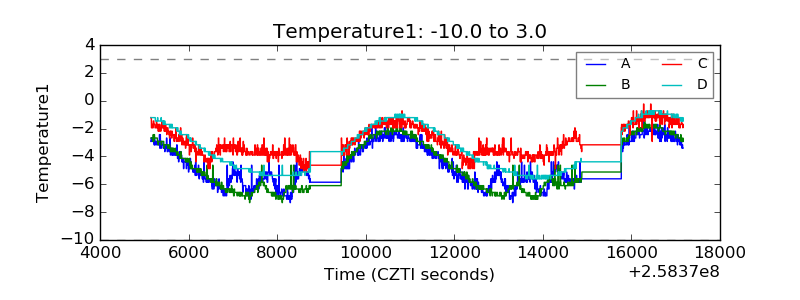 |
| Veto HV Monitor | 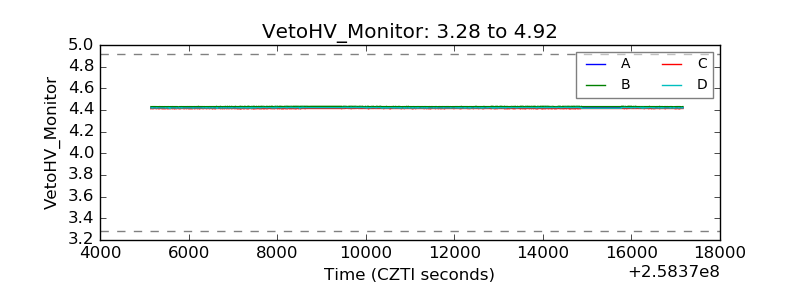 |
| Veto LLD | 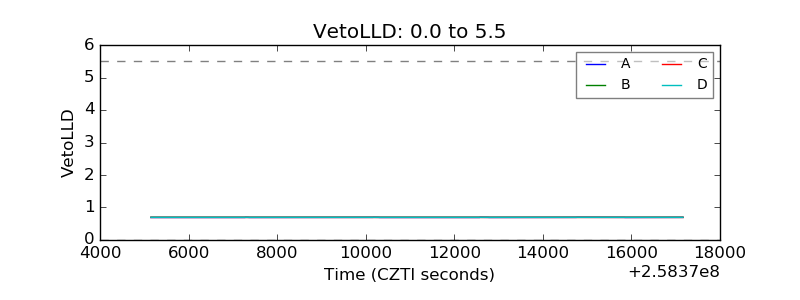 |
| Alpha Counter | 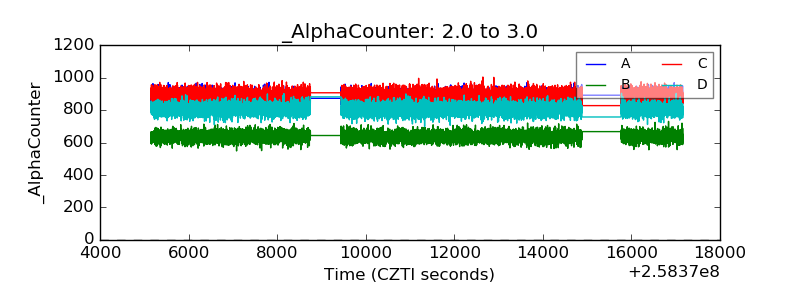 |
| _CPM_Rate | 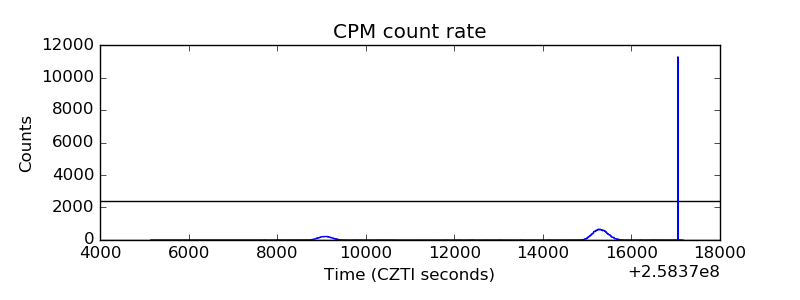 |
| CZT Counter | 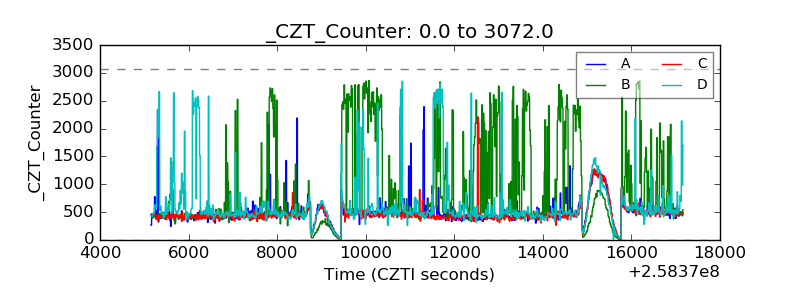 |
| +2.5 Volts monitor |  |
| +5 Volts monitor |  |
| _ROLL_ROT | 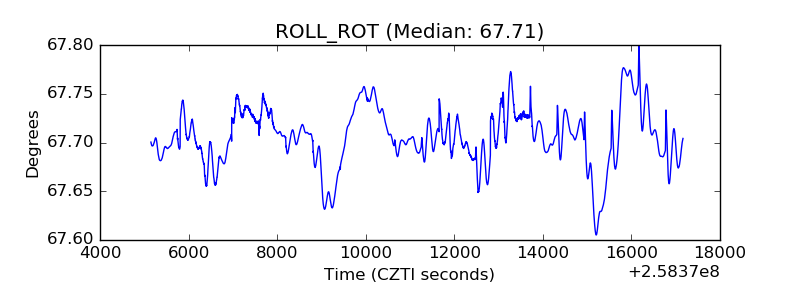 |
| _Roll_DEC | 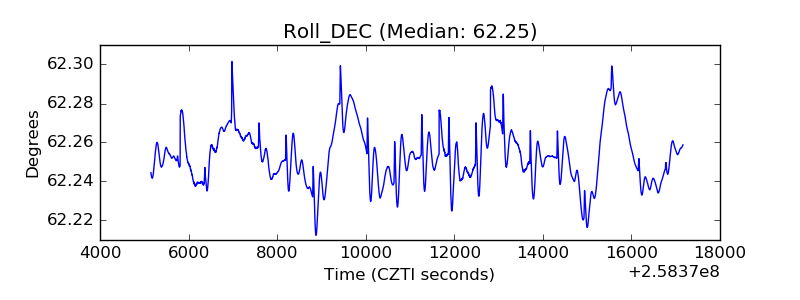 |
| _Roll_RA | 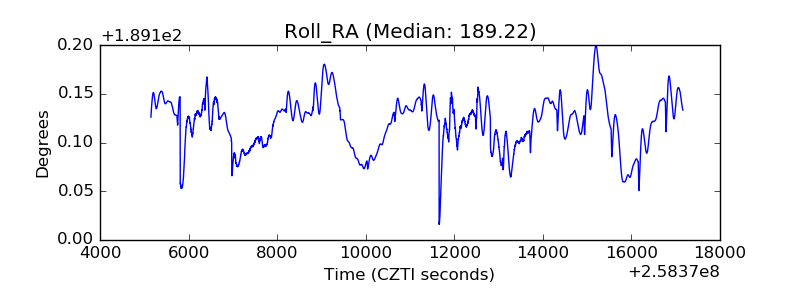 |
| Veto Counter | 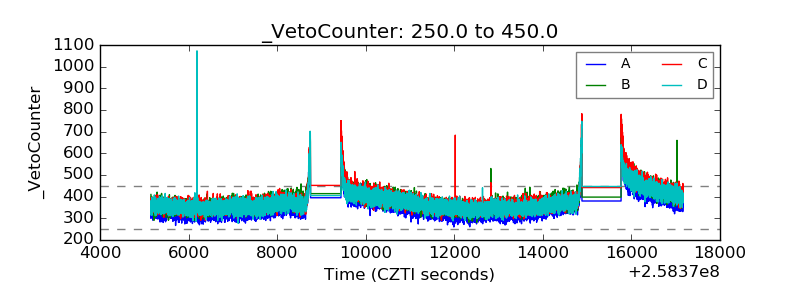 |