| Param | Original file | Final file |
|---|---|---|
| Filename | modeM0/AS1G08_077T01_9000001970_13239cztM0_level2.evt | modeM0/AS1G08_077T01_9000001970_13239cztM0_level2_quad_clean.evt |
| Size (bytes) | 568,379,520 | 89,023,680 |
| Size | 542.0 MB | 84.9 MB |
| Events in quadrant A | 3,216,646 | 585,200 |
| Events in quadrant B | 6,943,062 | 491,971 |
| Events in quadrant C | 3,053,966 | 593,839 |
| Events in quadrant D | 3,556,198 | 568,627 |
| Mode M9 | |||
|---|---|---|---|
| Quadrant | BADHDUFLAG | Total packets | Discarded packets |
| A | 0 | 19 | 0 |
| B | 0 | 19 | 0 |
| C | 0 | 19 | 0 |
| D | 0 | 19 | 0 |
| Mode SS | |||
|---|---|---|---|
| Quadrant | BADHDUFLAG | Total packets | Discarded packets |
| A | 0 | 136 | 0 |
| B | 0 | 136 | 0 |
| C | 0 | 136 | 0 |
| D | 0 | 136 | 0 |
| Mode M0 | |||
|---|---|---|---|
| Quadrant | BADHDUFLAG | Total packets | Discarded packets |
| A | 0 | 14100 | 3 |
| B | 0 | 25092 | 2 |
| C | 0 | 13532 | 2 |
| D | 0 | 15271 | 2 |
| Quadrant | Total seconds | Saturated seconds | Saturation percentage |
|---|---|---|---|
| A | 6528 | 103 | 1.577819% |
| B | 6528 | 1659 | 25.413603% |
| C | 6528 | 76 | 1.164216% |
| D | 6528 | 164 | 2.512255% |
Noise dominated data is calculated using 1-second bins in cleaned event files. If a bin has >2000 counts, and if more than 50% of those come from <1% of pixels, then it is considered to be noise-dominated and hence unusable.
| Quadrant | # 1 sec bins | Bins with >0 counts | Bins with >2000 counts | High rate bins dominated by noise | Noise dominated (total time) | Noise dominated (detector-on time) | Marked lightcurve |
|---|---|---|---|---|---|---|---|
| A | 8464 | 6531 | 9 | 9 | 0.11% | 0.14% |  |
| B | 8464 | 6529 | 1134 | 1134 | 13.40% | 17.37% |  |
| C | 8464 | 6531 | 1 | 1 | 0.01% | 0.02% |  |
| D | 8463 | 6530 | 64 | 64 | 0.76% | 0.98% |  |
Top three noisy pixels from each quadrant. If the there are fewer than three noisy pixels in the level2.evt file, extra rows are filled as -1
| Pixel properties | Quadrant properties | ||||||
|---|---|---|---|---|---|---|---|
| Quadrant | DetID | PixID | Counts | Sigma | Mean | Median | Sigma |
| A | 12 | 189 | 130001 | 807.5 | 787 | 768 | 160.0 |
| A | 15 | 69 | 35480 | 216.89 | 787 | 768 | 160.0 |
| A | 15 | 239 | 16476 | 98.15 | 787 | 768 | 160.0 |
| B | 4 | 239 | 4116900 | 31695.67 | 680 | 661 | 129.9 |
| B | 3 | 64 | 61808 | 470.84 | 680 | 661 | 129.9 |
| B | 0 | 230 | 35400 | 267.5 | 680 | 661 | 129.9 |
| C | 15 | 208 | 34382 | 188.88 | 774 | 778 | 177.9 |
| C | 13 | 61 | 5590 | 27.05 | 774 | 778 | 177.9 |
| C | 8 | 222 | 2596 | 10.22 | 774 | 778 | 177.9 |
| D | 10 | 157 | 326828 | 1772.48 | 764 | 741 | 184.0 |
| D | 14 | 34 | 117640 | 635.42 | 764 | 741 | 184.0 |
| D | 5 | 222 | 63213 | 339.57 | 764 | 741 | 184.0 |
Histogram calculated using DETX and DETY for each event in the final _common_clean file
| Quadrant A |  |
 |
Quadrant B |
|---|---|---|---|
| Quadrant D | 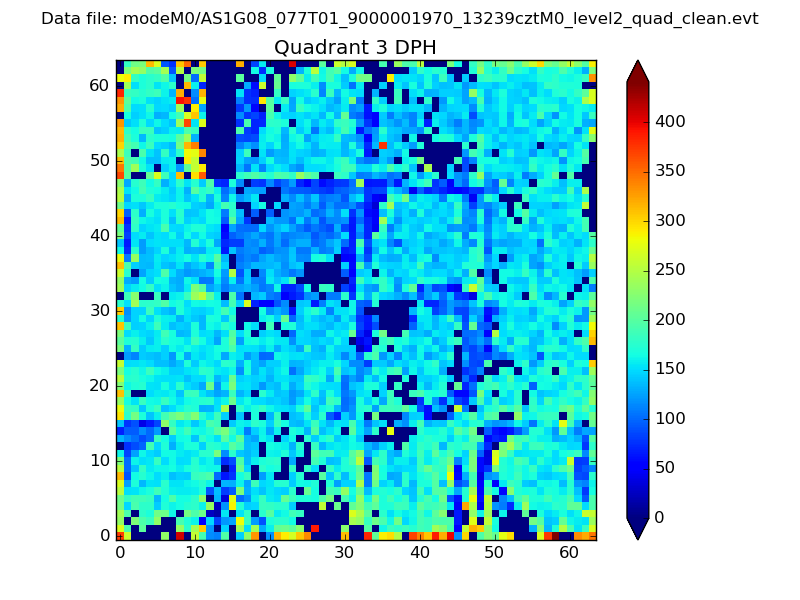 |
 |
Quadrant C |
| Plot type | Count rate plots | Images |
|---|---|---|
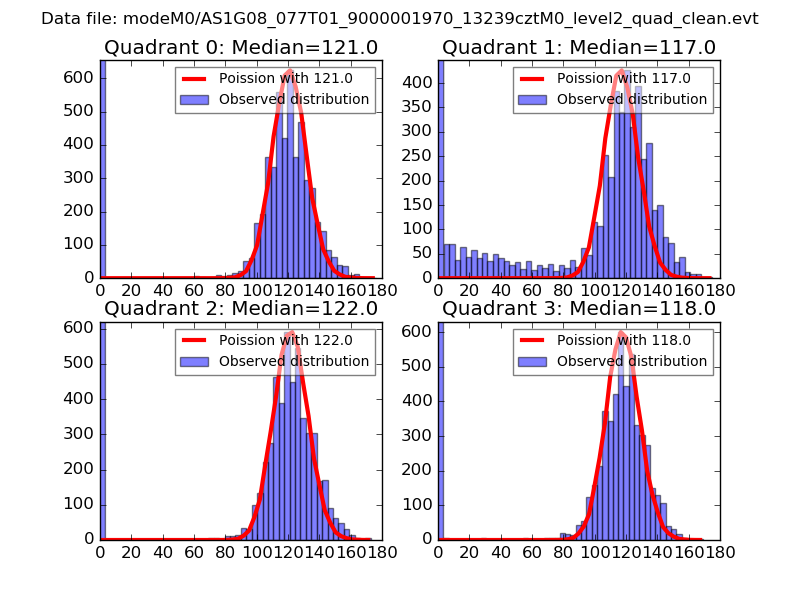
| Comparison with Poisson distribution Blue bars denote a histogram of data divided into 1 sec bins. Red curve is a Poisson curve with rate = median count rate of data. |
 |
 |
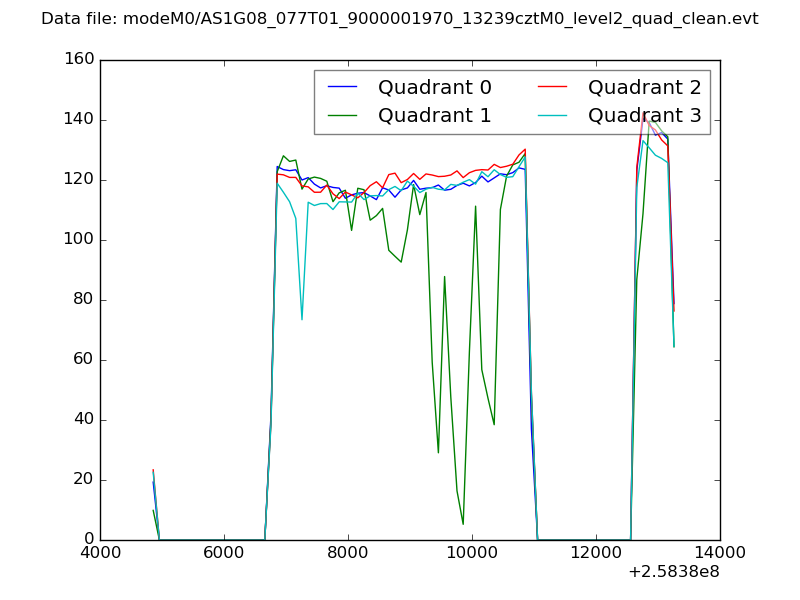
| Quadrant-wise count rates Data is divided into 100 sec bins |
 |
|
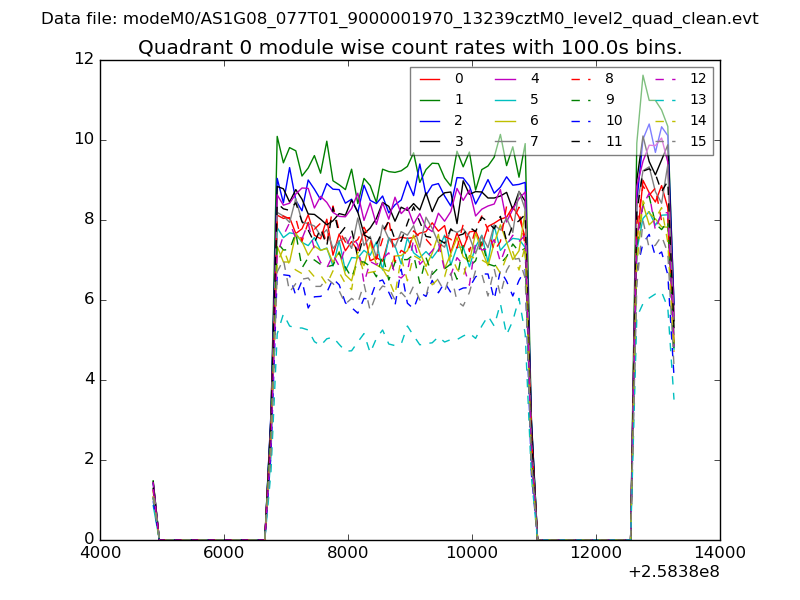
| Module-wise count rates for Quadrant A Data is divided into 100 sec bins |
 |
 |
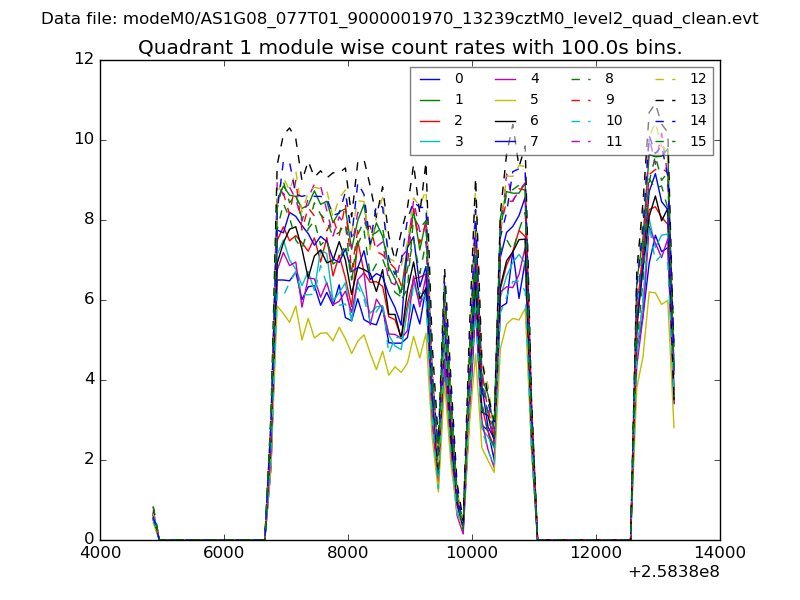
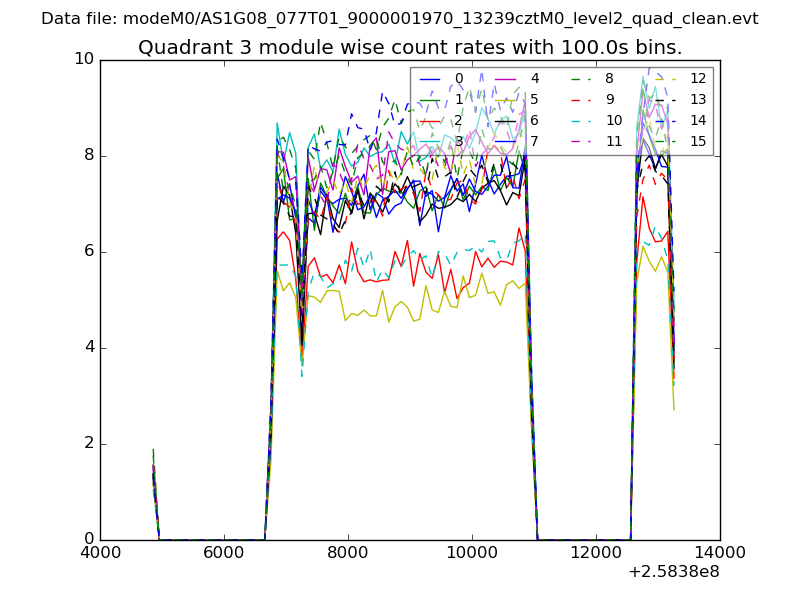
| Module-wise count rates for Quadrant B Data is divided into 100 sec bins |
 |
 |
| Module-wise count rates for Quadrant C Data is divided into 100 sec bins |
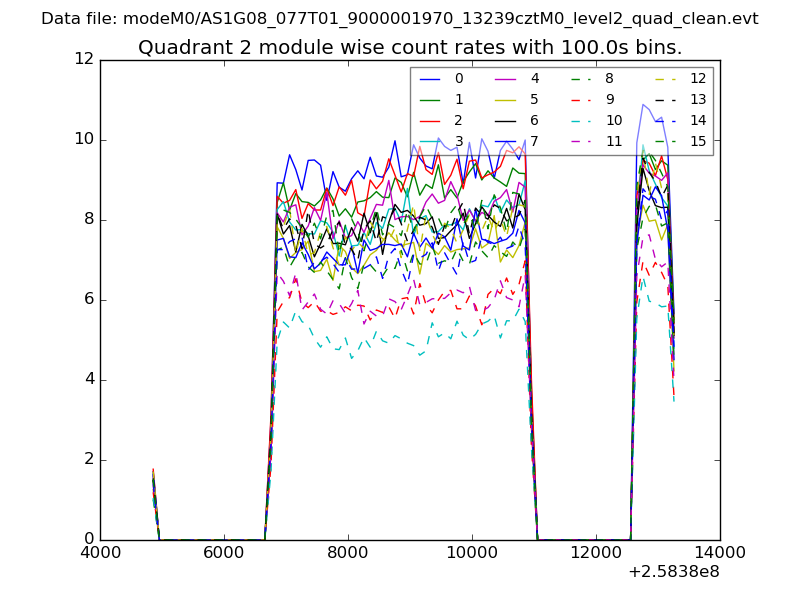 |
 |
| Module-wise count rates for Quadrant D Data is divided into 100 sec bins |
 |
 |
| Parameter | Plot |
|---|---|
| CZT HV Monitor | 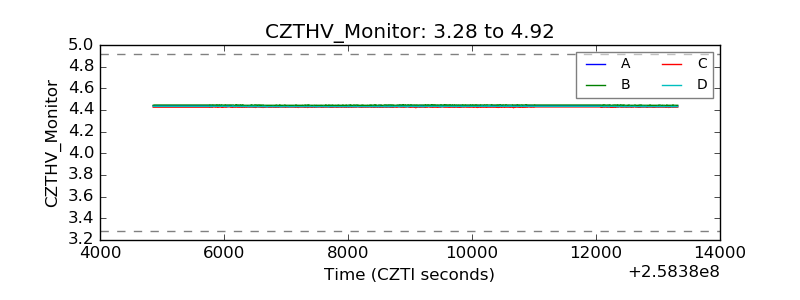 |
| D_VDD | 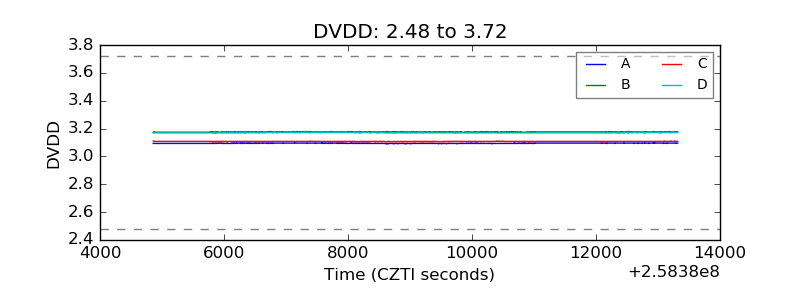 |
| Temperature 1 | 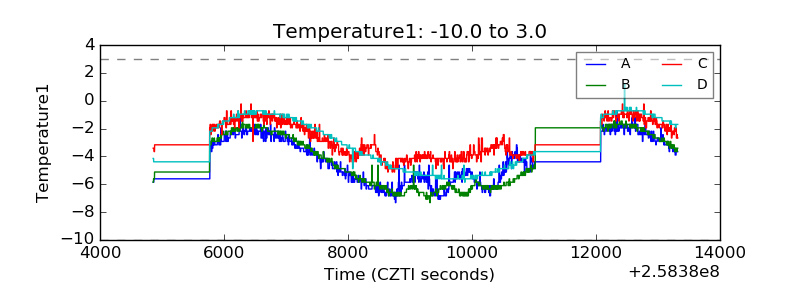 |
| Veto HV Monitor | 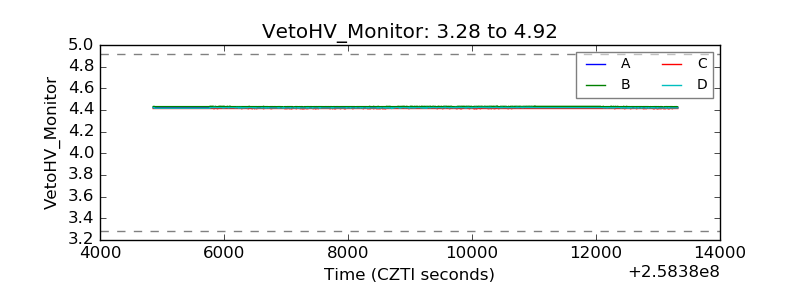 |
| Veto LLD | 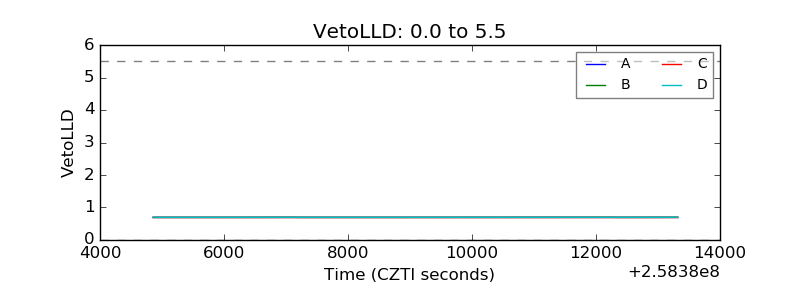 |
| Alpha Counter | 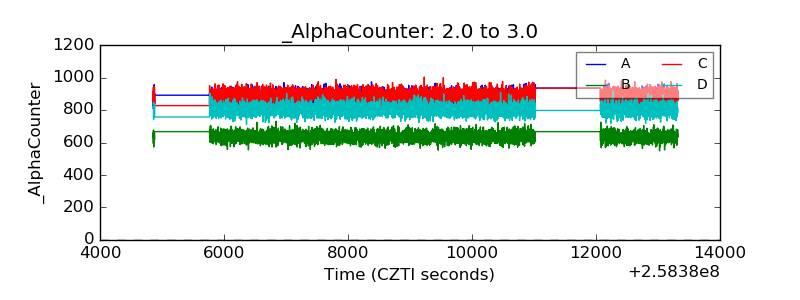 |
| _CPM_Rate | 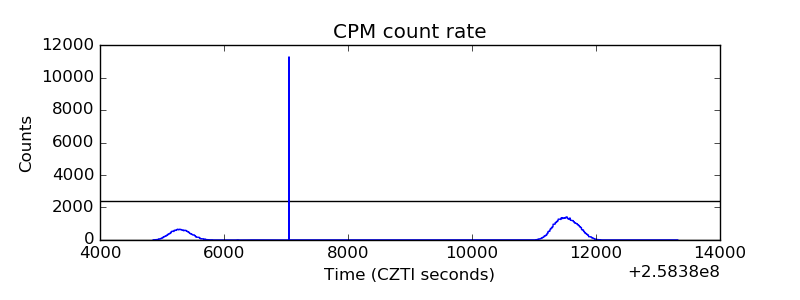 |
| CZT Counter | 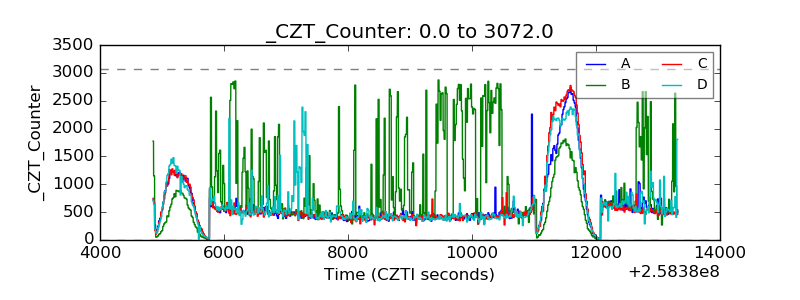 |
| +2.5 Volts monitor | 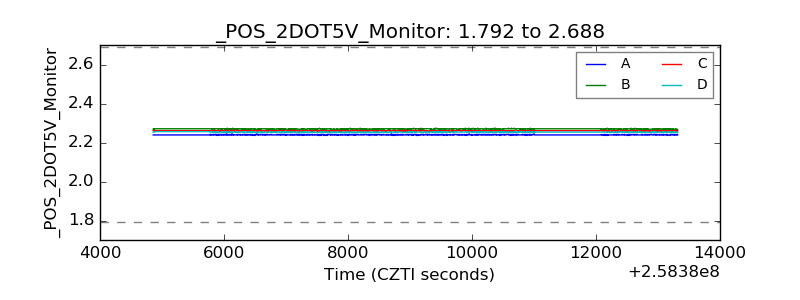 |
| +5 Volts monitor | 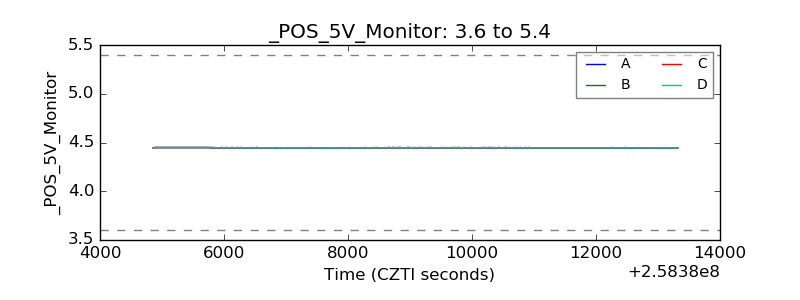 |
| _ROLL_ROT | 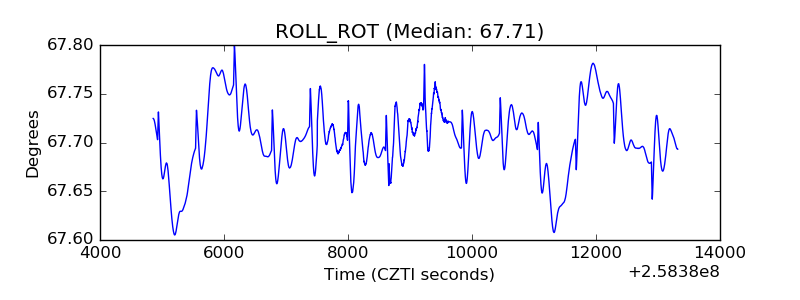 |
| _Roll_DEC | 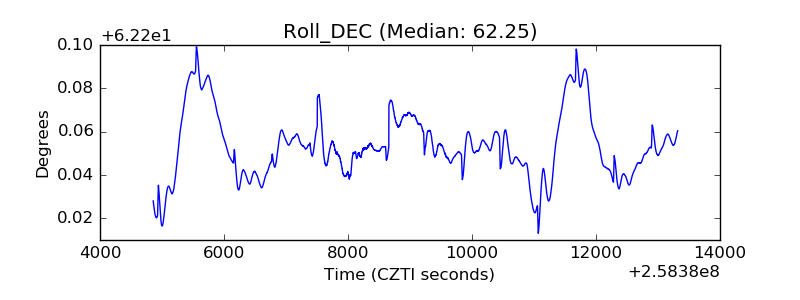 |
| _Roll_RA | 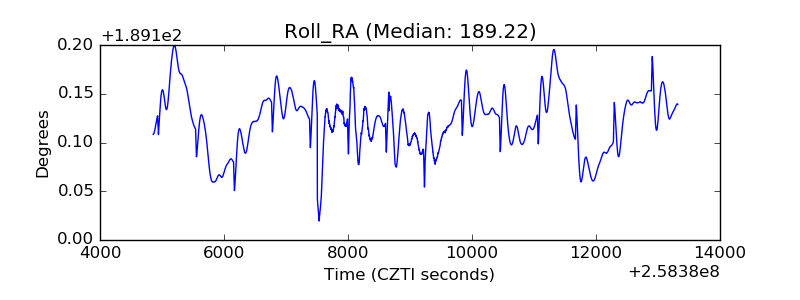 |
| Veto Counter |  |