| Param | Original file | Final file |
|---|---|---|
| Filename | modeM0/AS1G08_077T01_9000001970_13241cztM0_level2.evt | modeM0/AS1G08_077T01_9000001970_13241cztM0_level2_quad_clean.evt |
| Size (bytes) | 583,341,120 | 100,209,600 |
| Size | 556.3 MB | 95.6 MB |
| Events in quadrant A | 3,178,056 | 684,118 |
| Events in quadrant B | 7,432,192 | 540,825 |
| Events in quadrant C | 3,068,827 | 699,909 |
| Events in quadrant D | 3,554,321 | 663,961 |
| Mode M9 | |||
|---|---|---|---|
| Quadrant | BADHDUFLAG | Total packets | Discarded packets |
| A | 0 | 22 | 0 |
| B | 0 | 22 | 0 |
| C | 0 | 22 | 0 |
| D | 0 | 22 | 0 |
| Mode SS | |||
|---|---|---|---|
| Quadrant | BADHDUFLAG | Total packets | Discarded packets |
| A | 0 | 132 | 0 |
| B | 0 | 132 | 0 |
| C | 0 | 132 | 0 |
| D | 0 | 132 | 0 |
| Mode M0 | |||
|---|---|---|---|
| Quadrant | BADHDUFLAG | Total packets | Discarded packets |
| A | 0 | 13980 | 3 |
| B | 0 | 26445 | 2 |
| C | 0 | 13504 | 2 |
| D | 0 | 15215 | 2 |
| Quadrant | Total seconds | Saturated seconds | Saturation percentage |
|---|---|---|---|
| A | 6382 | 62 | 0.971482% |
| B | 6382 | 1892 | 29.645879% |
| C | 6382 | 41 | 0.642432% |
| D | 6382 | 164 | 2.569727% |
Noise dominated data is calculated using 1-second bins in cleaned event files. If a bin has >2000 counts, and if more than 50% of those come from <1% of pixels, then it is considered to be noise-dominated and hence unusable.
| Quadrant | # 1 sec bins | Bins with >0 counts | Bins with >2000 counts | High rate bins dominated by noise | Noise dominated (total time) | Noise dominated (detector-on time) | Marked lightcurve |
|---|---|---|---|---|---|---|---|
| A | 8608 | 6385 | 0 | 0 | 0.00% | 0.00% | 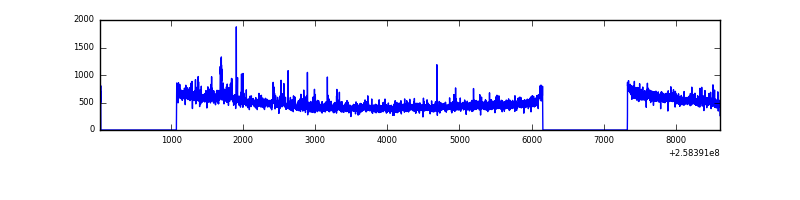 |
| B | 8608 | 6384 | 1329 | 1329 | 15.44% | 20.82% | 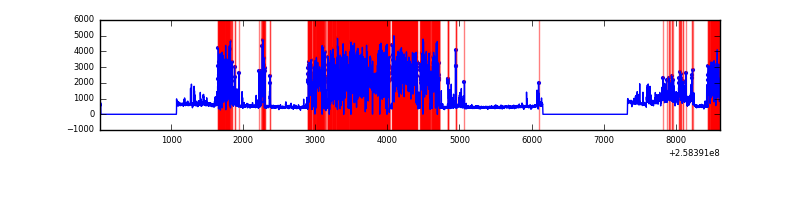 |
| C | 8608 | 6385 | 1 | 1 | 0.01% | 0.02% | 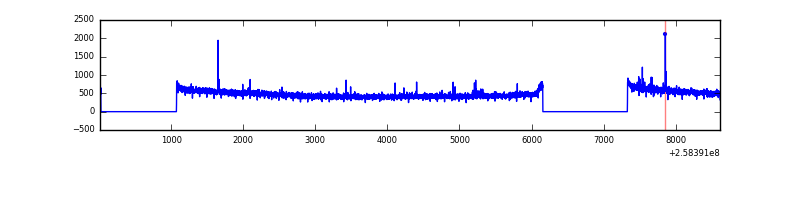 |
| D | 8608 | 6385 | 102 | 102 | 1.18% | 1.60% | 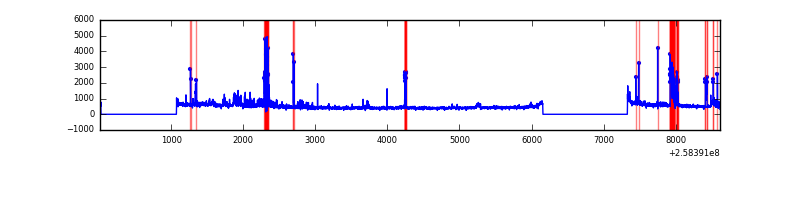 |
Top three noisy pixels from each quadrant. If the there are fewer than three noisy pixels in the level2.evt file, extra rows are filled as -1
| Pixel properties | Quadrant properties | ||||||
|---|---|---|---|---|---|---|---|
| Quadrant | DetID | PixID | Counts | Sigma | Mean | Median | Sigma |
| A | 12 | 189 | 107821 | 670.22 | 789 | 772 | 159.7 |
| A | 15 | 239 | 23192 | 140.37 | 789 | 772 | 159.7 |
| A | 1 | 162 | 11148 | 64.96 | 789 | 772 | 159.7 |
| B | 4 | 239 | 4714767 | 37092.38 | 671 | 655 | 127.1 |
| B | 3 | 64 | 27852 | 214.0 | 671 | 655 | 127.1 |
| B | 0 | 230 | 18685 | 141.87 | 671 | 655 | 127.1 |
| C | 15 | 208 | 23653 | 127.89 | 781 | 787 | 178.8 |
| C | 13 | 61 | 5676 | 27.34 | 781 | 787 | 178.8 |
| C | 8 | 222 | 2483 | 9.49 | 781 | 787 | 178.8 |
| D | 10 | 157 | 284392 | 1545.91 | 768 | 746 | 183.5 |
| D | 1 | 52 | 178573 | 969.18 | 768 | 746 | 183.5 |
| D | 5 | 222 | 63819 | 343.76 | 768 | 746 | 183.5 |
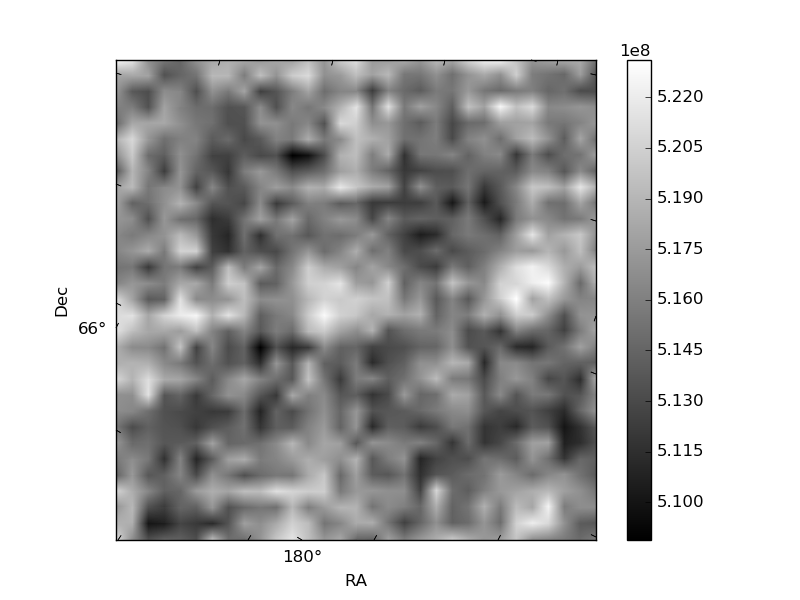
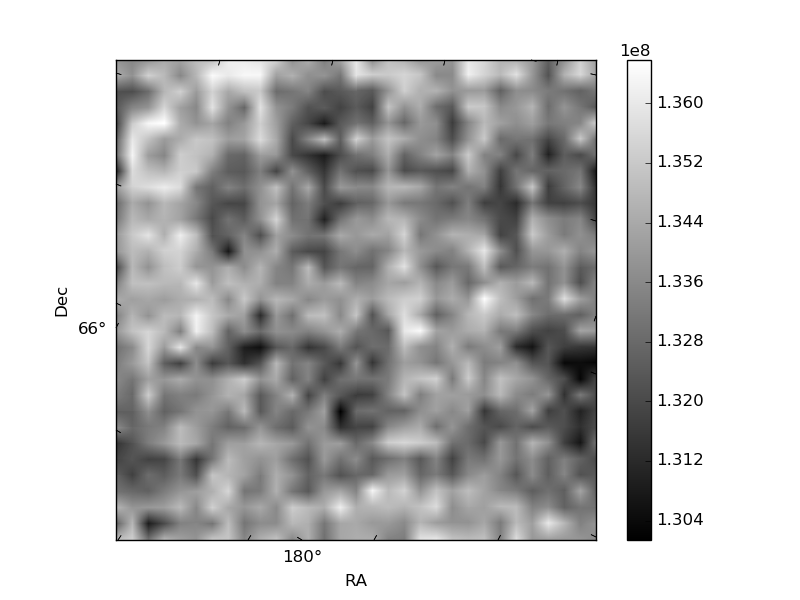
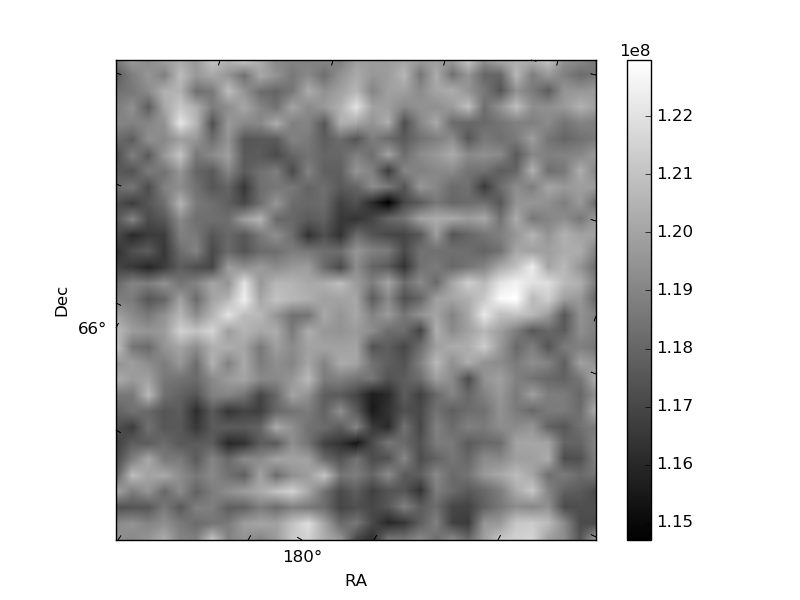
Histogram calculated using DETX and DETY for each event in the final _common_clean file
| Quadrant A | 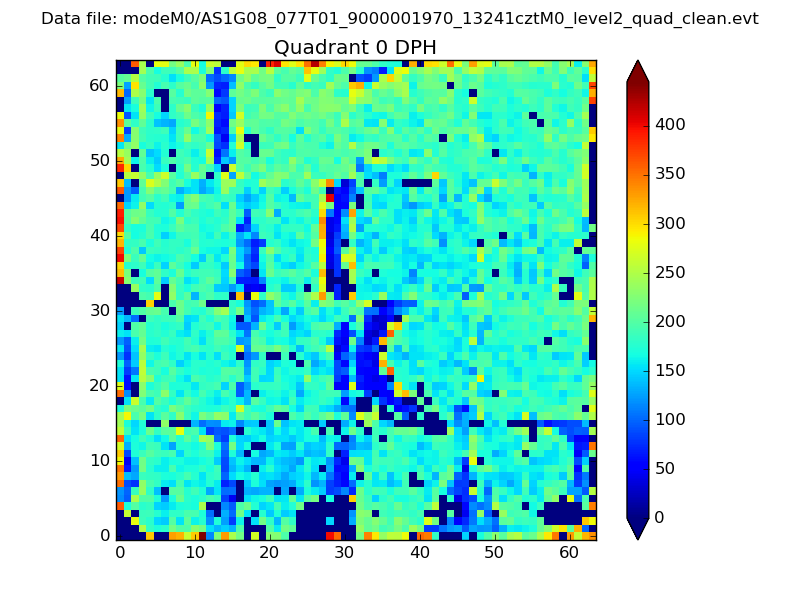 |
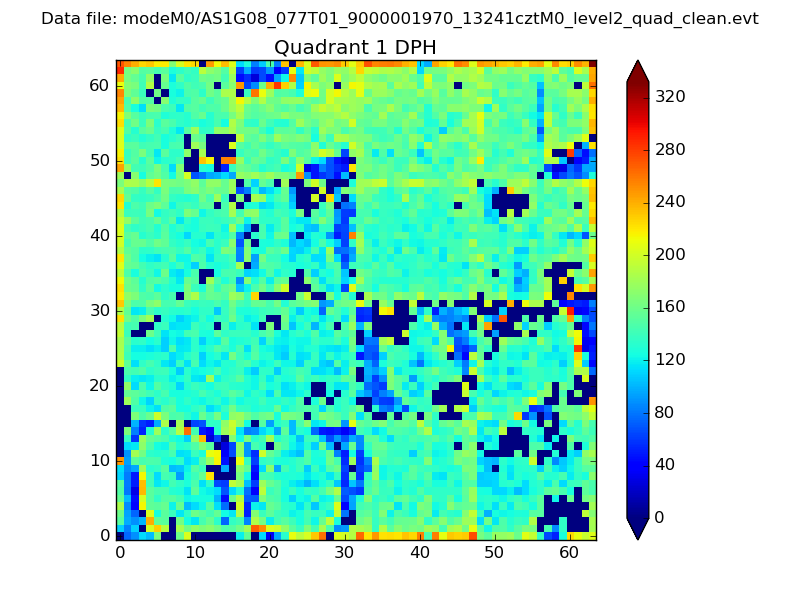 |
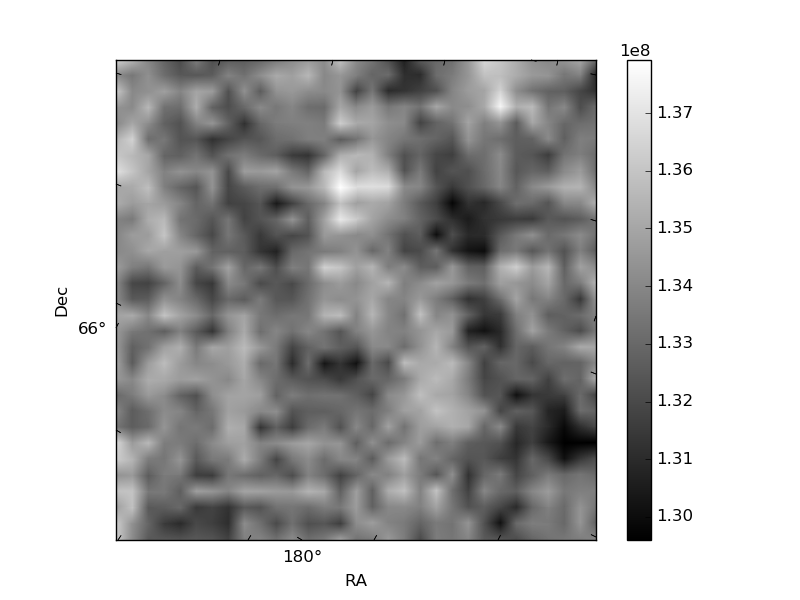
Quadrant B |
|---|---|---|---|
| Quadrant D | 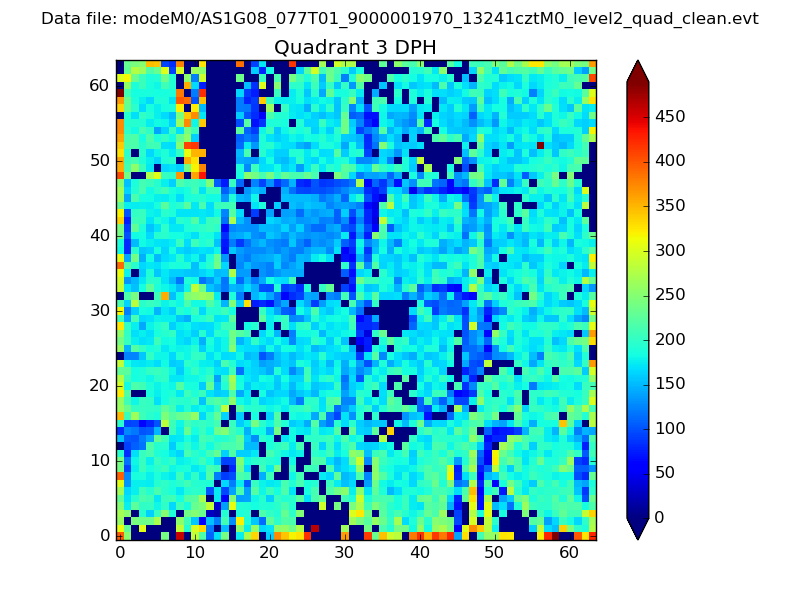 |
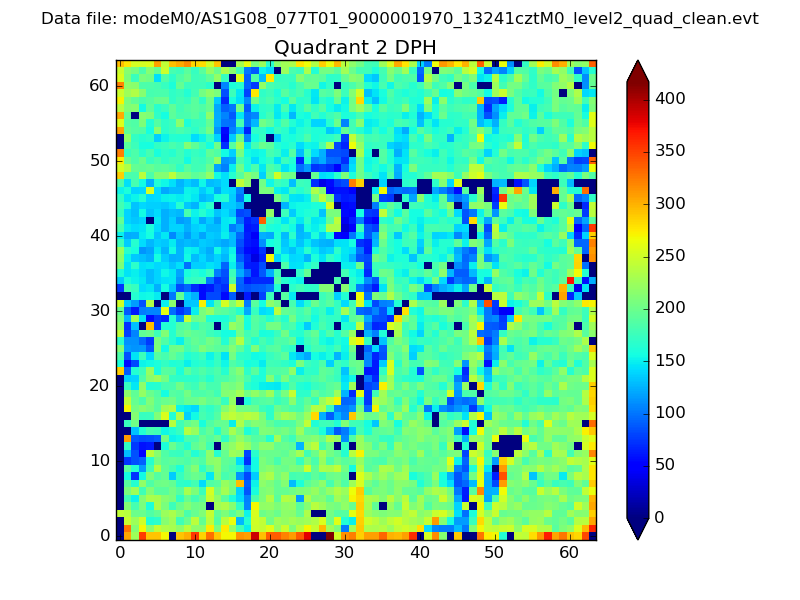 |
Quadrant C |
| Plot type | Count rate plots | Images |
|---|---|---|
| Comparison with Poisson distribution Blue bars denote a histogram of data divided into 1 sec bins. Red curve is a Poisson curve with rate = median count rate of data. |
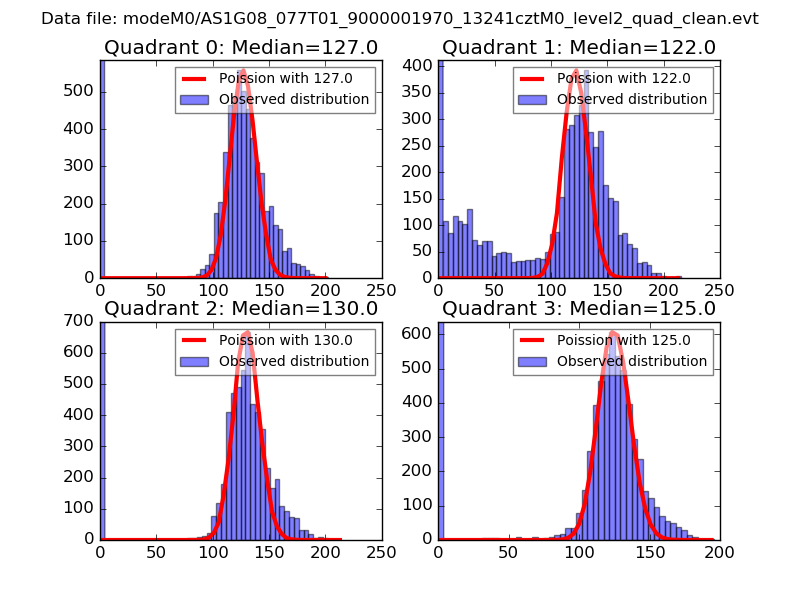 |
 |
| Quadrant-wise count rates Data is divided into 100 sec bins |
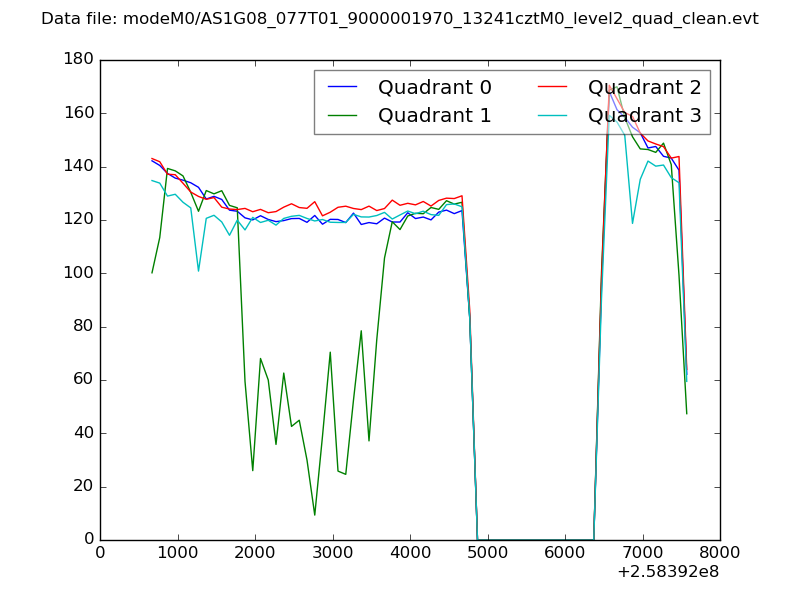 |
|
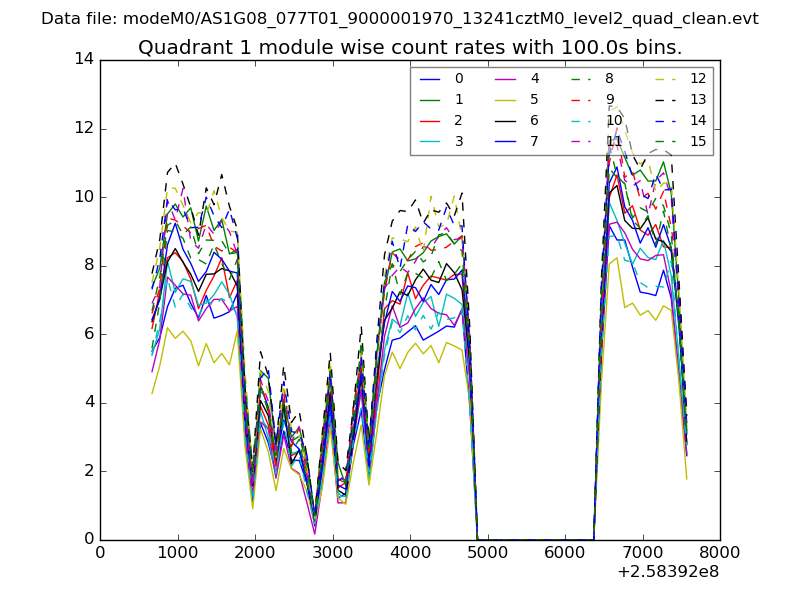
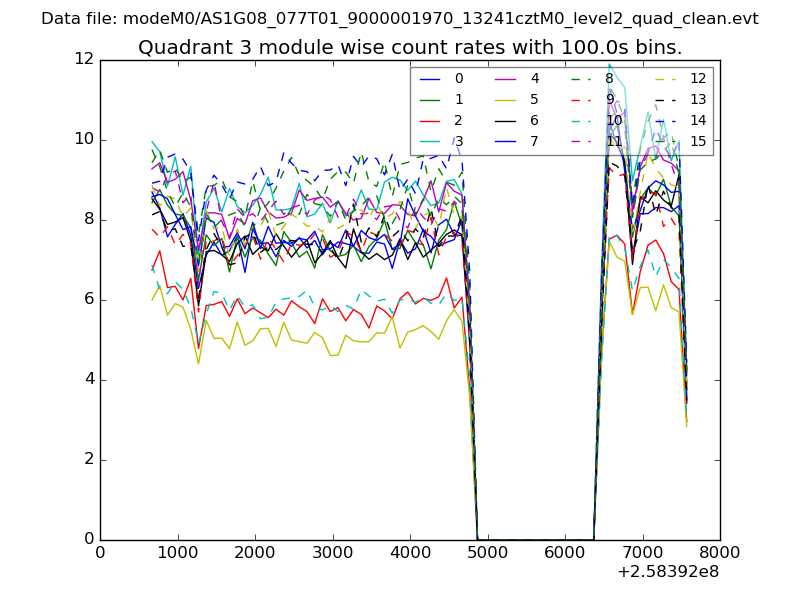
| Module-wise count rates for Quadrant A Data is divided into 100 sec bins |
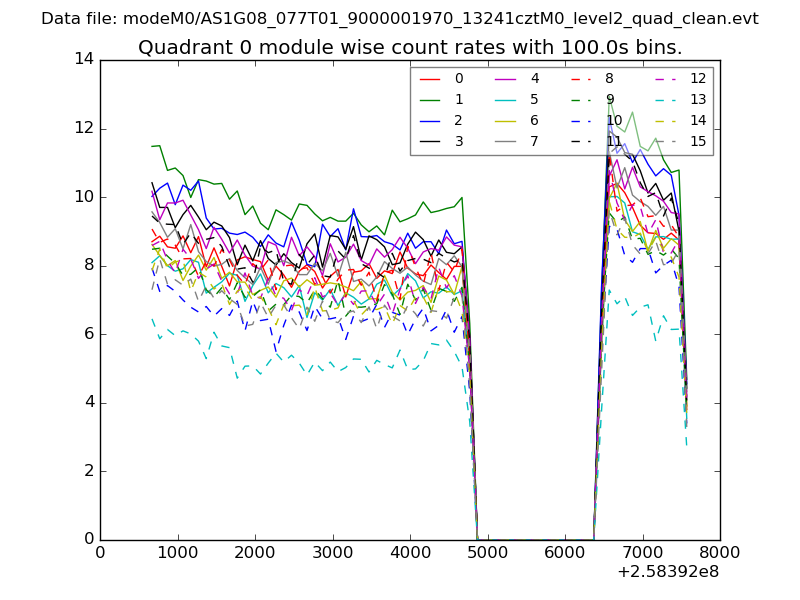 |
 |
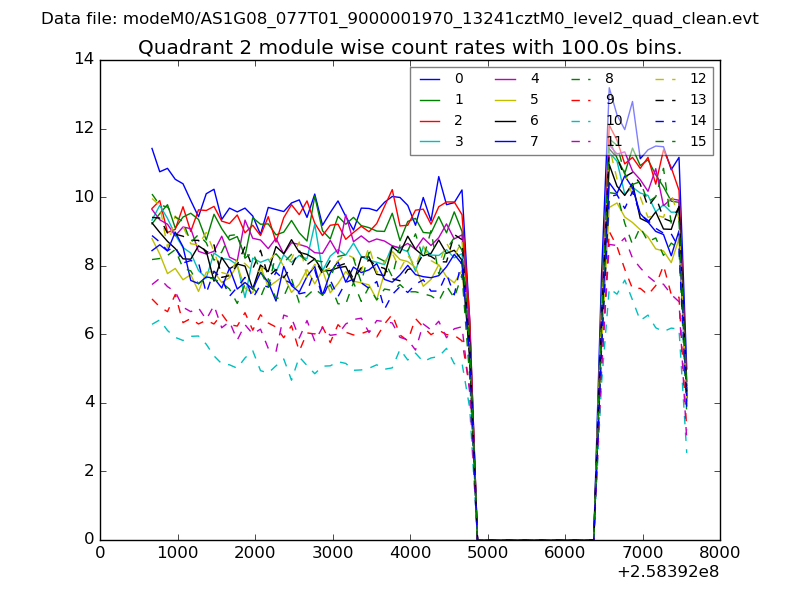
| Module-wise count rates for Quadrant B Data is divided into 100 sec bins |
 |
 |
| Module-wise count rates for Quadrant C Data is divided into 100 sec bins |
 |
 |
| Module-wise count rates for Quadrant D Data is divided into 100 sec bins |
 |
 |
| Parameter | Plot |
|---|---|
| CZT HV Monitor | 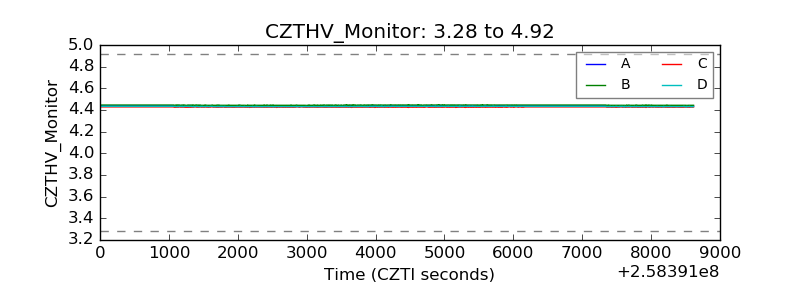 |
| D_VDD | 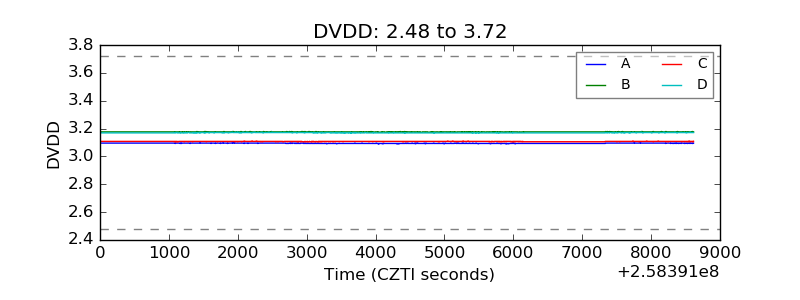 |
| Temperature 1 | 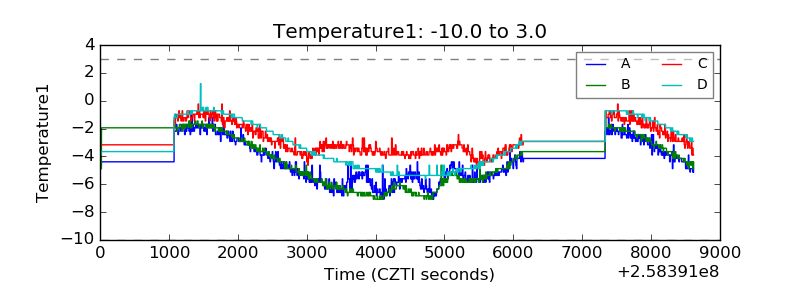 |
| Veto HV Monitor |  |
| Veto LLD | 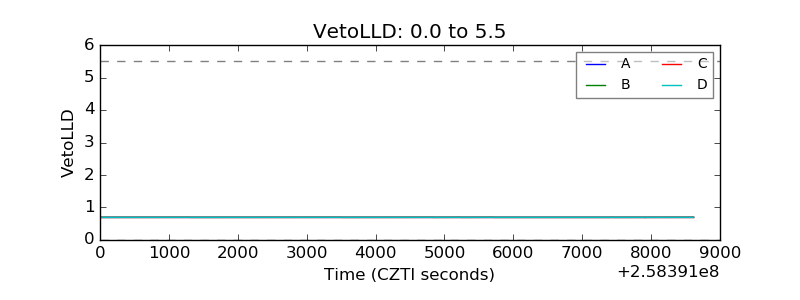 |
| Alpha Counter | 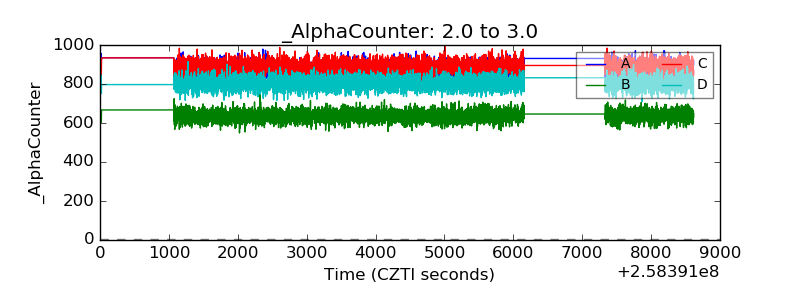 |
| _CPM_Rate | 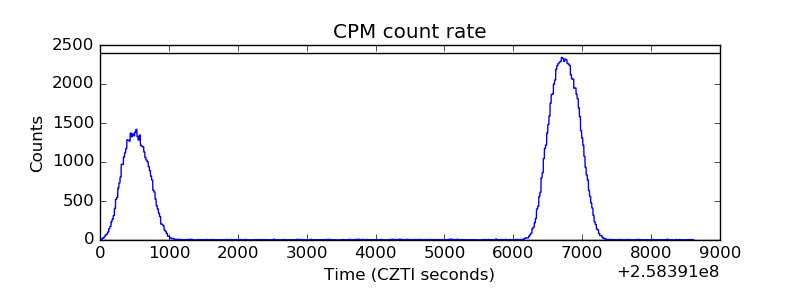 |
| CZT Counter | 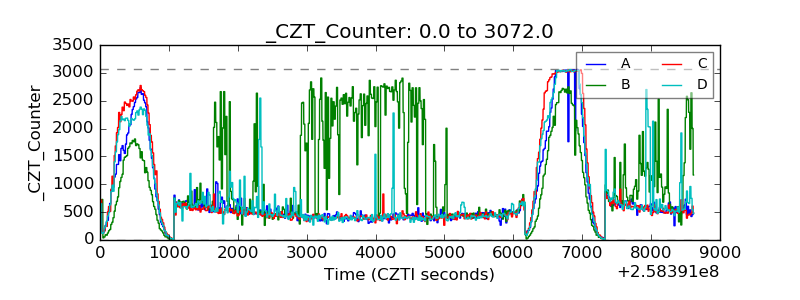 |
| +2.5 Volts monitor |  |
| +5 Volts monitor |  |
| _ROLL_ROT | 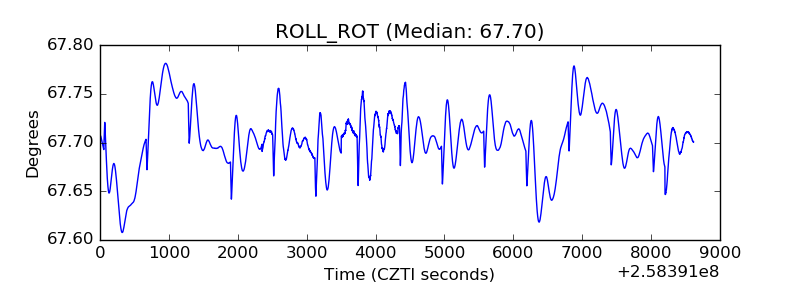 |
| _Roll_DEC | 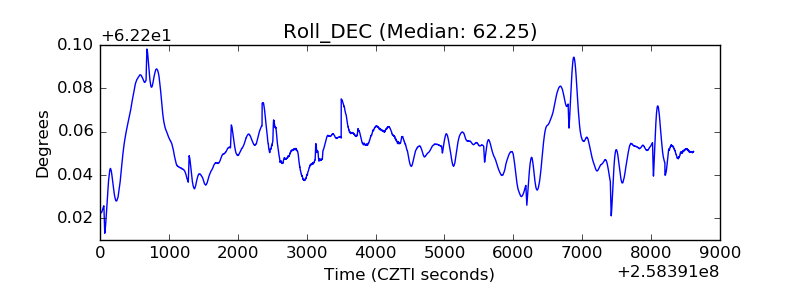 |
| _Roll_RA | 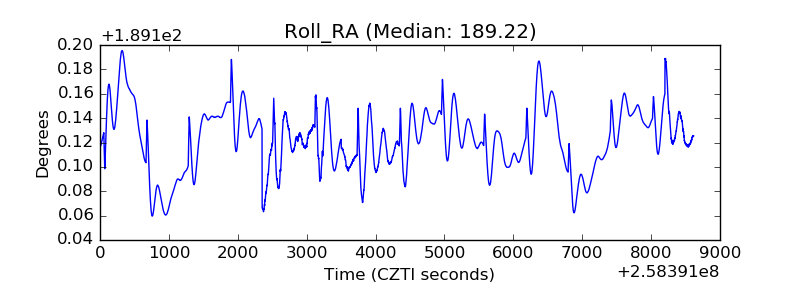 |
| Veto Counter | 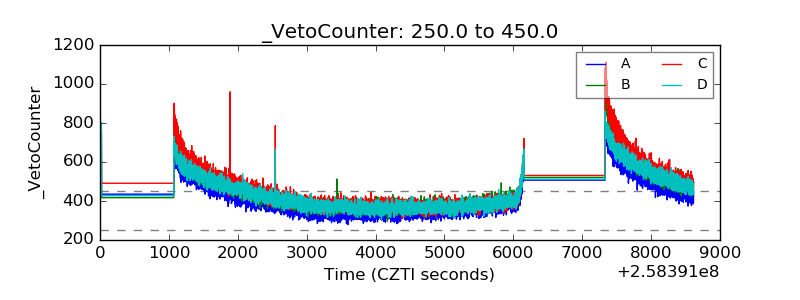 |