| Param | Original file | Final file |
|---|---|---|
| Filename | modeM0/AS1G08_077T01_9000001970_13242cztM0_level2.evt | modeM0/AS1G08_077T01_9000001970_13242cztM0_level2_quad_clean.evt |
| Size (bytes) | 571,256,640 | 110,131,200 |
| Size | 544.8 MB | 105.0 MB |
| Events in quadrant A | 3,211,087 | 750,078 |
| Events in quadrant B | 7,251,325 | 636,738 |
| Events in quadrant C | 3,075,301 | 781,471 |
| Events in quadrant D | 3,341,453 | 733,139 |
| Mode M9 | |||
|---|---|---|---|
| Quadrant | BADHDUFLAG | Total packets | Discarded packets |
| A | 0 | 19 | 0 |
| B | 0 | 19 | 0 |
| C | 0 | 19 | 0 |
| D | 0 | 20 | 0 |
| Mode SS | |||
|---|---|---|---|
| Quadrant | BADHDUFLAG | Total packets | Discarded packets |
| A | 0 | 126 | 0 |
| B | 0 | 126 | 0 |
| C | 0 | 126 | 0 |
| D | 0 | 126 | 0 |
| Mode M0 | |||
|---|---|---|---|
| Quadrant | BADHDUFLAG | Total packets | Discarded packets |
| A | 0 | 13821 | 3 |
| B | 0 | 25824 | 2 |
| C | 0 | 13387 | 2 |
| D | 0 | 14219 | 2 |
| Quadrant | Total seconds | Saturated seconds | Saturation percentage |
|---|---|---|---|
| A | 6211 | 58 | 0.933827% |
| B | 6211 | 1867 | 30.059572% |
| C | 6211 | 29 | 0.466914% |
| D | 6211 | 115 | 1.851554% |
Noise dominated data is calculated using 1-second bins in cleaned event files. If a bin has >2000 counts, and if more than 50% of those come from <1% of pixels, then it is considered to be noise-dominated and hence unusable.
| Quadrant | # 1 sec bins | Bins with >0 counts | Bins with >2000 counts | High rate bins dominated by noise | Noise dominated (total time) | Noise dominated (detector-on time) | Marked lightcurve |
|---|---|---|---|---|---|---|---|
| A | 7507 | 6213 | 0 | 0 | 0.00% | 0.00% | 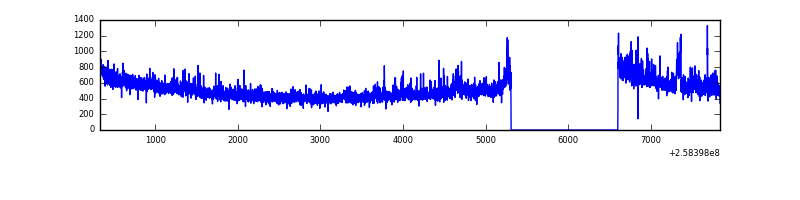 |
| B | 7507 | 6212 | 1076 | 1076 | 14.33% | 17.32% | 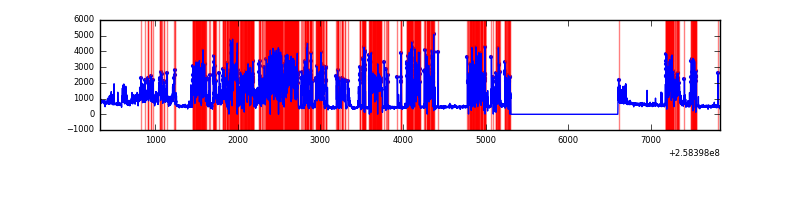 |
| C | 7507 | 6213 | 1 | 1 | 0.01% | 0.02% | 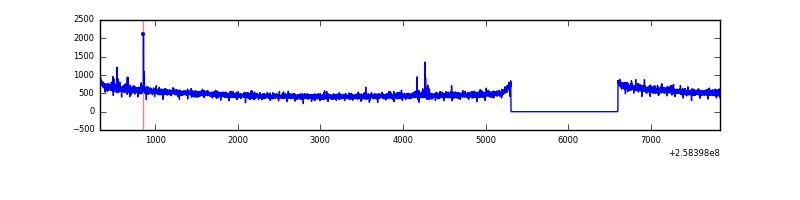 |
| D | 7507 | 6213 | 72 | 72 | 0.96% | 1.16% | 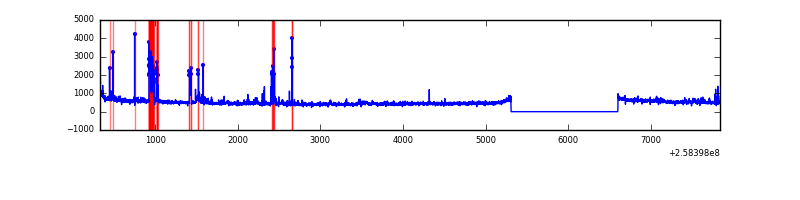 |
Top three noisy pixels from each quadrant. If the there are fewer than three noisy pixels in the level2.evt file, extra rows are filled as -1
| Pixel properties | Quadrant properties | ||||||
|---|---|---|---|---|---|---|---|
| Quadrant | DetID | PixID | Counts | Sigma | Mean | Median | Sigma |
| A | 15 | 239 | 104321 | 656.44 | 779 | 765 | 157.8 |
| A | 12 | 189 | 89856 | 564.75 | 779 | 765 | 157.8 |
| A | 1 | 162 | 9287 | 54.02 | 779 | 765 | 157.8 |
| B | 4 | 239 | 4679771 | 39254.54 | 644 | 629 | 119.2 |
| B | 0 | 214 | 15390 | 123.83 | 644 | 629 | 119.2 |
| B | 0 | 197 | 12601 | 100.44 | 644 | 629 | 119.2 |
| C | 15 | 208 | 21519 | 116.75 | 781 | 789 | 177.6 |
| C | 13 | 61 | 5793 | 28.18 | 781 | 789 | 177.6 |
| C | 8 | 128 | 3956 | 17.84 | 781 | 789 | 177.6 |
| D | 1 | 52 | 165873 | 900.59 | 768 | 747 | 183.4 |
| D | 10 | 157 | 76847 | 415.04 | 768 | 747 | 183.4 |
| D | 5 | 222 | 76504 | 413.17 | 768 | 747 | 183.4 |
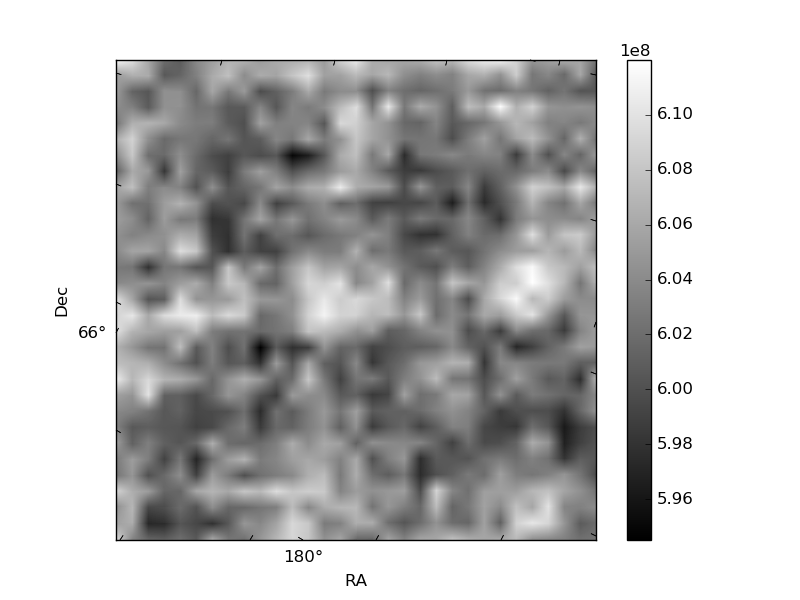
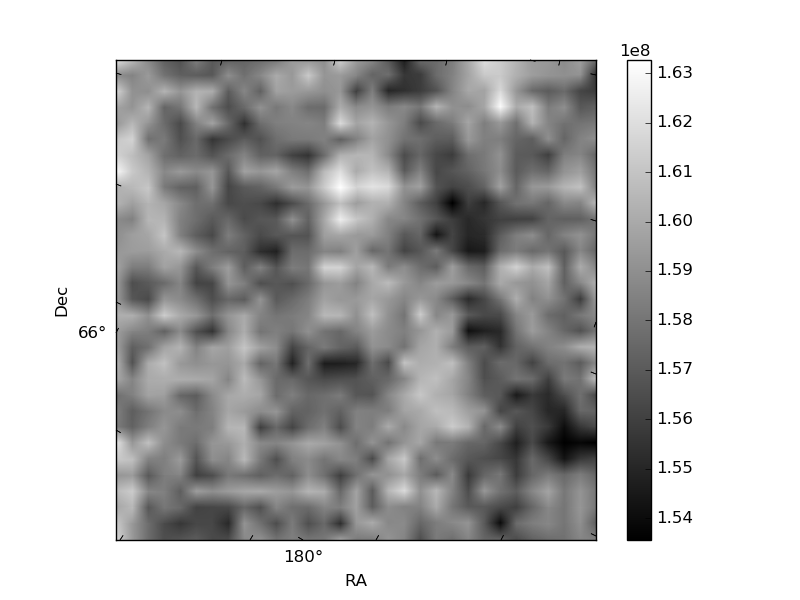
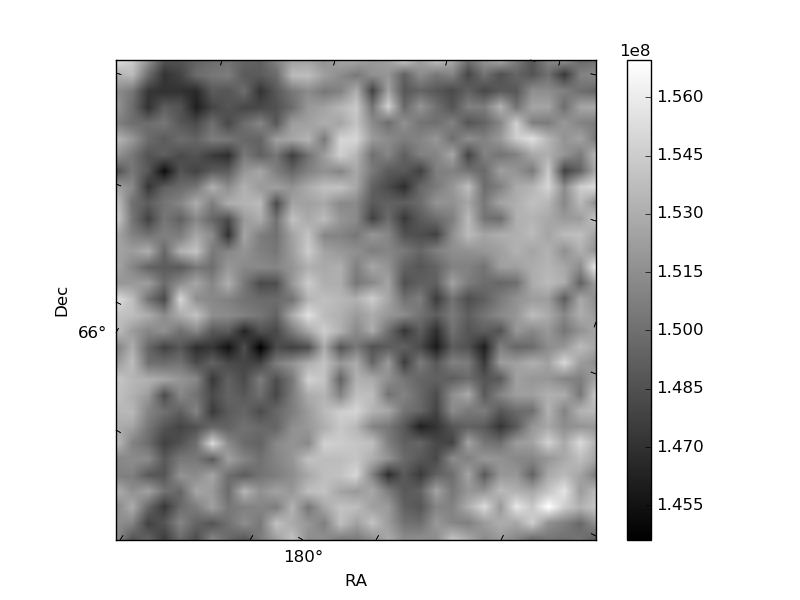
Histogram calculated using DETX and DETY for each event in the final _common_clean file
| Quadrant A | 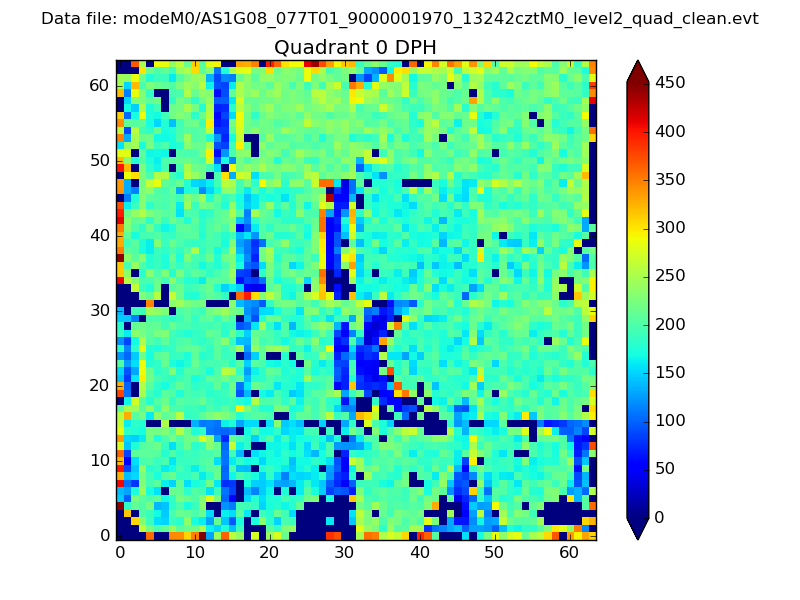 |
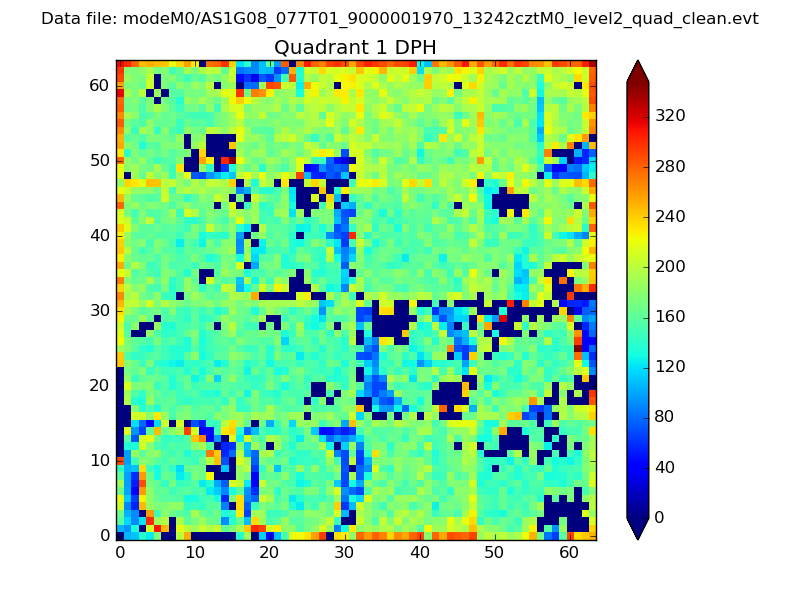 |
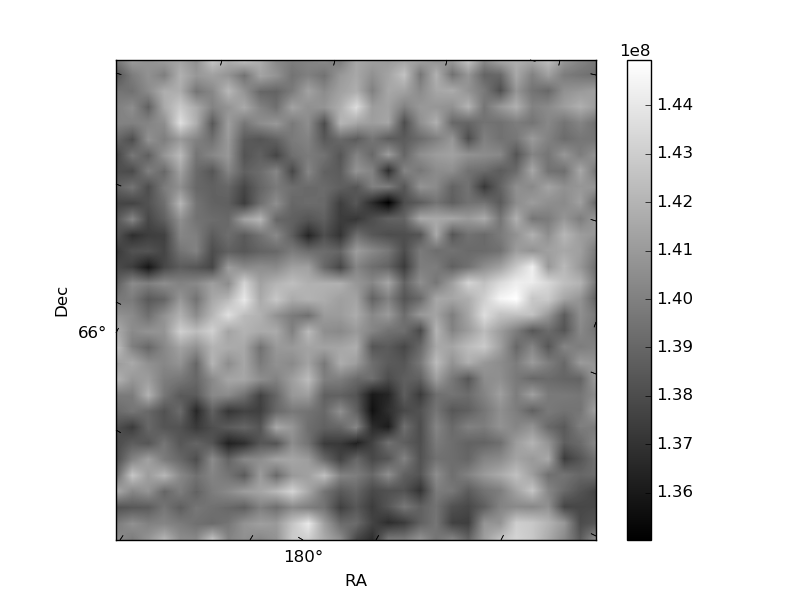
Quadrant B |
|---|---|---|---|
| Quadrant D | 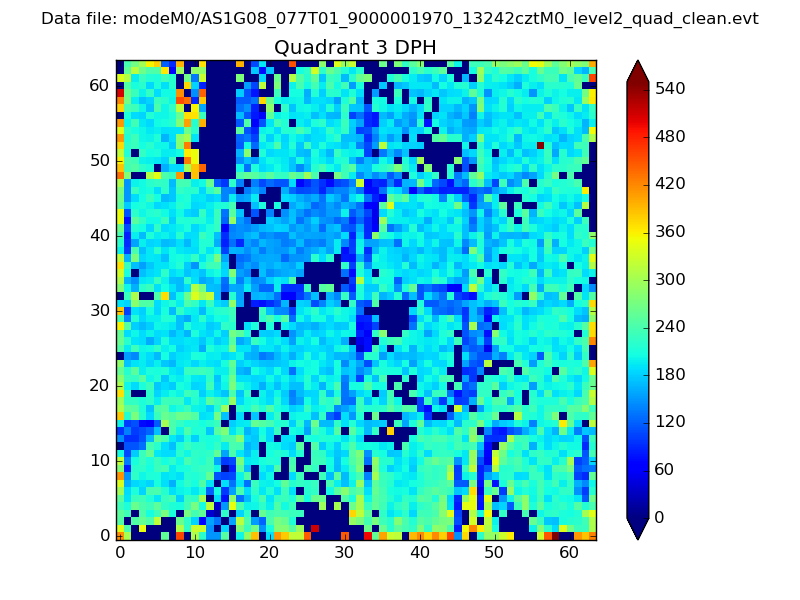 |
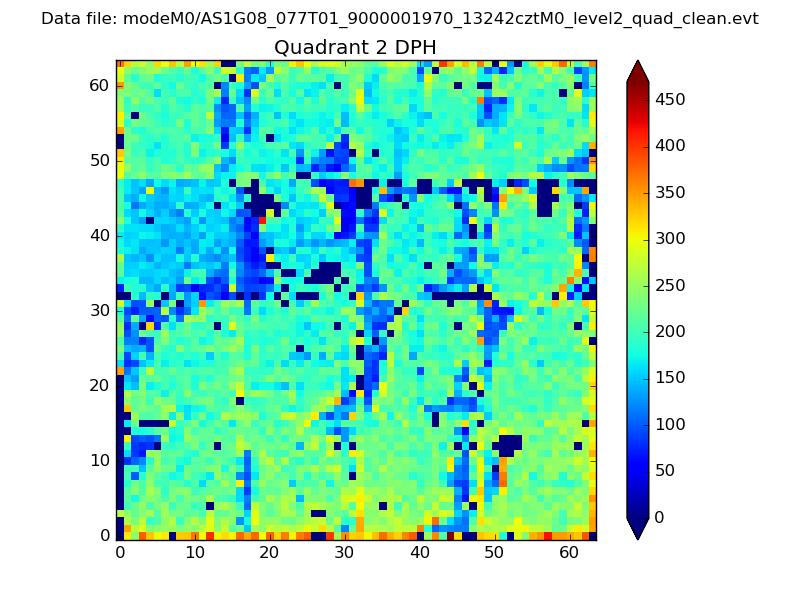 |
Quadrant C |
| Plot type | Count rate plots | Images |
|---|---|---|
| Comparison with Poisson distribution Blue bars denote a histogram of data divided into 1 sec bins. Red curve is a Poisson curve with rate = median count rate of data. |
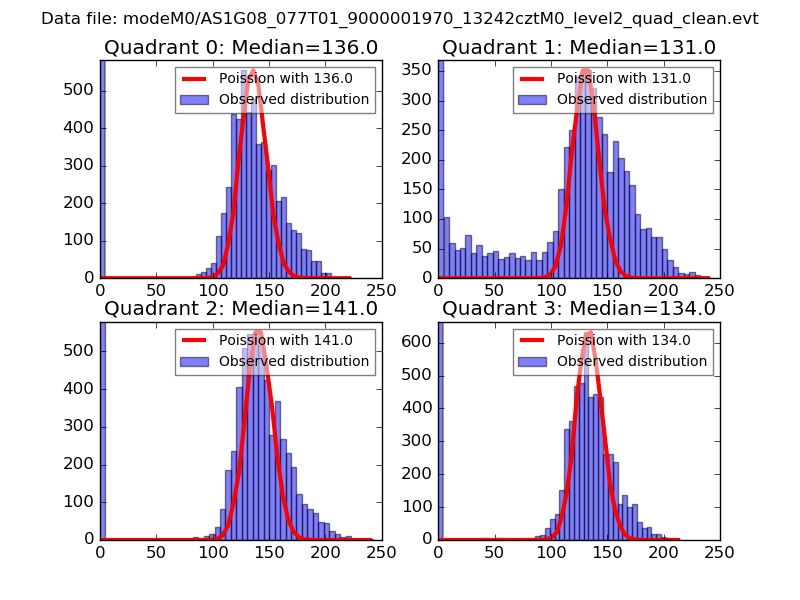 |
 |
| Quadrant-wise count rates Data is divided into 100 sec bins |
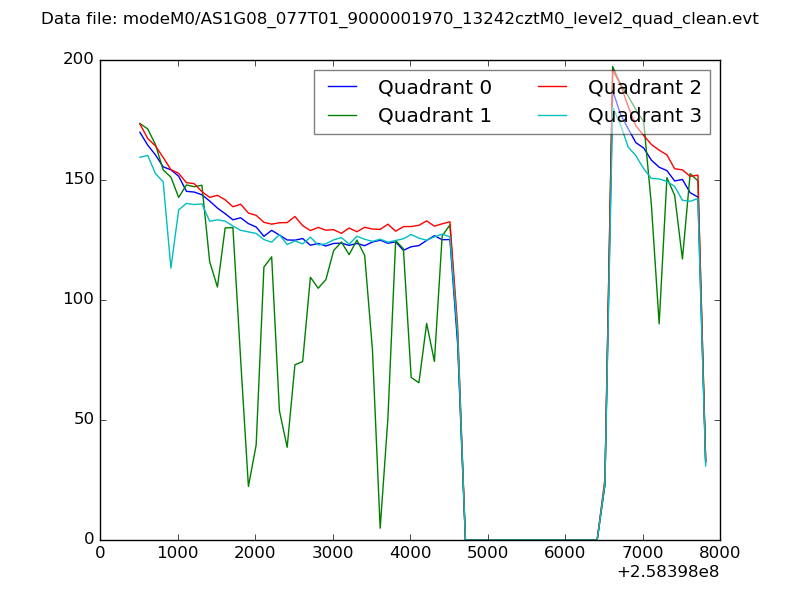 |
|
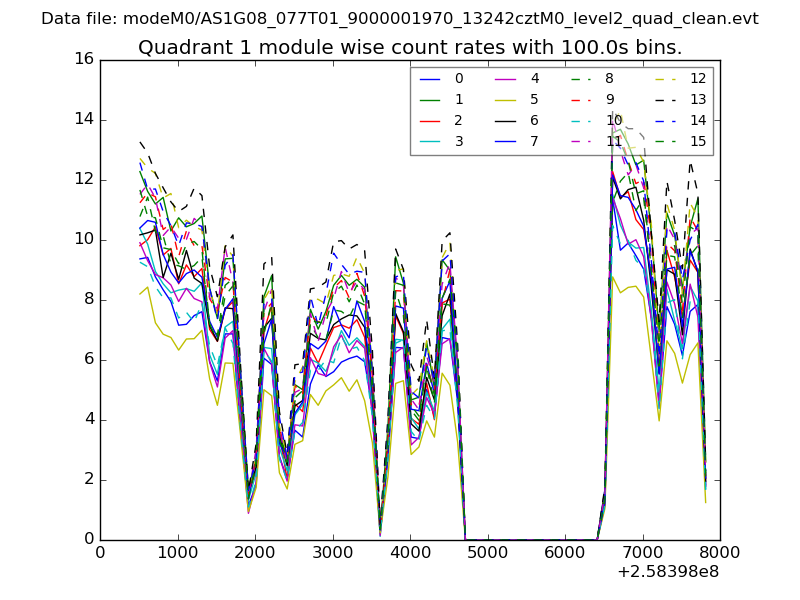
| Module-wise count rates for Quadrant A Data is divided into 100 sec bins |
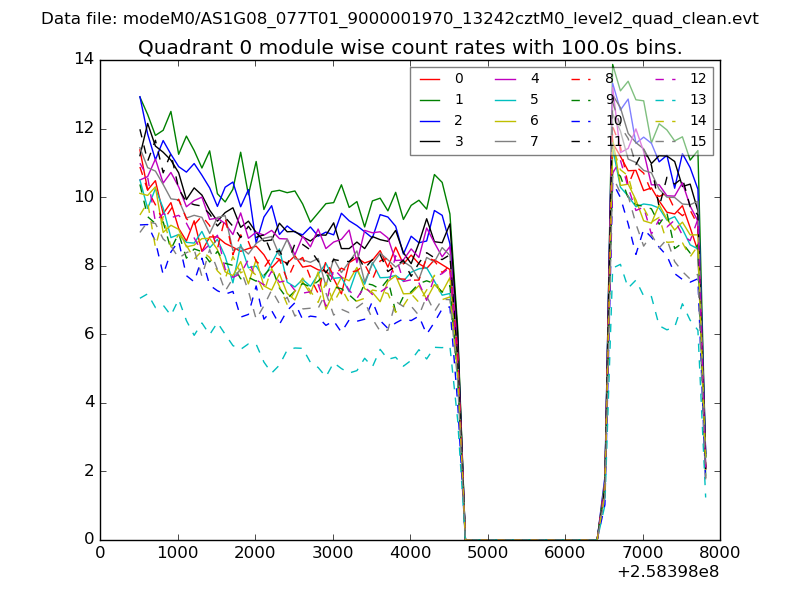 |
 |
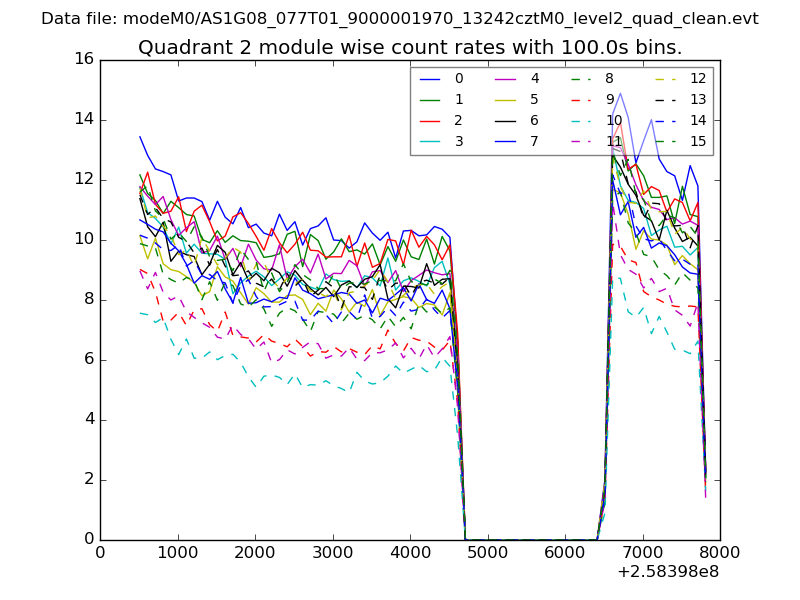
| Module-wise count rates for Quadrant B Data is divided into 100 sec bins |
 |
 |
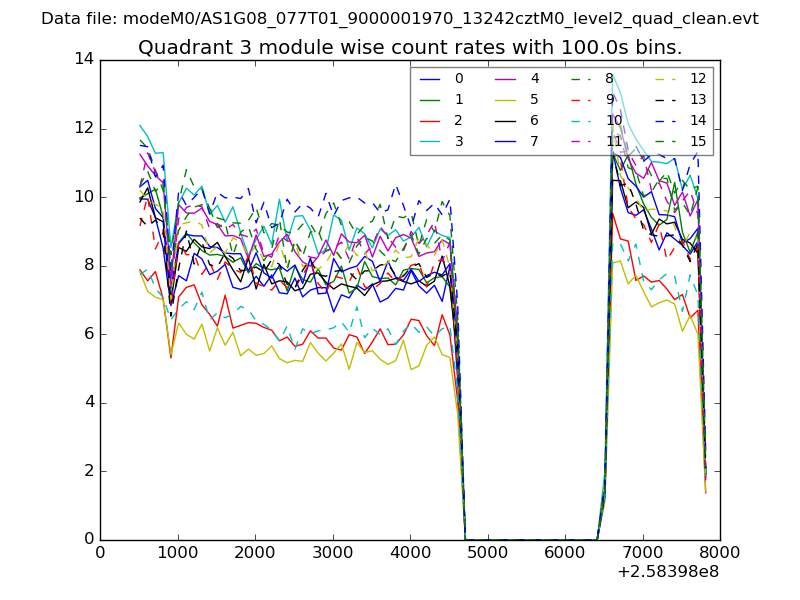
| Module-wise count rates for Quadrant C Data is divided into 100 sec bins |
 |
 |
| Module-wise count rates for Quadrant D Data is divided into 100 sec bins |
 |
 |
| Parameter | Plot |
|---|---|
| CZT HV Monitor | 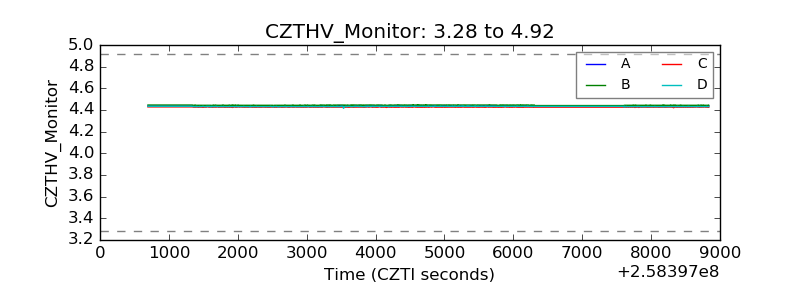 |
| D_VDD | 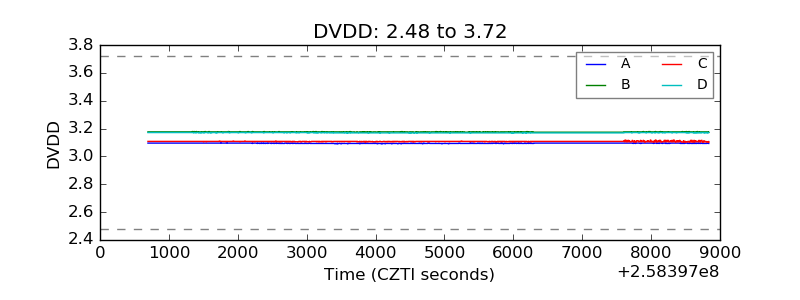 |
| Temperature 1 | 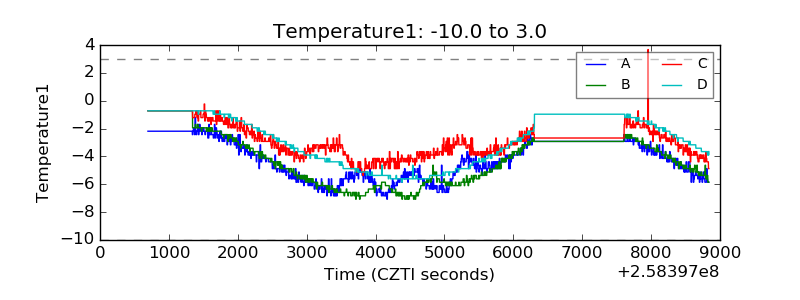 |
| Veto HV Monitor | 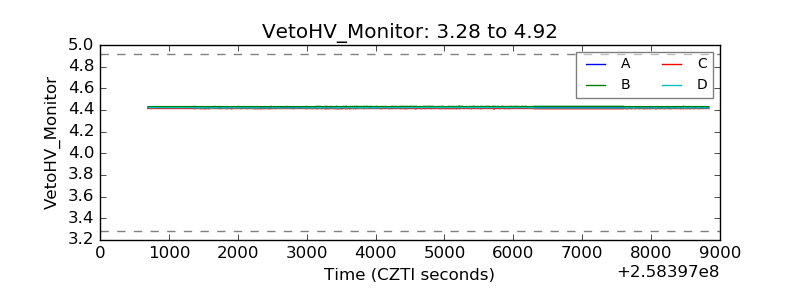 |
| Veto LLD | 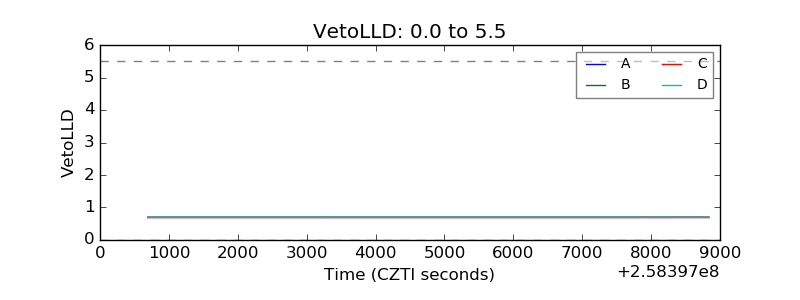 |
| Alpha Counter | 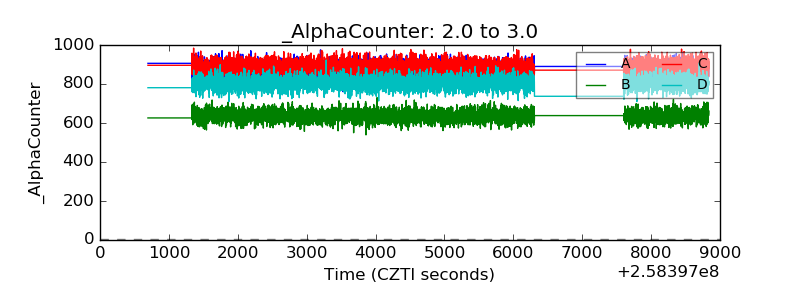 |
| _CPM_Rate | 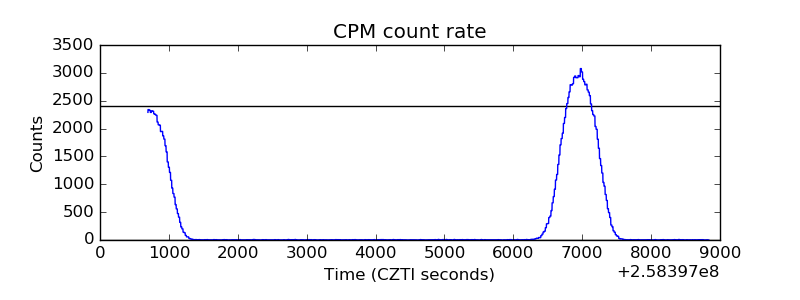 |
| CZT Counter | 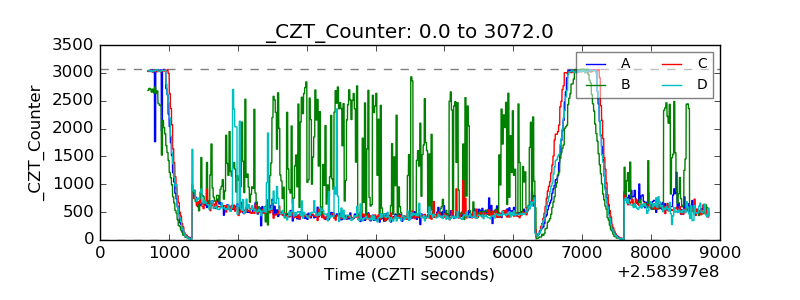 |
| +2.5 Volts monitor |  |
| +5 Volts monitor |  |
| _ROLL_ROT | 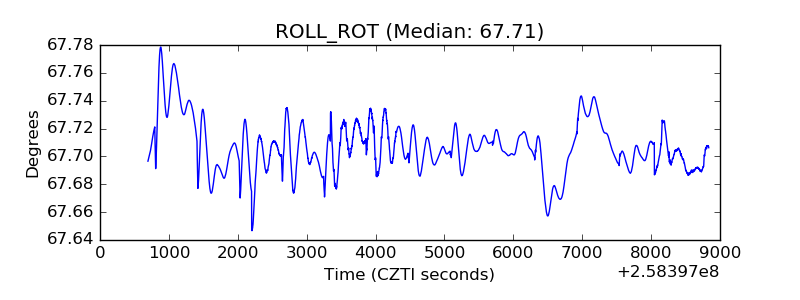 |
| _Roll_DEC | 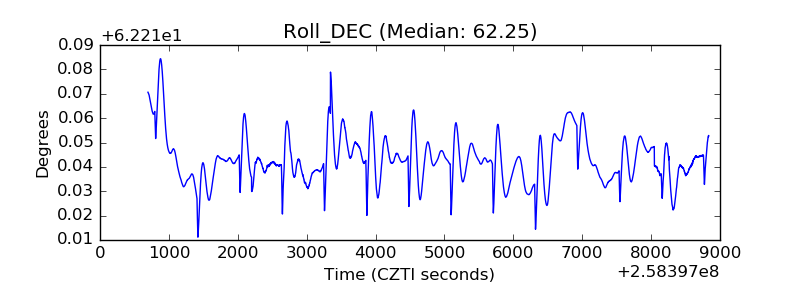 |
| _Roll_RA | 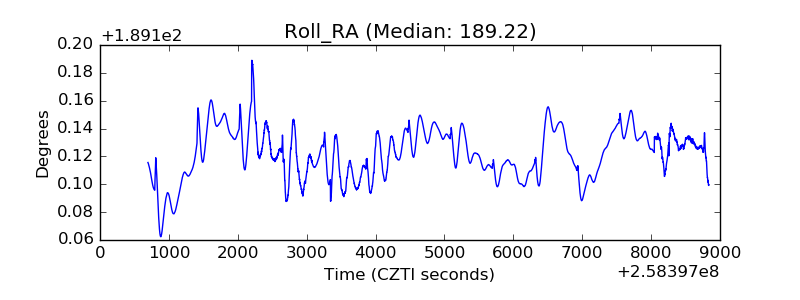 |
| Veto Counter | 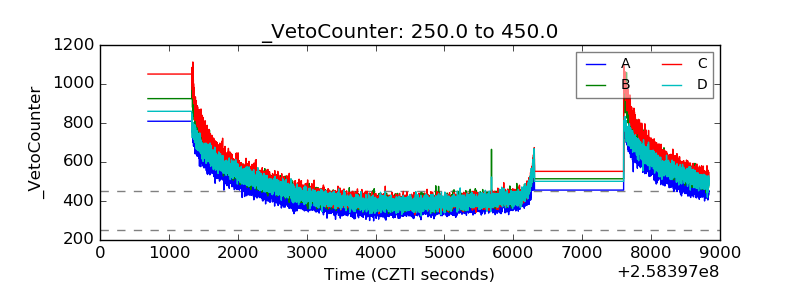 |