| Param | Original file | Final file |
|---|---|---|
| Filename | modeM0/AS1G08_077T01_9000001970_13243cztM0_level2.evt | modeM0/AS1G08_077T01_9000001970_13243cztM0_level2_quad_clean.evt |
| Size (bytes) | 512,778,240 | 111,035,520 |
| Size | 489.0 MB | 105.9 MB |
| Events in quadrant A | 3,273,938 | 738,600 |
| Events in quadrant B | 5,762,417 | 688,232 |
| Events in quadrant C | 3,090,254 | 777,686 |
| Events in quadrant D | 2,986,751 | 730,250 |
| Mode M9 | |||
|---|---|---|---|
| Quadrant | BADHDUFLAG | Total packets | Discarded packets |
| A | 0 | 16 | 0 |
| B | 0 | 16 | 0 |
| C | 0 | 16 | 0 |
| D | 0 | 17 | 0 |
| Mode SS | |||
|---|---|---|---|
| Quadrant | BADHDUFLAG | Total packets | Discarded packets |
| A | 0 | 122 | 0 |
| B | 0 | 122 | 0 |
| C | 0 | 122 | 0 |
| D | 0 | 122 | 0 |
| Mode M0 | |||
|---|---|---|---|
| Quadrant | BADHDUFLAG | Total packets | Discarded packets |
| A | 0 | 13881 | 3 |
| B | 0 | 21313 | 2 |
| C | 0 | 13271 | 2 |
| D | 0 | 13099 | 2 |
| Quadrant | Total seconds | Saturated seconds | Saturation percentage |
|---|---|---|---|
| A | 6136 | 42 | 0.684485% |
| B | 6136 | 1220 | 19.882660% |
| C | 6136 | 35 | 0.570404% |
| D | 6136 | 28 | 0.456323% |
Noise dominated data is calculated using 1-second bins in cleaned event files. If a bin has >2000 counts, and if more than 50% of those come from <1% of pixels, then it is considered to be noise-dominated and hence unusable.
| Quadrant | # 1 sec bins | Bins with >0 counts | Bins with >2000 counts | High rate bins dominated by noise | Noise dominated (total time) | Noise dominated (detector-on time) | Marked lightcurve |
|---|---|---|---|---|---|---|---|
| A | 7487 | 6138 | 1 | 1 | 0.01% | 0.02% | 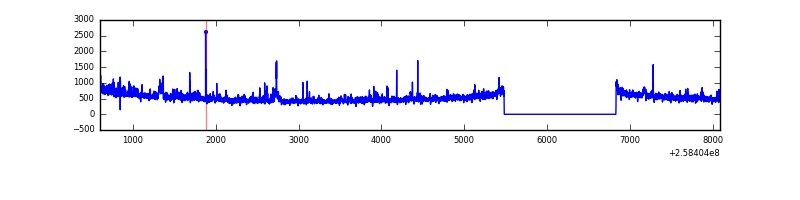 |
| B | 7487 | 6138 | 725 | 725 | 9.68% | 11.81% | 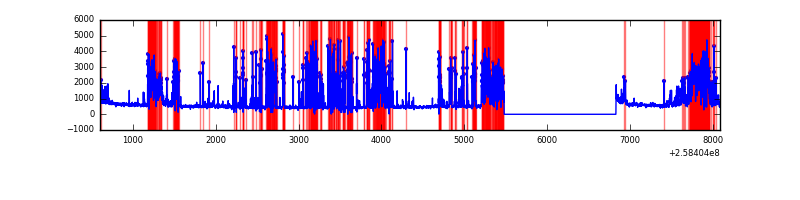 |
| C | 7487 | 6138 | 5 | 5 | 0.07% | 0.08% | 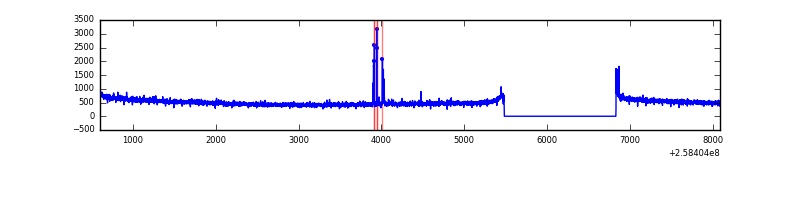 |
| D | 7487 | 6138 | 1 | 1 | 0.01% | 0.02% | 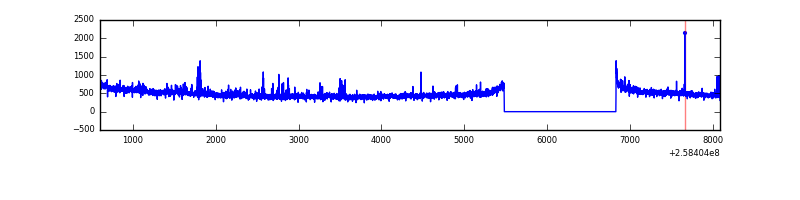 |
Top three noisy pixels from each quadrant. If the there are fewer than three noisy pixels in the level2.evt file, extra rows are filled as -1
| Pixel properties | Quadrant properties | ||||||
|---|---|---|---|---|---|---|---|
| Quadrant | DetID | PixID | Counts | Sigma | Mean | Median | Sigma |
| A | 12 | 189 | 157377 | 1019.31 | 767 | 754 | 153.7 |
| A | 15 | 239 | 128041 | 828.39 | 767 | 754 | 153.7 |
| A | 1 | 162 | 18268 | 113.98 | 767 | 754 | 153.7 |
| B | 4 | 239 | 2967647 | 23337.33 | 695 | 680 | 127.1 |
| B | 0 | 230 | 18015 | 136.35 | 695 | 680 | 127.1 |
| B | 3 | 64 | 17583 | 132.95 | 695 | 680 | 127.1 |
| C | 15 | 208 | 48341 | 271.42 | 775 | 780 | 175.2 |
| C | 8 | 128 | 10507 | 55.51 | 775 | 780 | 175.2 |
| C | 13 | 61 | 5597 | 27.49 | 775 | 780 | 175.2 |
| D | 10 | 157 | 68753 | 377.56 | 760 | 738 | 180.1 |
| D | 2 | 234 | 25663 | 138.36 | 760 | 738 | 180.1 |
| D | 8 | 195 | 12997 | 68.05 | 760 | 738 | 180.1 |
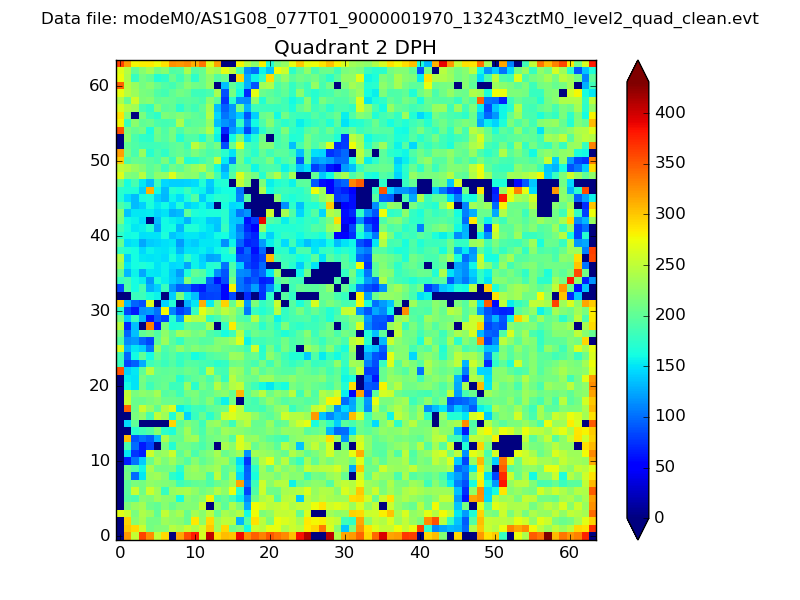
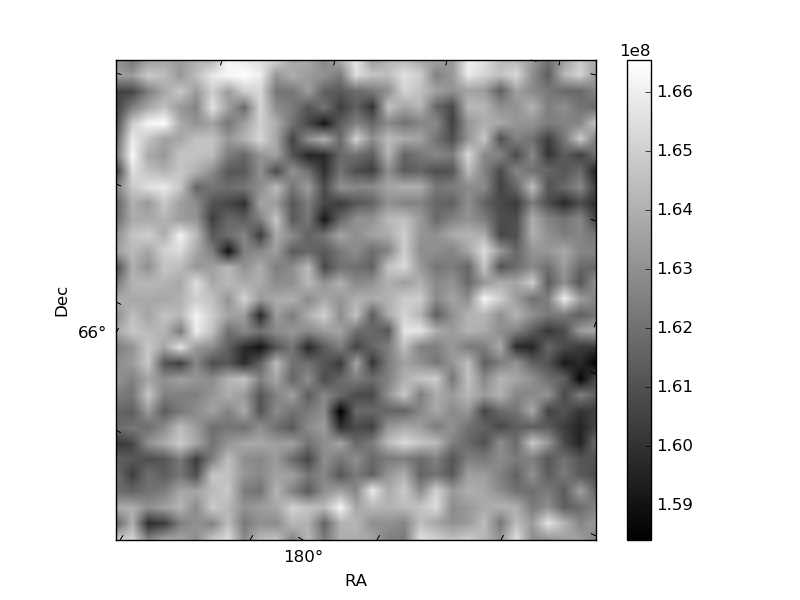
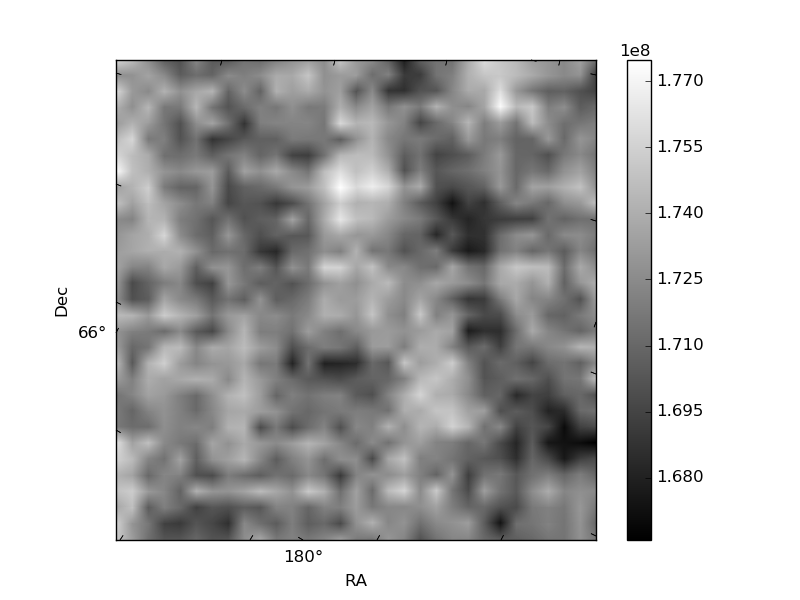
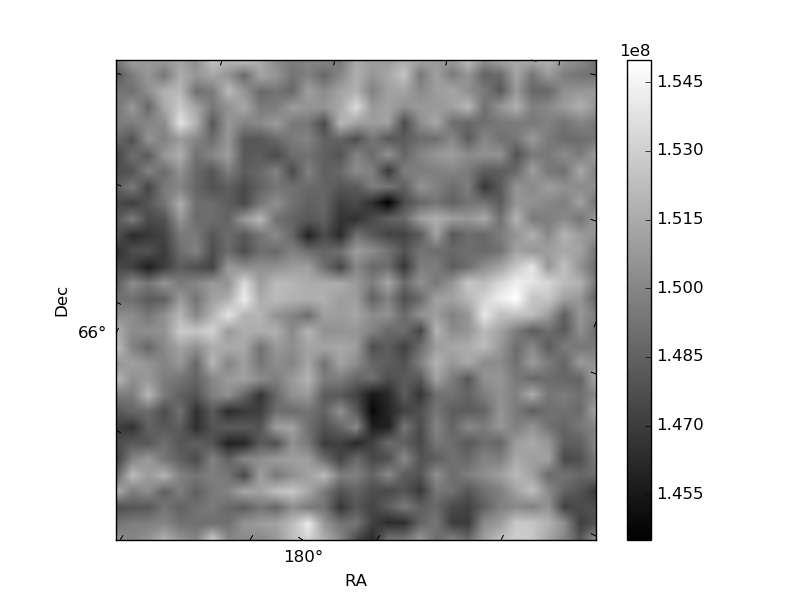
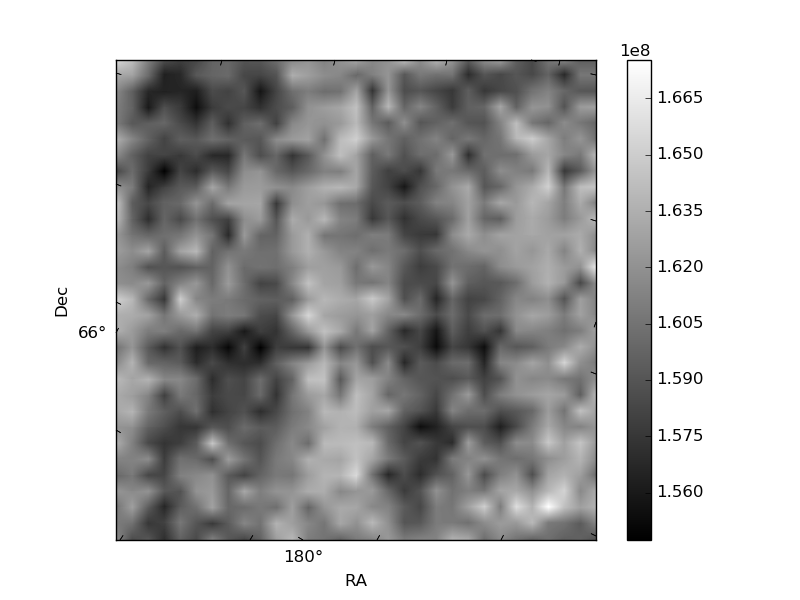
Histogram calculated using DETX and DETY for each event in the final _common_clean file
| Quadrant A | 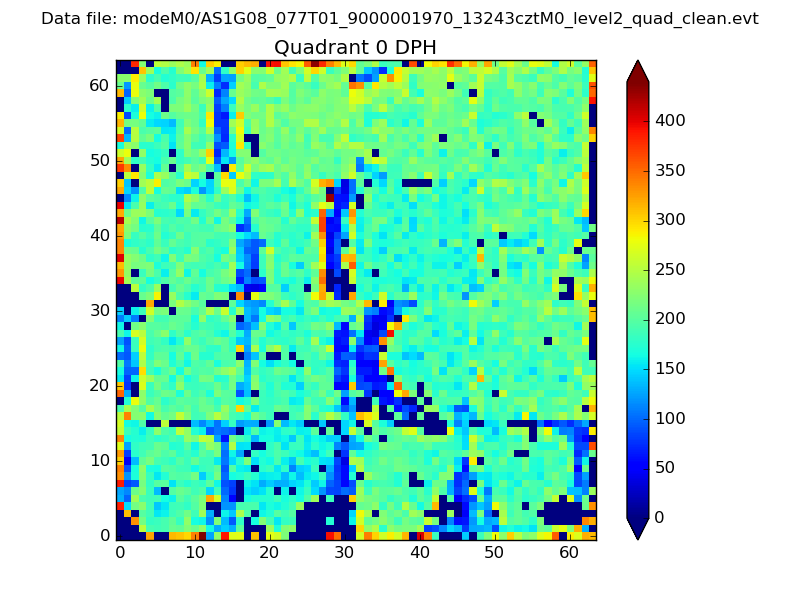 |
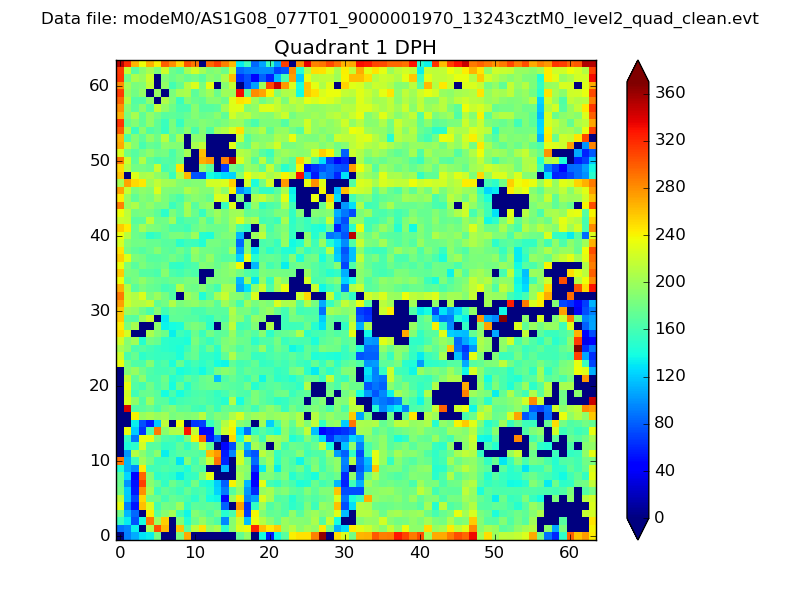 |
Quadrant B |
|---|---|---|---|
| Quadrant D | 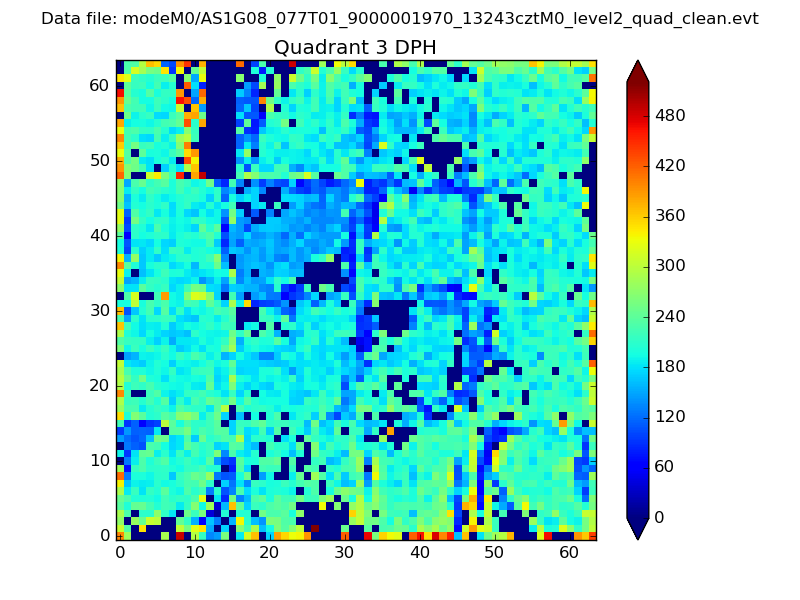 |
 |
Quadrant C |
| Plot type | Count rate plots | Images |
|---|---|---|
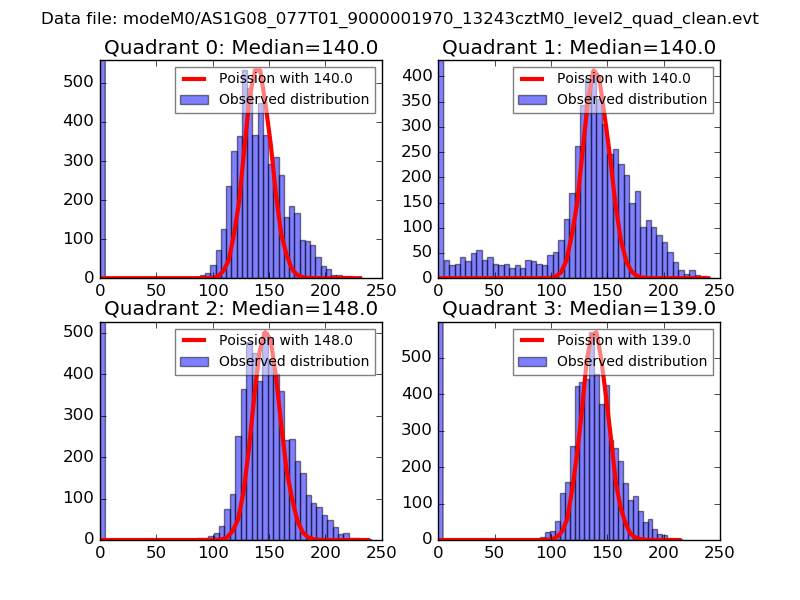
| Comparison with Poisson distribution Blue bars denote a histogram of data divided into 1 sec bins. Red curve is a Poisson curve with rate = median count rate of data. |
 |
 |
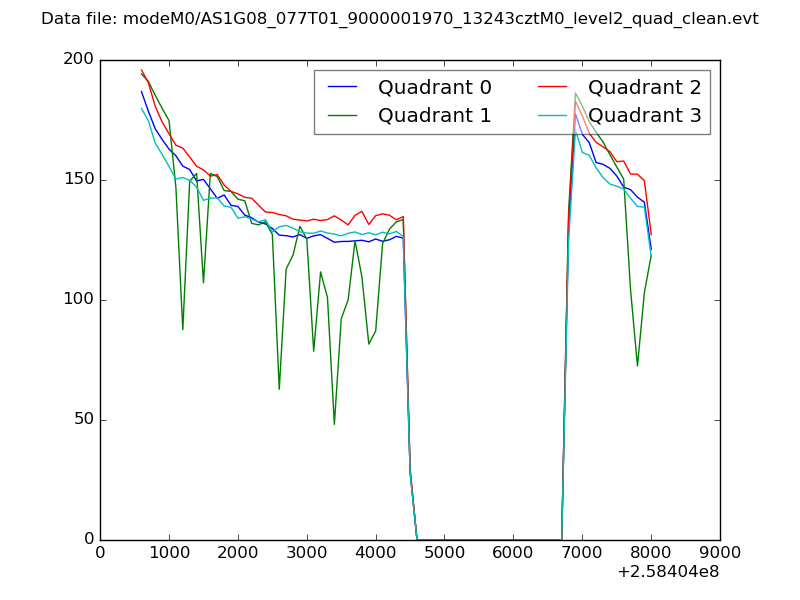
| Quadrant-wise count rates Data is divided into 100 sec bins |
 |
|
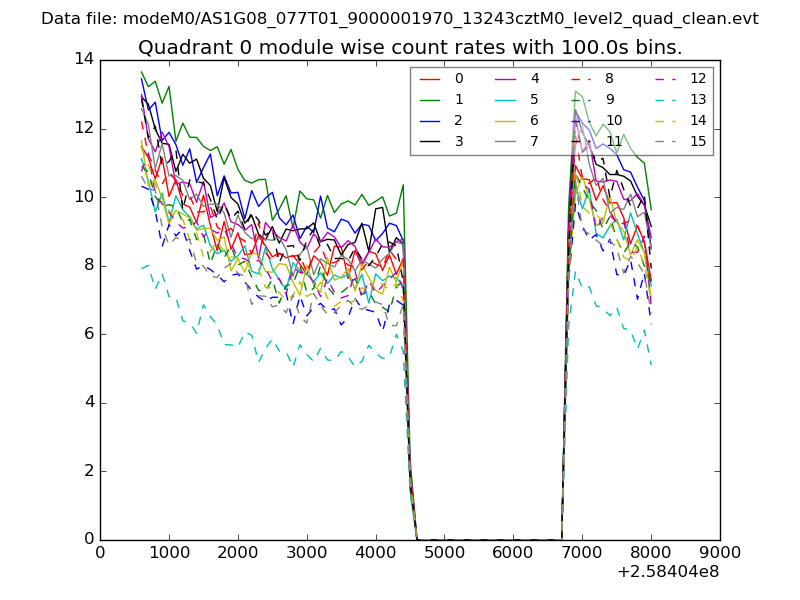
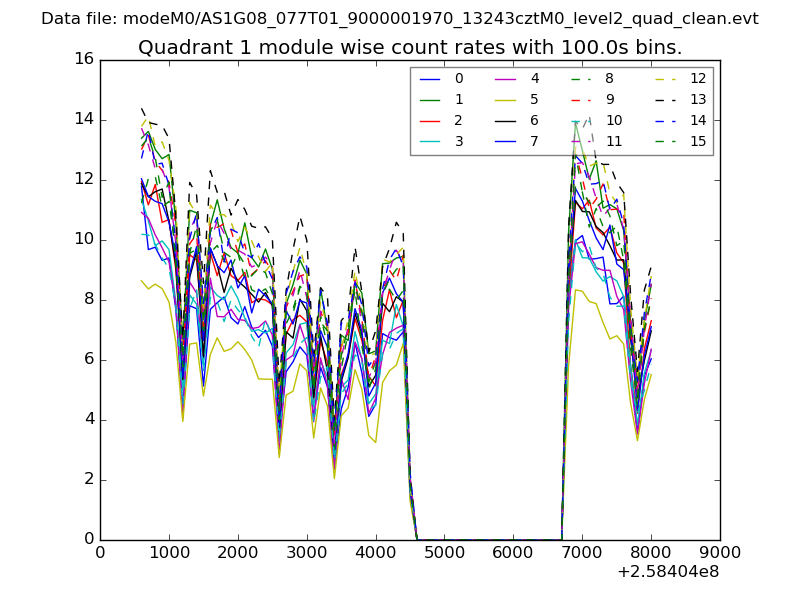
| Module-wise count rates for Quadrant A Data is divided into 100 sec bins |
 |
 |
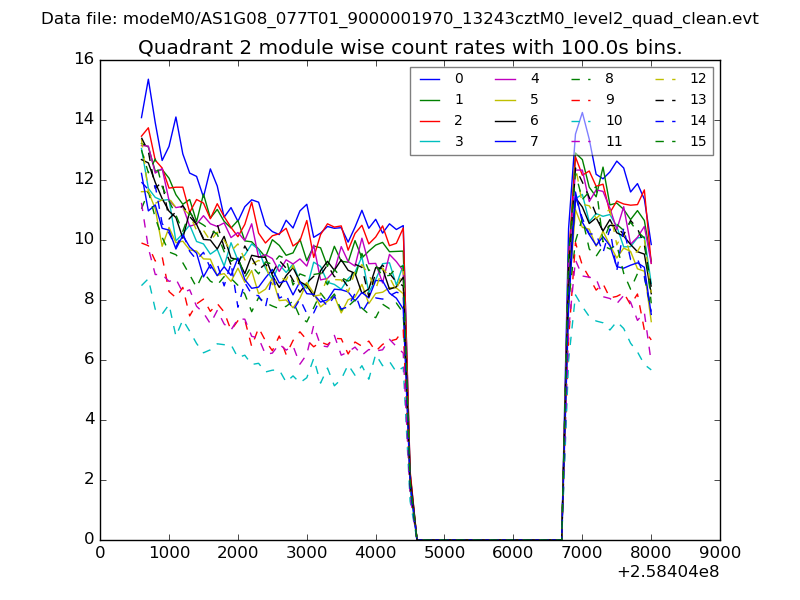
| Module-wise count rates for Quadrant B Data is divided into 100 sec bins |
 |
 |
| Module-wise count rates for Quadrant C Data is divided into 100 sec bins |
 |
 |
| Module-wise count rates for Quadrant D Data is divided into 100 sec bins |
 |
 |
| Parameter | Plot |
|---|---|
| CZT HV Monitor | 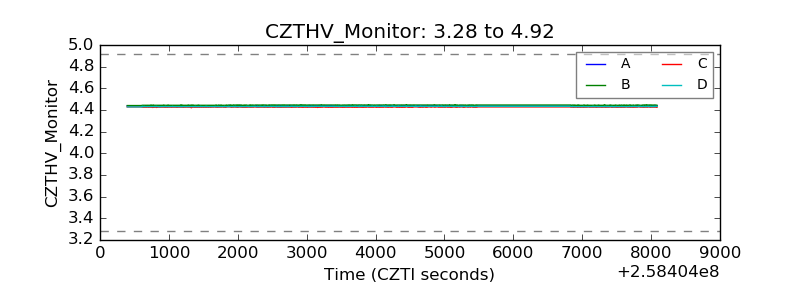 |
| D_VDD | 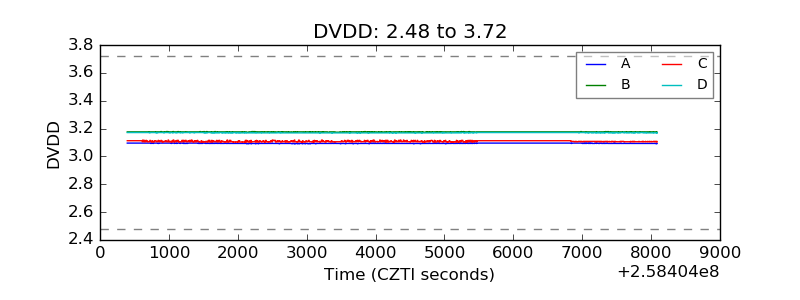 |
| Temperature 1 |  |
| Veto HV Monitor | 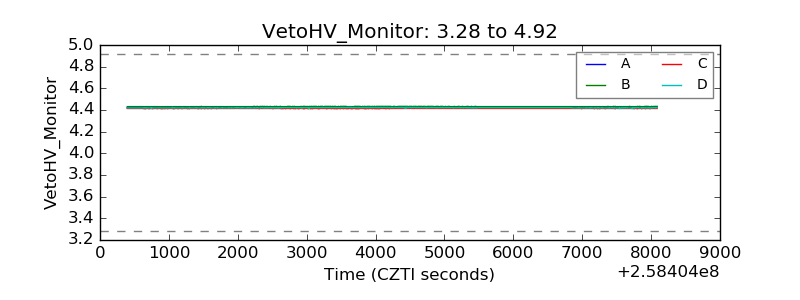 |
| Veto LLD | 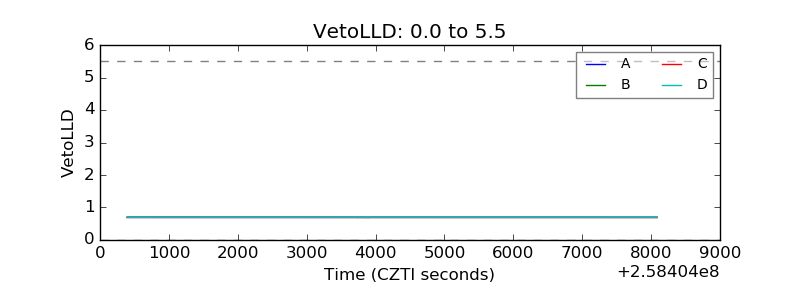 |
| Alpha Counter | 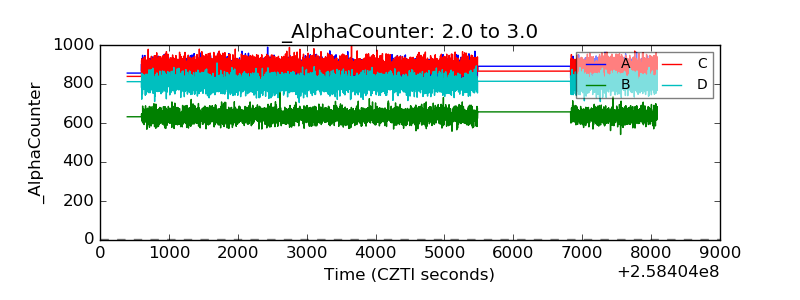 |
| _CPM_Rate | 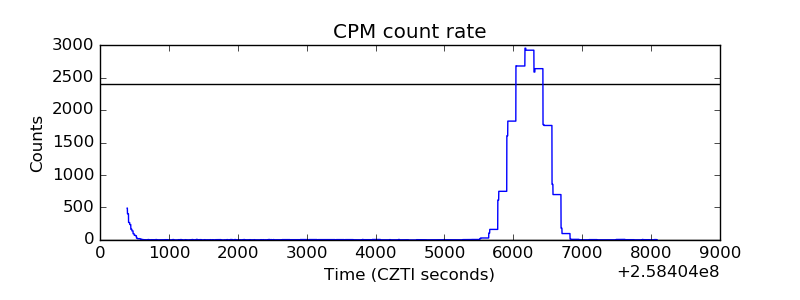 |
| CZT Counter | 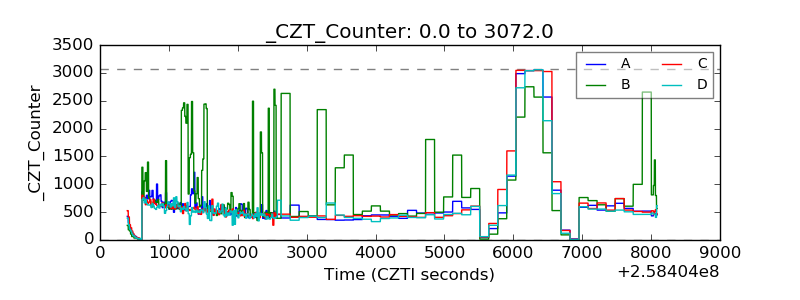 |
| +2.5 Volts monitor |  |
| +5 Volts monitor |  |
| _ROLL_ROT | 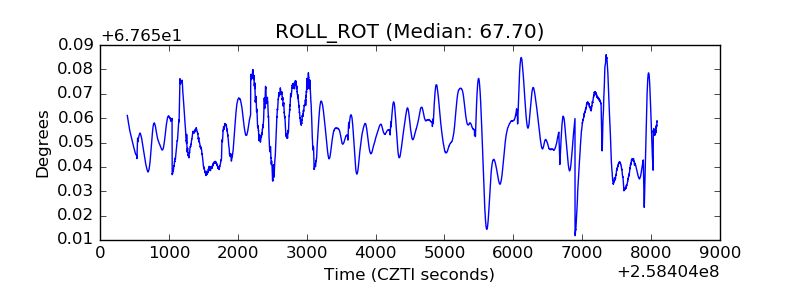 |
| _Roll_DEC |  |
| _Roll_RA | 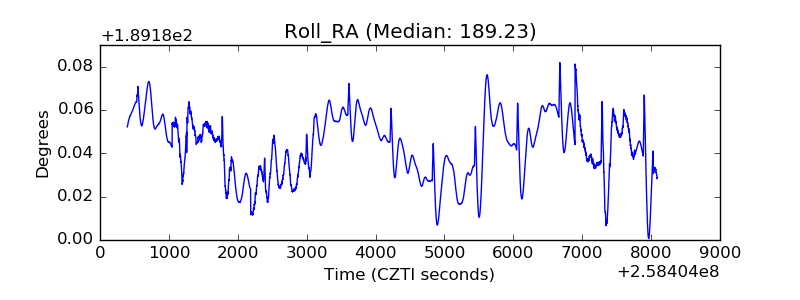 |
| Veto Counter | 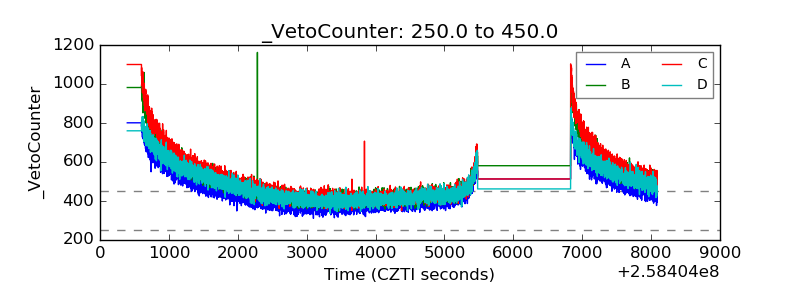 |