| Param | Original file | Final file |
|---|---|---|
| Filename | modeM0/AS1G08_077T01_9000001970_13245cztM0_level2.evt | modeM0/AS1G08_077T01_9000001970_13245cztM0_level2_quad_clean.evt |
| Size (bytes) | 503,501,760 | 93,864,960 |
| Size | 480.2 MB | 89.5 MB |
| Events in quadrant A | 3,040,616 | 609,363 |
| Events in quadrant B | 6,070,954 | 553,345 |
| Events in quadrant C | 2,902,355 | 637,143 |
| Events in quadrant D | 2,806,653 | 602,951 |
| Mode M9 | |||
|---|---|---|---|
| Quadrant | BADHDUFLAG | Total packets | Discarded packets |
| A | 0 | 22 | 0 |
| B | 0 | 22 | 0 |
| C | 0 | 22 | 0 |
| D | 0 | 23 | 0 |
| Mode SS | |||
|---|---|---|---|
| Quadrant | BADHDUFLAG | Total packets | Discarded packets |
| A | 0 | 128 | 0 |
| B | 0 | 128 | 0 |
| C | 0 | 128 | 0 |
| D | 0 | 128 | 0 |
| Mode M0 | |||
|---|---|---|---|
| Quadrant | BADHDUFLAG | Total packets | Discarded packets |
| A | 0 | 13202 | 3 |
| B | 0 | 22389 | 2 |
| C | 0 | 12921 | 2 |
| D | 0 | 12982 | 2 |
| Quadrant | Total seconds | Saturated seconds | Saturation percentage |
|---|---|---|---|
| A | 6295 | 19 | 0.301827% |
| B | 6295 | 1223 | 19.428118% |
| C | 6295 | 14 | 0.222399% |
| D | 6295 | 9 | 0.142971% |
Noise dominated data is calculated using 1-second bins in cleaned event files. If a bin has >2000 counts, and if more than 50% of those come from <1% of pixels, then it is considered to be noise-dominated and hence unusable.
| Quadrant | # 1 sec bins | Bins with >0 counts | Bins with >2000 counts | High rate bins dominated by noise | Noise dominated (total time) | Noise dominated (detector-on time) | Marked lightcurve |
|---|---|---|---|---|---|---|---|
| A | 7606 | 6297 | 2 | 2 | 0.03% | 0.03% |  |
| B | 7606 | 6297 | 853 | 853 | 11.21% | 13.55% |  |
| C | 7606 | 6297 | 1 | 1 | 0.01% | 0.02% |  |
| D | 7606 | 6297 | 3 | 3 | 0.04% | 0.05% |  |
Top three noisy pixels from each quadrant. If the there are fewer than three noisy pixels in the level2.evt file, extra rows are filled as -1
| Pixel properties | Quadrant properties | ||||||
|---|---|---|---|---|---|---|---|
| Quadrant | DetID | PixID | Counts | Sigma | Mean | Median | Sigma |
| A | 12 | 189 | 133154 | 887.04 | 739 | 722 | 149.3 |
| A | 15 | 239 | 38054 | 250.05 | 739 | 722 | 149.3 |
| A | 1 | 162 | 12577 | 79.41 | 739 | 722 | 149.3 |
| B | 4 | 239 | 3263739 | 25541.82 | 686 | 669 | 127.8 |
| B | 0 | 230 | 30694 | 235.02 | 686 | 669 | 127.8 |
| B | 0 | 219 | 25108 | 191.3 | 686 | 669 | 127.8 |
| C | 15 | 208 | 16336 | 92.26 | 739 | 744 | 169.0 |
| C | 13 | 61 | 5262 | 26.74 | 739 | 744 | 169.0 |
| C | 8 | 222 | 3045 | 13.62 | 739 | 744 | 169.0 |
| D | 1 | 52 | 47946 | 274.25 | 722 | 703 | 172.3 |
| D | 2 | 234 | 22045 | 123.89 | 722 | 703 | 172.3 |
| D | 14 | 34 | 10473 | 56.72 | 722 | 703 | 172.3 |
Histogram calculated using DETX and DETY for each event in the final _common_clean file
| Quadrant A |  |
 |
Quadrant B |
|---|---|---|---|
| Quadrant D |  |
 |
Quadrant C |
| Plot type | Count rate plots | Images |
|---|---|---|
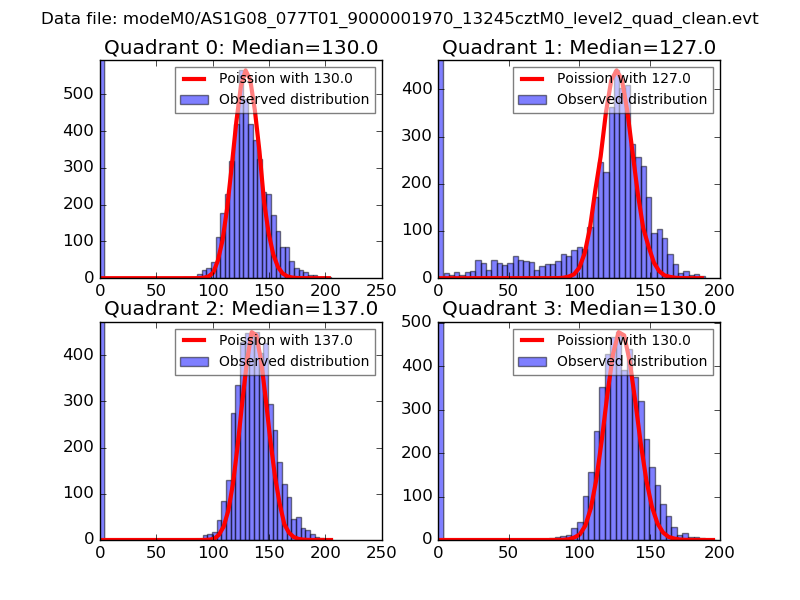
| Comparison with Poisson distribution Blue bars denote a histogram of data divided into 1 sec bins. Red curve is a Poisson curve with rate = median count rate of data. |
 |
 |
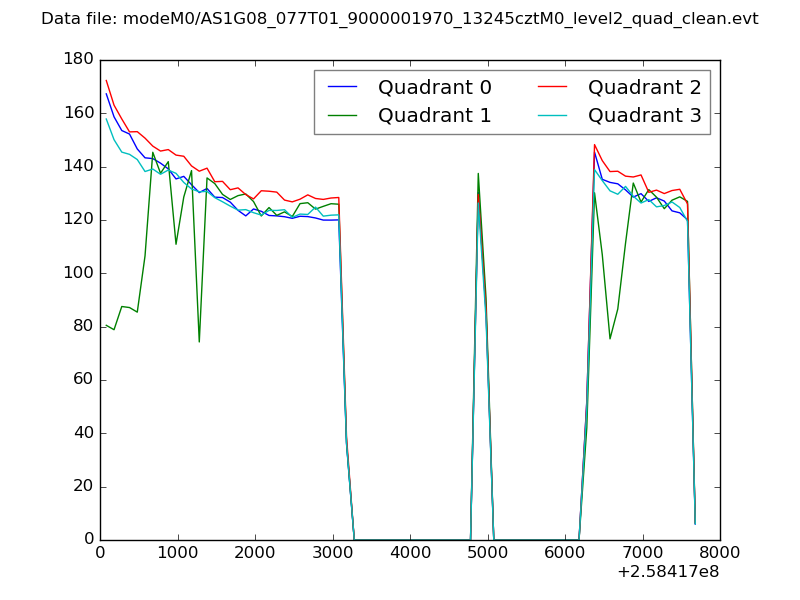
| Quadrant-wise count rates Data is divided into 100 sec bins |
 |
|
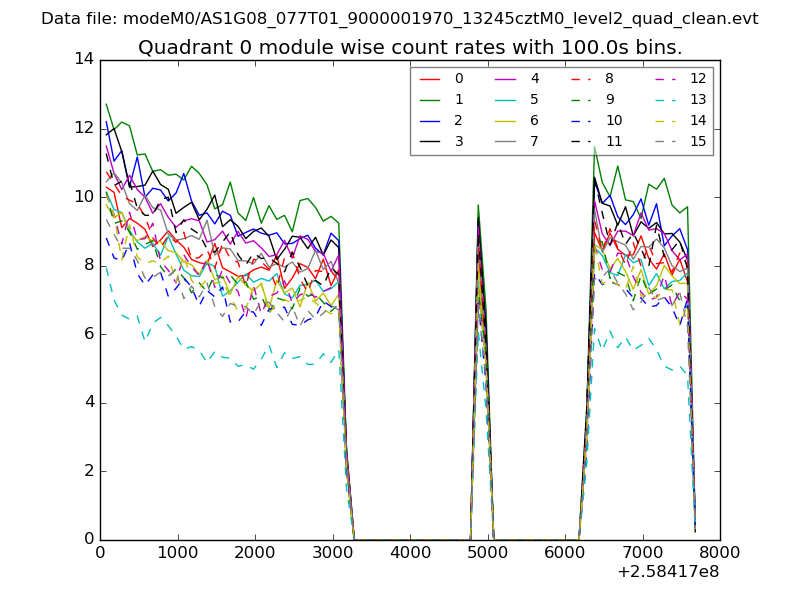
| Module-wise count rates for Quadrant A Data is divided into 100 sec bins |
 |
 |
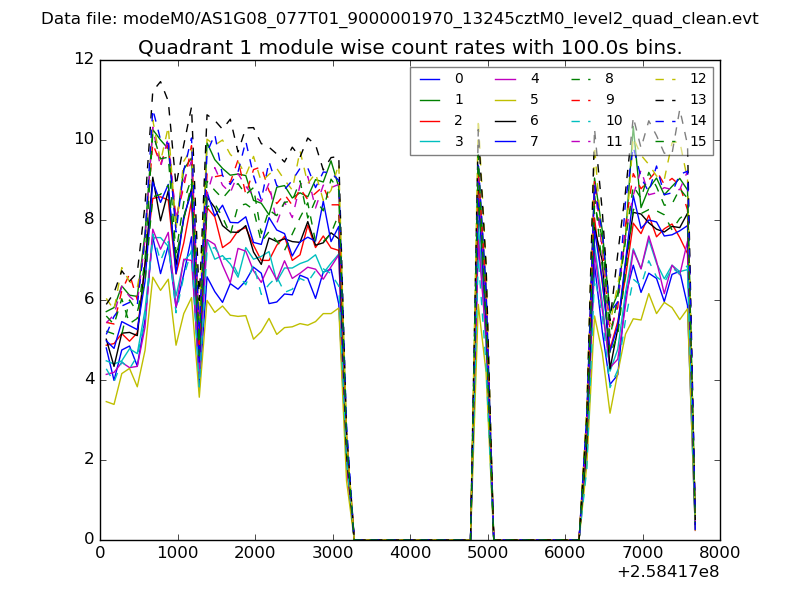
| Module-wise count rates for Quadrant B Data is divided into 100 sec bins |
 |
 |
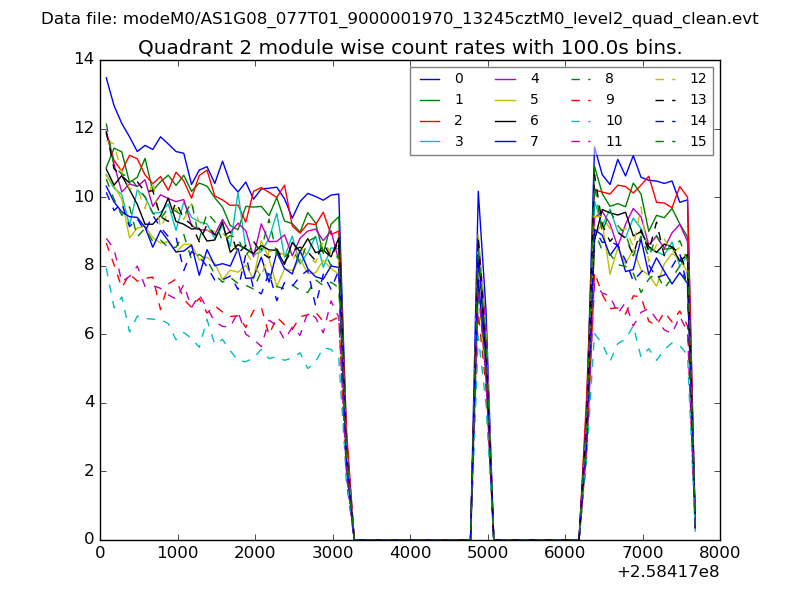
| Module-wise count rates for Quadrant C Data is divided into 100 sec bins |
 |
 |
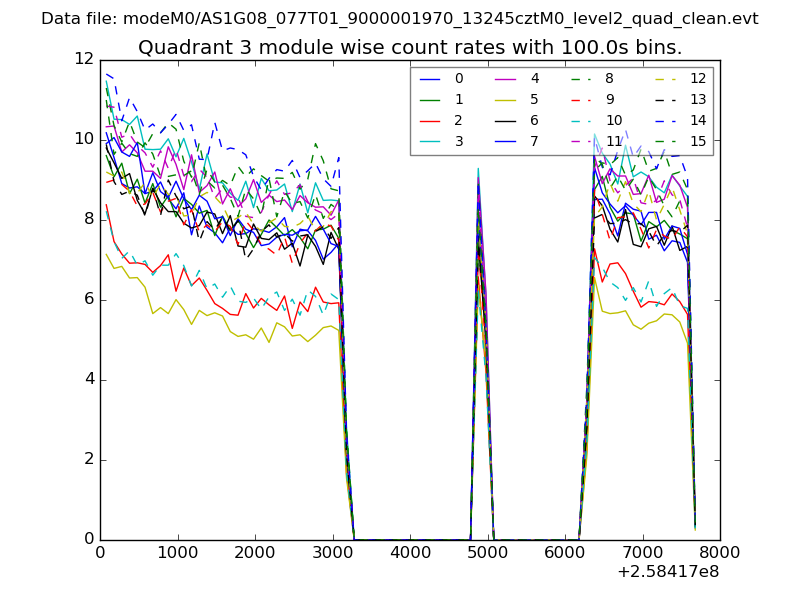
| Module-wise count rates for Quadrant D Data is divided into 100 sec bins |
 |
 |
| Parameter | Plot |
|---|---|
| CZT HV Monitor | 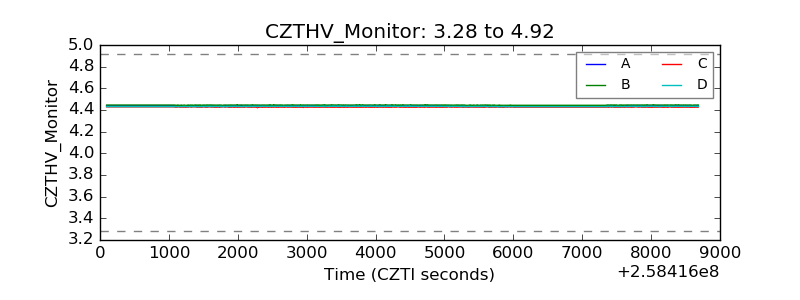 |
| D_VDD |  |
| Temperature 1 |  |
| Veto HV Monitor |  |
| Veto LLD |  |
| Alpha Counter | 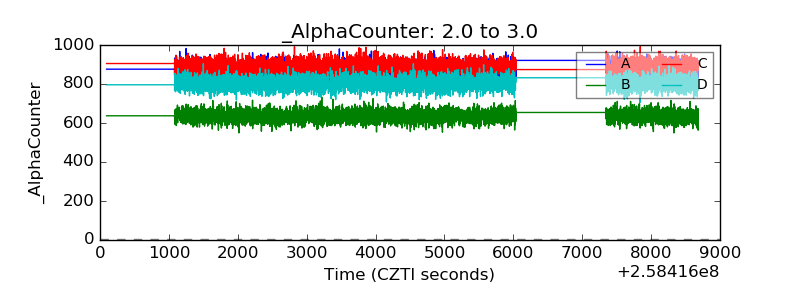 |
| _CPM_Rate | 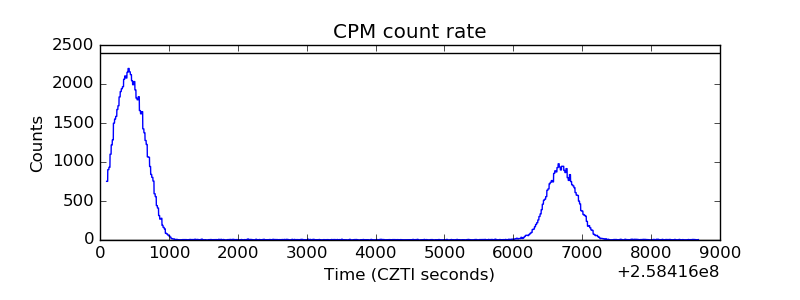 |
| CZT Counter |  |
| +2.5 Volts monitor |  |
| +5 Volts monitor |  |
| _ROLL_ROT | 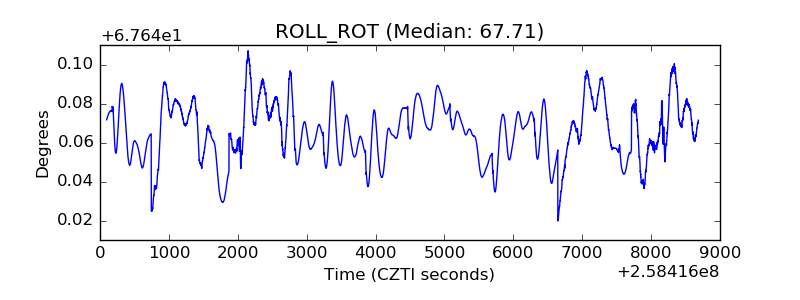 |
| _Roll_DEC | 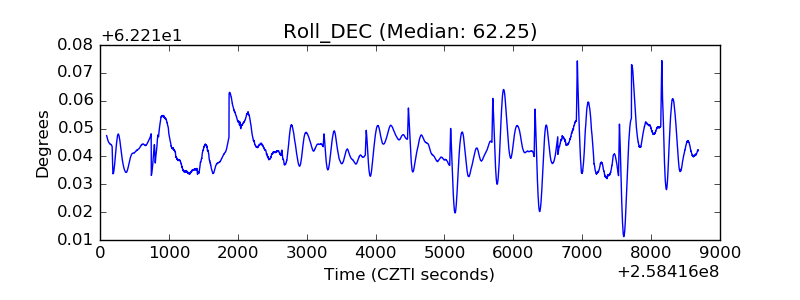 |
| _Roll_RA |  |
| Veto Counter | 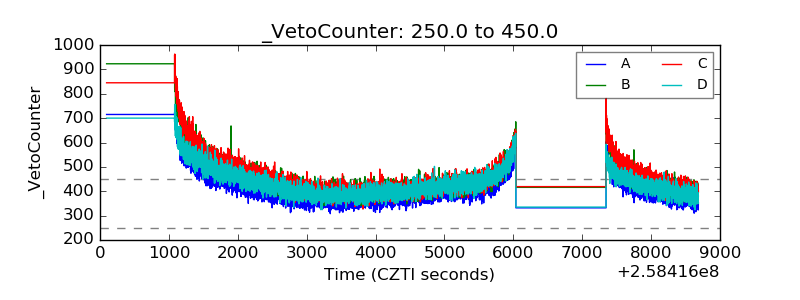 |