| Param | Original file | Final file |
|---|---|---|
| Filename | modeM0/AS1G08_077T01_9000001970_13246cztM0_level2.evt | modeM0/AS1G08_077T01_9000001970_13246cztM0_level2_quad_clean.evt |
| Size (bytes) | 454,872,960 | 97,387,200 |
| Size | 433.8 MB | 92.9 MB |
| Events in quadrant A | 3,093,327 | 618,749 |
| Events in quadrant B | 4,254,411 | 611,948 |
| Events in quadrant C | 3,000,902 | 641,317 |
| Events in quadrant D | 2,975,615 | 614,174 |
| Mode M9 | |||
|---|---|---|---|
| Quadrant | BADHDUFLAG | Total packets | Discarded packets |
| A | 0 | 21 | 0 |
| B | 0 | 21 | 0 |
| C | 0 | 21 | 0 |
| D | 0 | 22 | 0 |
| Mode SS | |||
|---|---|---|---|
| Quadrant | BADHDUFLAG | Total packets | Discarded packets |
| A | 0 | 134 | 0 |
| B | 0 | 134 | 0 |
| C | 0 | 134 | 0 |
| D | 0 | 134 | 0 |
| Mode M0 | |||
|---|---|---|---|
| Quadrant | BADHDUFLAG | Total packets | Discarded packets |
| A | 0 | 13909 | 3 |
| B | 0 | 17293 | 2 |
| C | 0 | 13670 | 2 |
| D | 0 | 13739 | 2 |
| Quadrant | Total seconds | Saturated seconds | Saturation percentage |
|---|---|---|---|
| A | 6644 | 14 | 0.210716% |
| B | 6644 | 424 | 6.381698% |
| C | 6644 | 25 | 0.376279% |
| D | 6644 | 15 | 0.225768% |
Noise dominated data is calculated using 1-second bins in cleaned event files. If a bin has >2000 counts, and if more than 50% of those come from <1% of pixels, then it is considered to be noise-dominated and hence unusable.
| Quadrant | # 1 sec bins | Bins with >0 counts | Bins with >2000 counts | High rate bins dominated by noise | Noise dominated (total time) | Noise dominated (detector-on time) | Marked lightcurve |
|---|---|---|---|---|---|---|---|
| A | 7615 | 6646 | 1 | 1 | 0.01% | 0.02% | 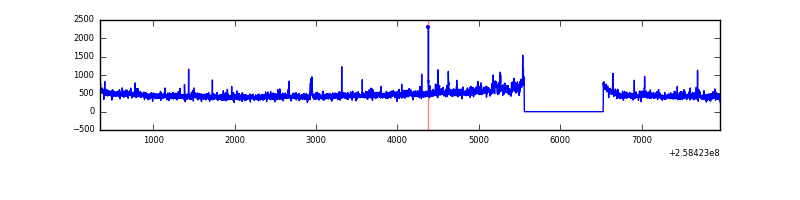 |
| B | 7615 | 6646 | 271 | 271 | 3.56% | 4.08% | 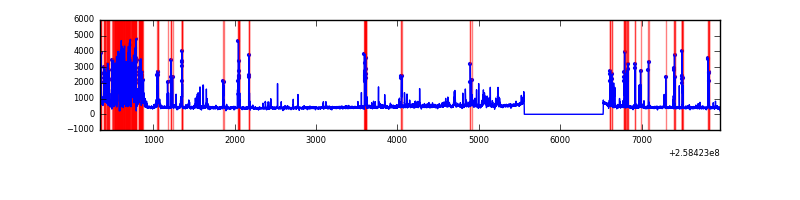 |
| C | 7615 | 6646 | 8 | 8 | 0.11% | 0.12% | 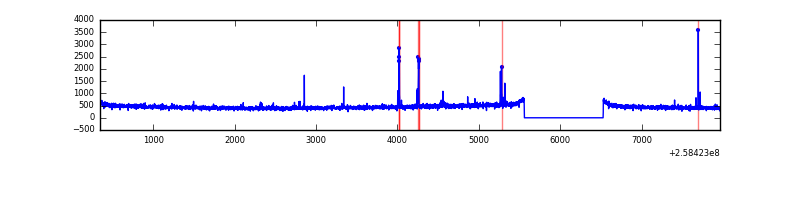 |
| D | 7615 | 6646 | 8 | 8 | 0.11% | 0.12% | 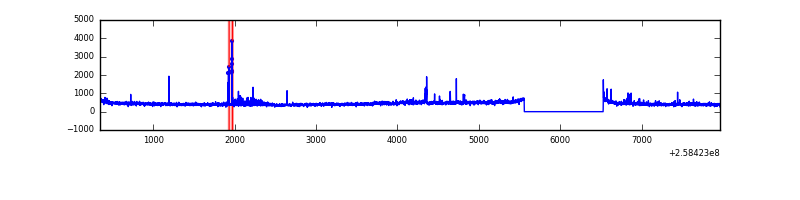 |
Top three noisy pixels from each quadrant. If the there are fewer than three noisy pixels in the level2.evt file, extra rows are filled as -1
| Pixel properties | Quadrant properties | ||||||
|---|---|---|---|---|---|---|---|
| Quadrant | DetID | PixID | Counts | Sigma | Mean | Median | Sigma |
| A | 15 | 239 | 95763 | 617.39 | 757 | 742 | 153.9 |
| A | 12 | 189 | 56395 | 361.6 | 757 | 742 | 153.9 |
| A | 1 | 162 | 13878 | 85.35 | 757 | 742 | 153.9 |
| B | 4 | 239 | 1130013 | 8093.03 | 747 | 727 | 139.5 |
| B | 3 | 64 | 68929 | 488.77 | 747 | 727 | 139.5 |
| B | 4 | 142 | 30570 | 213.87 | 747 | 727 | 139.5 |
| C | 14 | 234 | 58512 | 332.63 | 752 | 755 | 173.6 |
| C | 15 | 208 | 8027 | 41.88 | 752 | 755 | 173.6 |
| C | 13 | 61 | 5411 | 26.81 | 752 | 755 | 173.6 |
| D | 5 | 222 | 71274 | 398.79 | 738 | 717 | 176.9 |
| D | 1 | 52 | 51850 | 289.01 | 738 | 717 | 176.9 |
| D | 13 | 104 | 29565 | 163.05 | 738 | 717 | 176.9 |
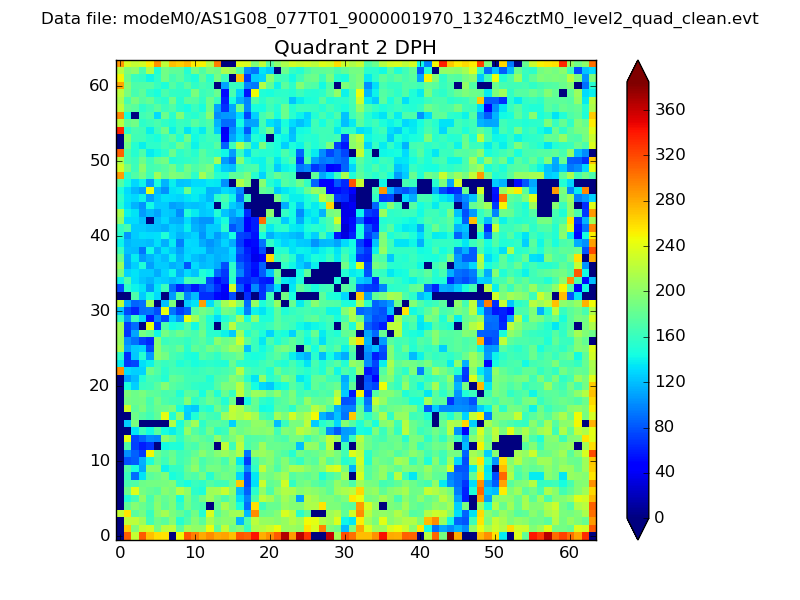
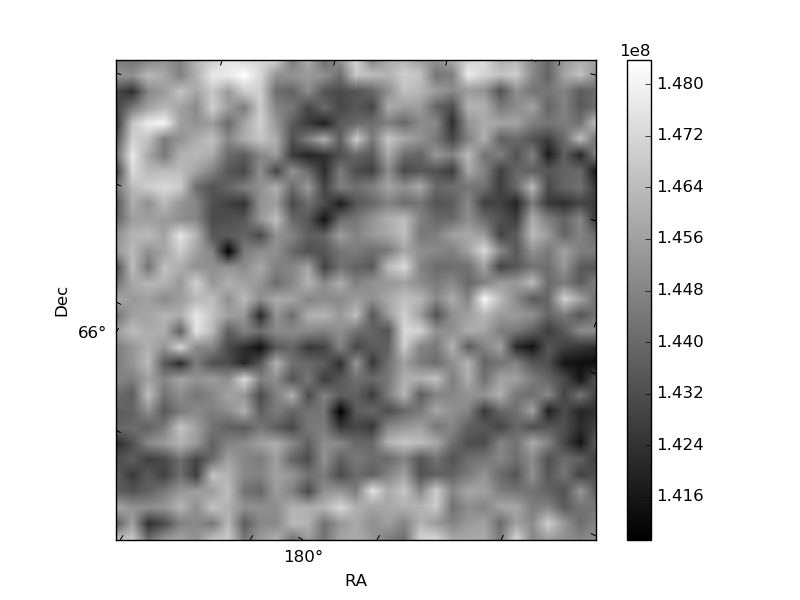
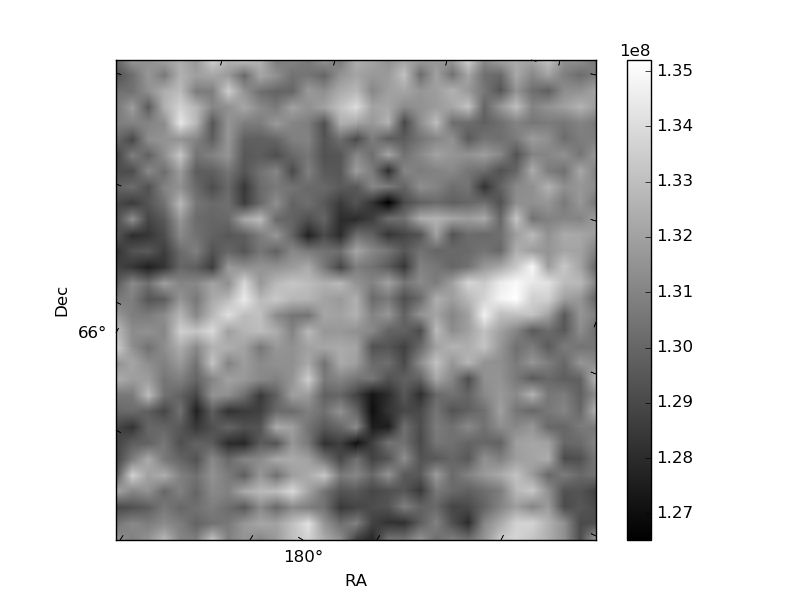
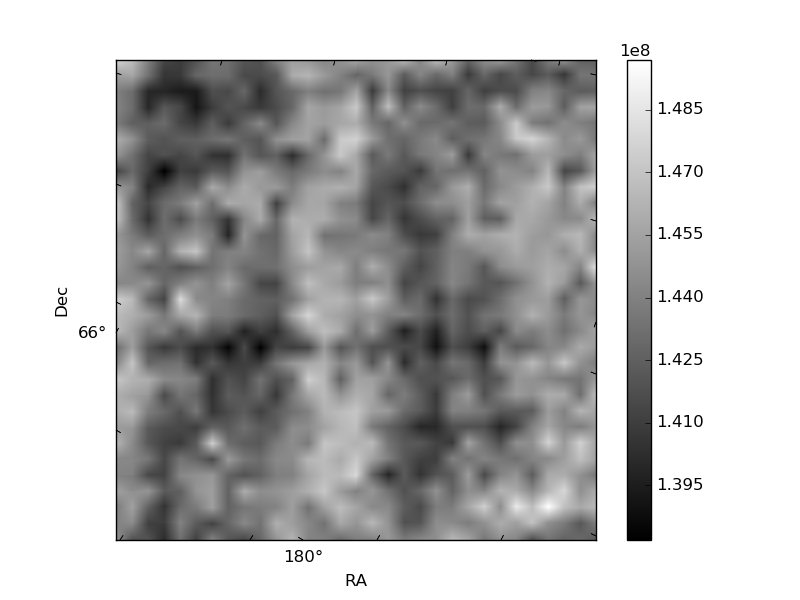
Histogram calculated using DETX and DETY for each event in the final _common_clean file
| Quadrant A | 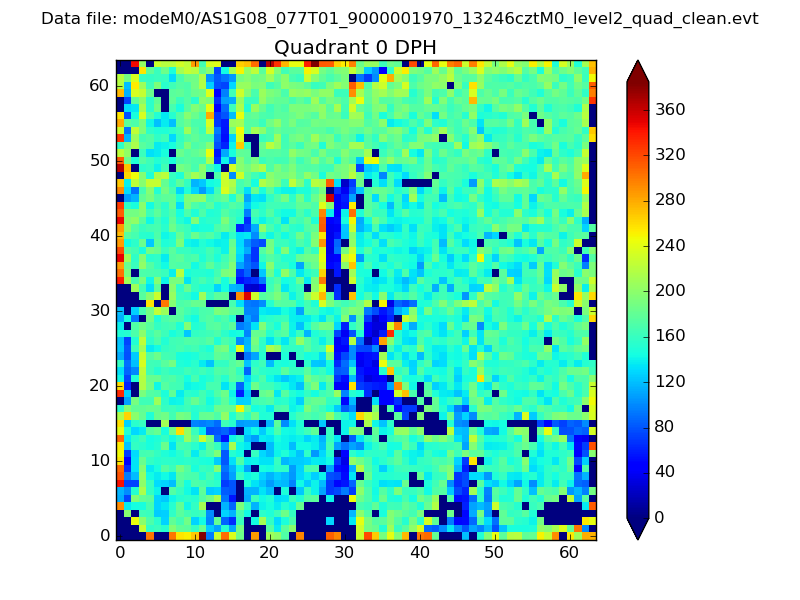 |
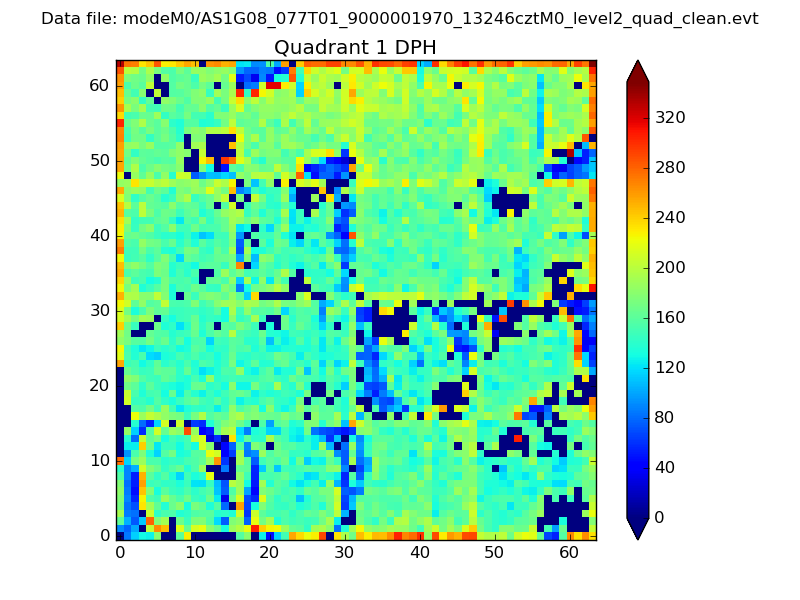 |
Quadrant B |
|---|---|---|---|
| Quadrant D | 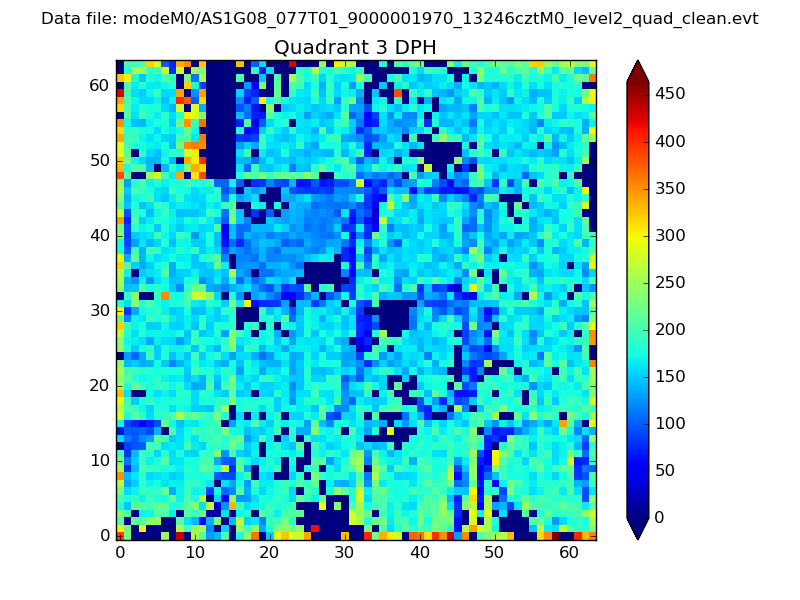 |
 |
Quadrant C |
| Plot type | Count rate plots | Images |
|---|---|---|
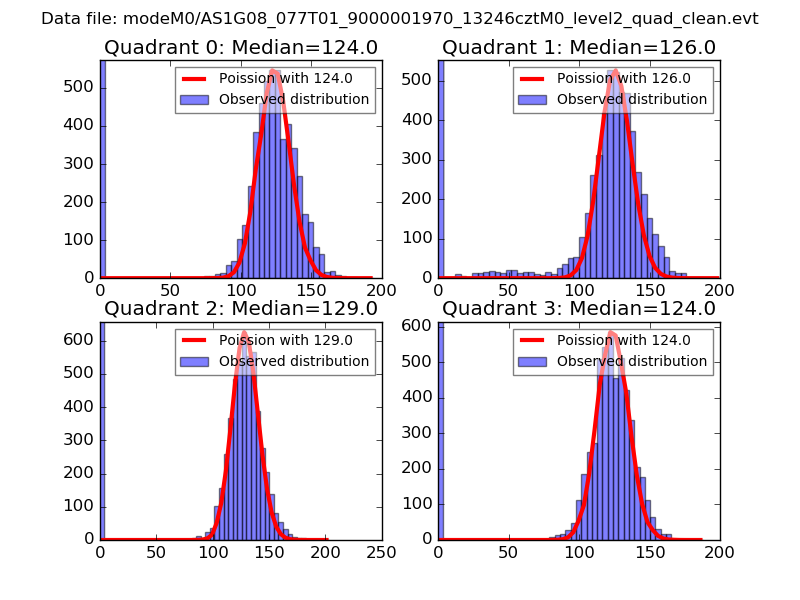
| Comparison with Poisson distribution Blue bars denote a histogram of data divided into 1 sec bins. Red curve is a Poisson curve with rate = median count rate of data. |
 |
 |
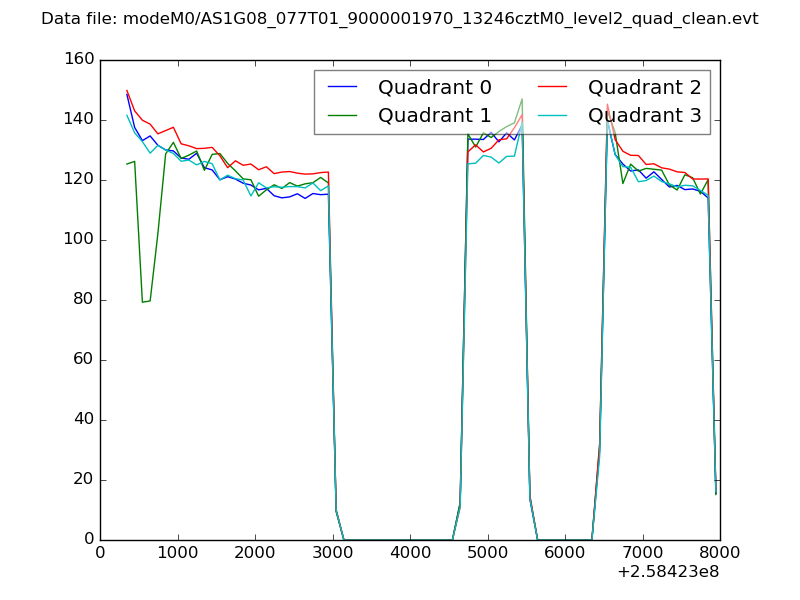
| Quadrant-wise count rates Data is divided into 100 sec bins |
 |
|
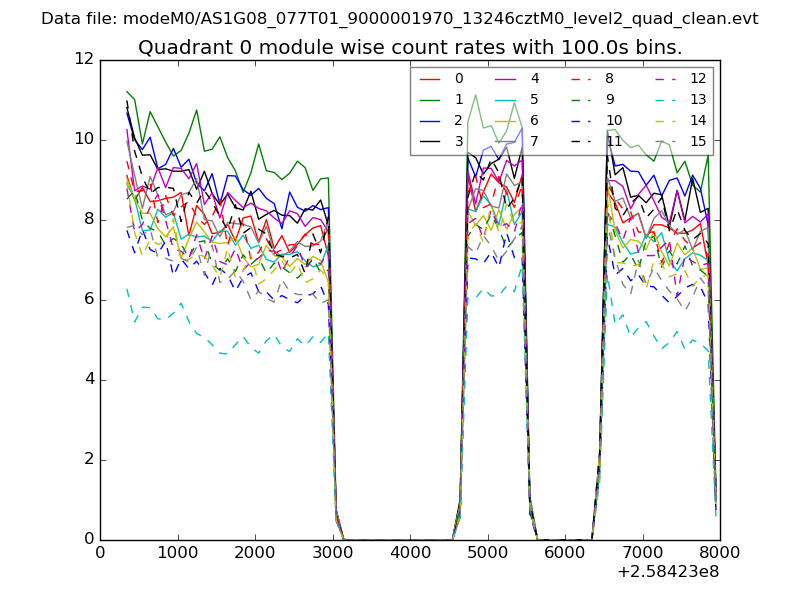
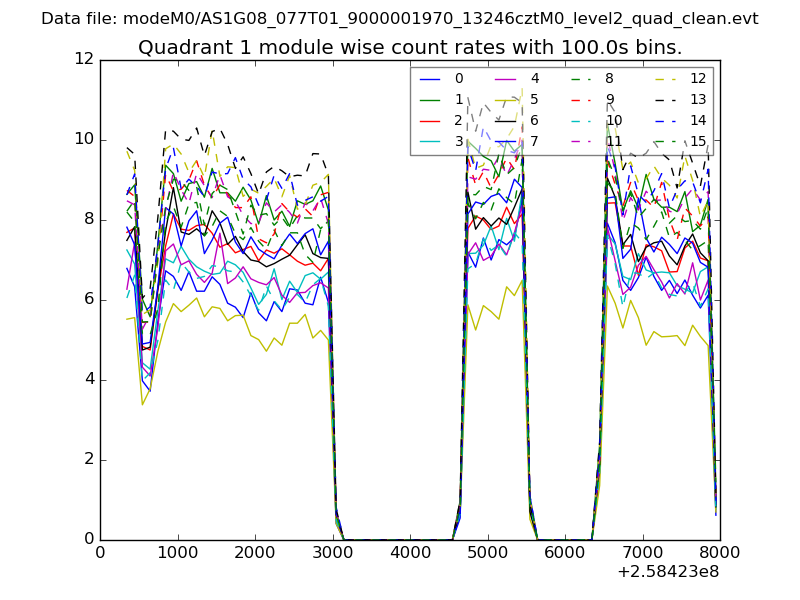
| Module-wise count rates for Quadrant A Data is divided into 100 sec bins |
 |
 |
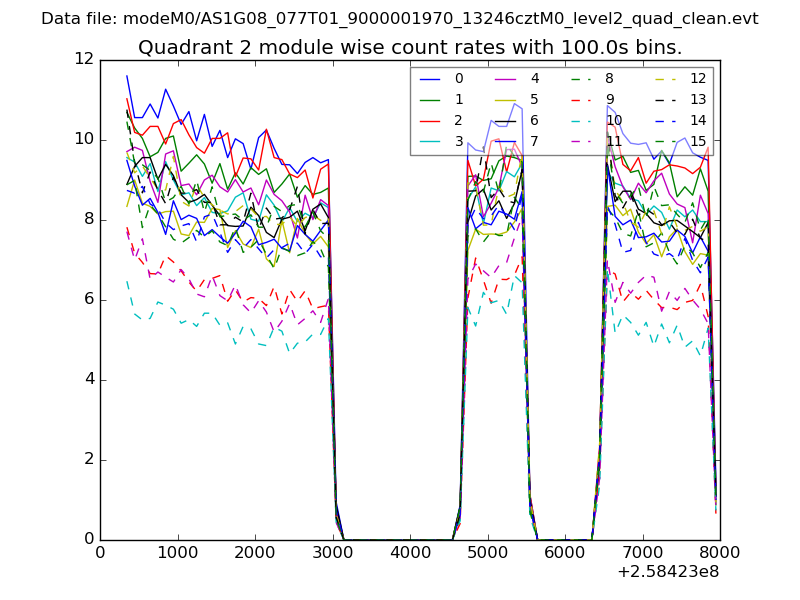
| Module-wise count rates for Quadrant B Data is divided into 100 sec bins |
 |
 |
| Module-wise count rates for Quadrant C Data is divided into 100 sec bins |
 |
 |
| Module-wise count rates for Quadrant D Data is divided into 100 sec bins |
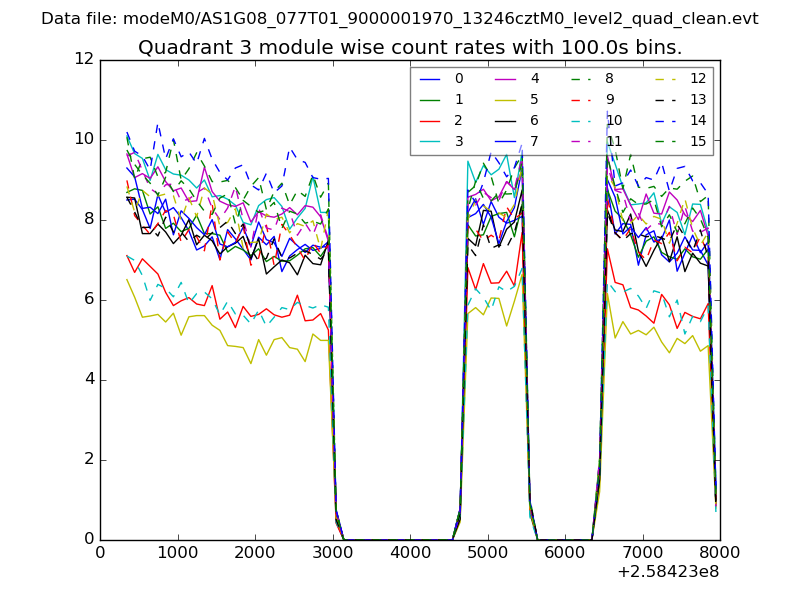 |
 |
| Parameter | Plot |
|---|---|
| CZT HV Monitor | 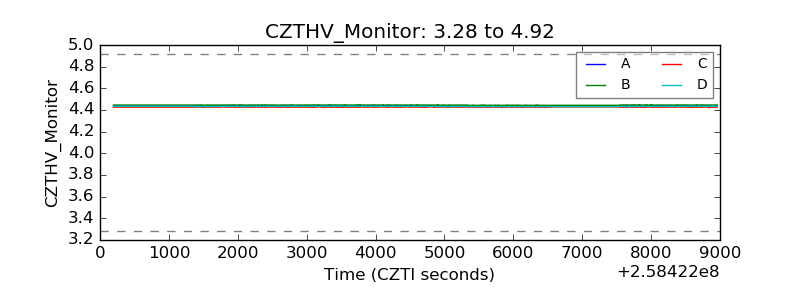 |
| D_VDD | 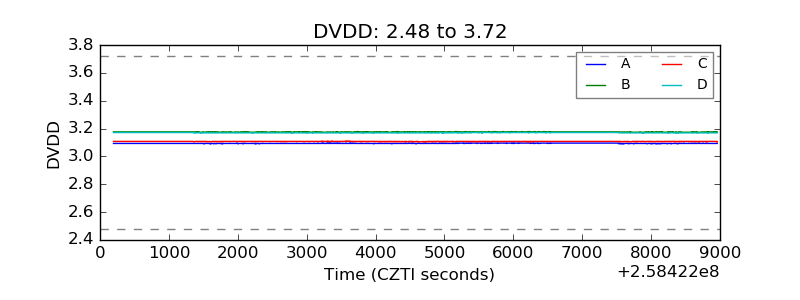 |
| Temperature 1 | 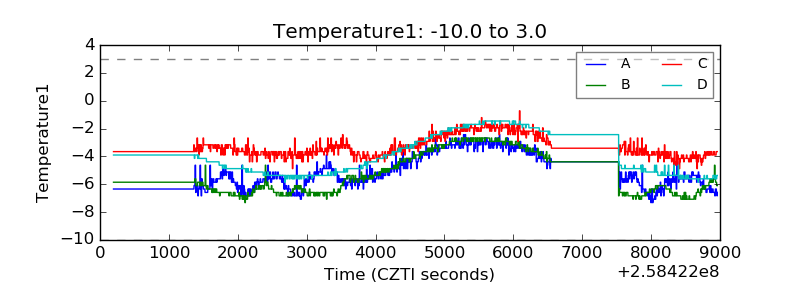 |
| Veto HV Monitor | 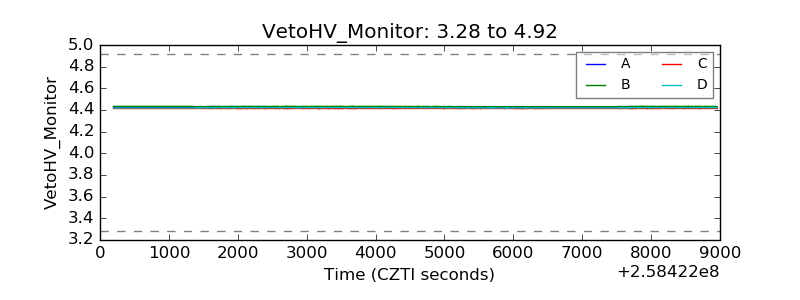 |
| Veto LLD |  |
| Alpha Counter | 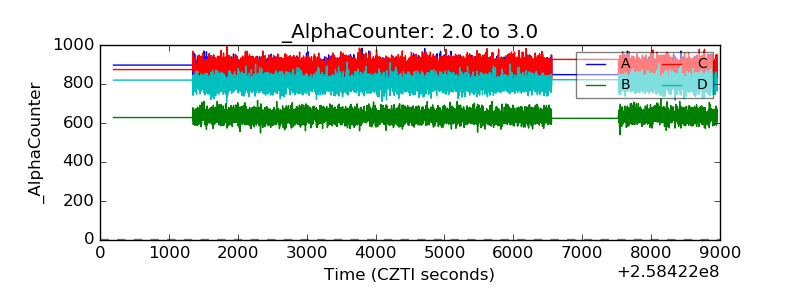 |
| _CPM_Rate | 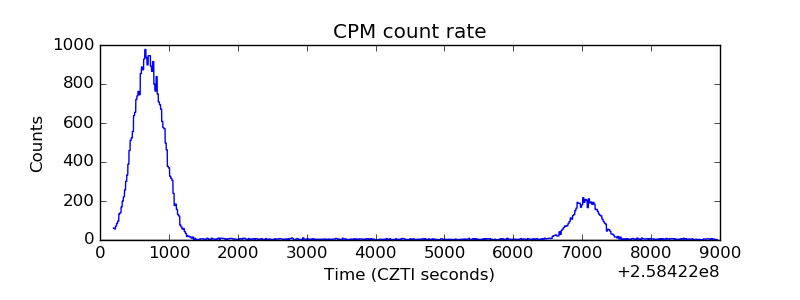 |
| CZT Counter | 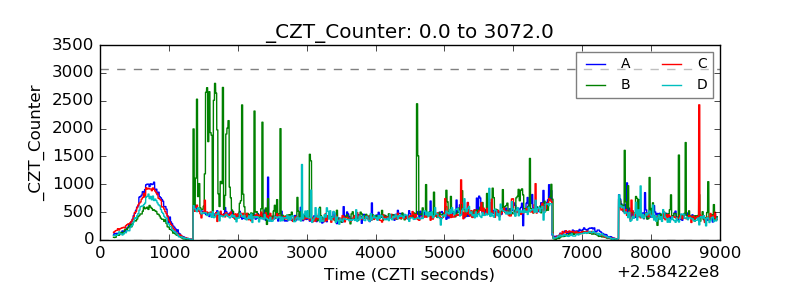 |
| +2.5 Volts monitor |  |
| +5 Volts monitor | 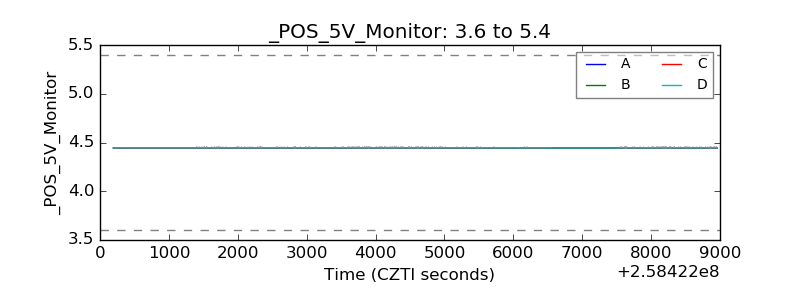 |
| _ROLL_ROT | 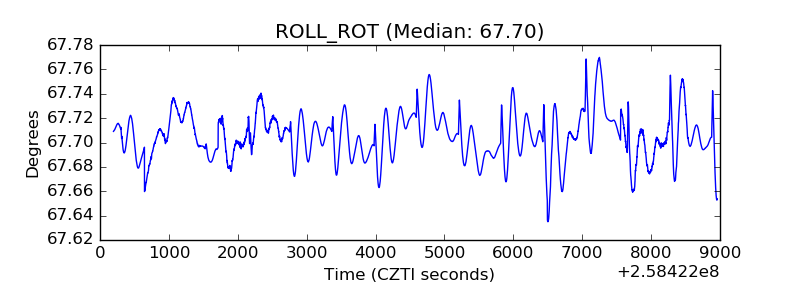 |
| _Roll_DEC |  |
| _Roll_RA | 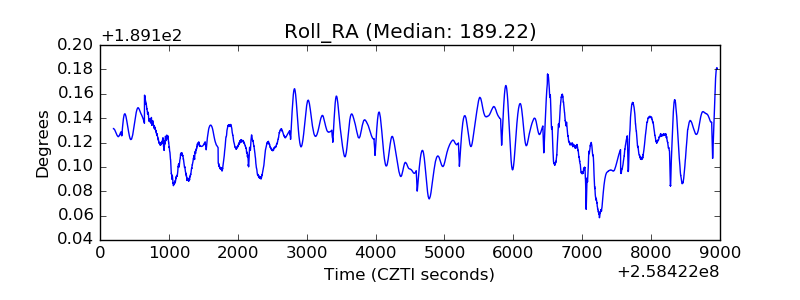 |
| Veto Counter | 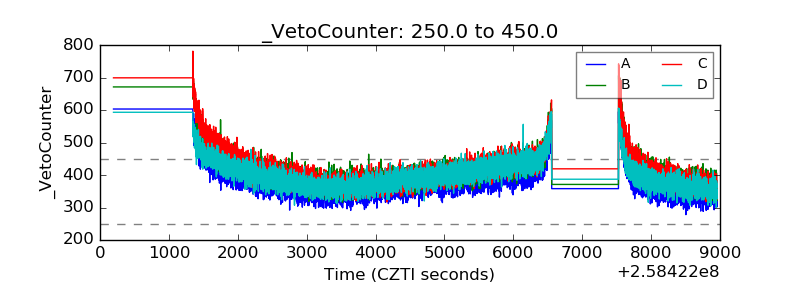 |