| Param | Original file | Final file |
|---|---|---|
| Filename | modeM0/AS1G08_077T01_9000001970_13247cztM0_level2.evt | modeM0/AS1G08_077T01_9000001970_13247cztM0_level2_quad_clean.evt |
| Size (bytes) | 493,822,080 | 106,698,240 |
| Size | 470.9 MB | 101.8 MB |
| Events in quadrant A | 3,390,366 | 677,696 |
| Events in quadrant B | 3,979,079 | 683,424 |
| Events in quadrant C | 3,374,995 | 697,922 |
| Events in quadrant D | 3,718,027 | 667,165 |
| Mode M9 | |||
|---|---|---|---|
| Quadrant | BADHDUFLAG | Total packets | Discarded packets |
| A | 0 | 13 | 0 |
| B | 0 | 13 | 0 |
| C | 0 | 13 | 0 |
| D | 0 | 14 | 0 |
| Mode SS | |||
|---|---|---|---|
| Quadrant | BADHDUFLAG | Total packets | Discarded packets |
| A | 0 | 148 | 0 |
| B | 0 | 148 | 0 |
| C | 0 | 148 | 0 |
| D | 0 | 148 | 0 |
| Mode M0 | |||
|---|---|---|---|
| Quadrant | BADHDUFLAG | Total packets | Discarded packets |
| A | 0 | 15160 | 3 |
| B | 0 | 16925 | 2 |
| C | 0 | 15267 | 2 |
| D | 0 | 16356 | 2 |
| Quadrant | Total seconds | Saturated seconds | Saturation percentage |
|---|---|---|---|
| A | 7259 | 78 | 1.074528% |
| B | 7259 | 303 | 4.174129% |
| C | 7259 | 67 | 0.922992% |
| D | 7259 | 51 | 0.702576% |
Noise dominated data is calculated using 1-second bins in cleaned event files. If a bin has >2000 counts, and if more than 50% of those come from <1% of pixels, then it is considered to be noise-dominated and hence unusable.
| Quadrant | # 1 sec bins | Bins with >0 counts | Bins with >2000 counts | High rate bins dominated by noise | Noise dominated (total time) | Noise dominated (detector-on time) | Marked lightcurve |
|---|---|---|---|---|---|---|---|
| A | 7685 | 7262 | 0 | 0 | 0.00% | 0.00% | 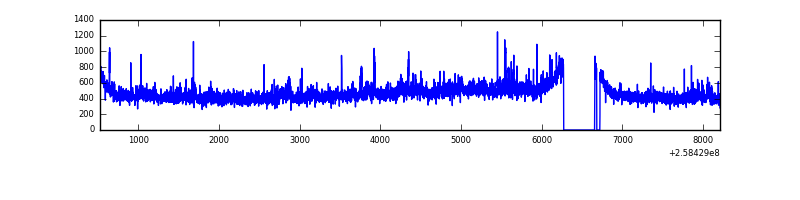 |
| B | 7685 | 7262 | 108 | 108 | 1.41% | 1.49% | 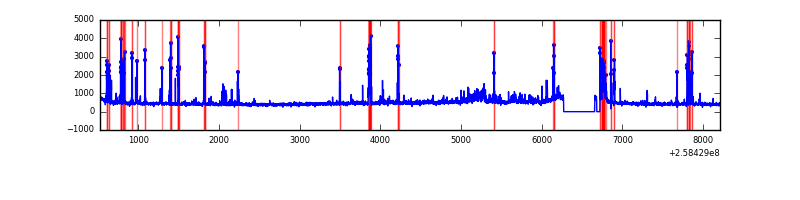 |
| C | 7685 | 7262 | 18 | 18 | 0.23% | 0.25% | 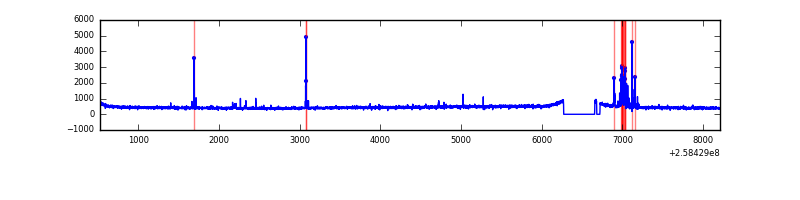 |
| D | 7685 | 7262 | 24 | 24 | 0.31% | 0.33% | 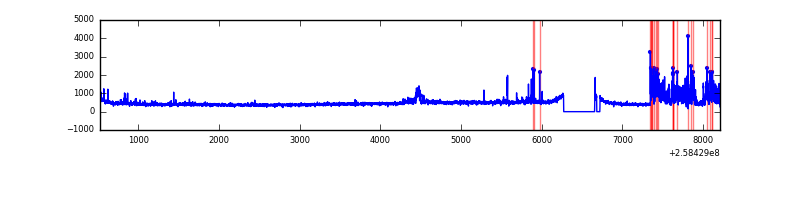 |
Top three noisy pixels from each quadrant. If the there are fewer than three noisy pixels in the level2.evt file, extra rows are filled as -1
| Pixel properties | Quadrant properties | ||||||
|---|---|---|---|---|---|---|---|
| Quadrant | DetID | PixID | Counts | Sigma | Mean | Median | Sigma |
| A | 12 | 189 | 117714 | 694.26 | 829 | 808 | 168.4 |
| A | 15 | 239 | 68264 | 400.59 | 829 | 808 | 168.4 |
| A | 1 | 162 | 11465 | 63.29 | 829 | 808 | 168.4 |
| B | 4 | 239 | 540676 | 3440.39 | 828 | 806 | 156.9 |
| B | 0 | 230 | 92000 | 581.15 | 828 | 806 | 156.9 |
| B | 4 | 142 | 55141 | 346.26 | 828 | 806 | 156.9 |
| C | 15 | 208 | 133320 | 700.02 | 820 | 821 | 189.3 |
| C | 14 | 234 | 33164 | 170.87 | 820 | 821 | 189.3 |
| C | 13 | 61 | 5948 | 27.09 | 820 | 821 | 189.3 |
| D | 1 | 52 | 499023 | 2568.64 | 807 | 782 | 194.0 |
| D | 5 | 222 | 50390 | 255.75 | 807 | 782 | 194.0 |
| D | 8 | 195 | 47137 | 238.98 | 807 | 782 | 194.0 |
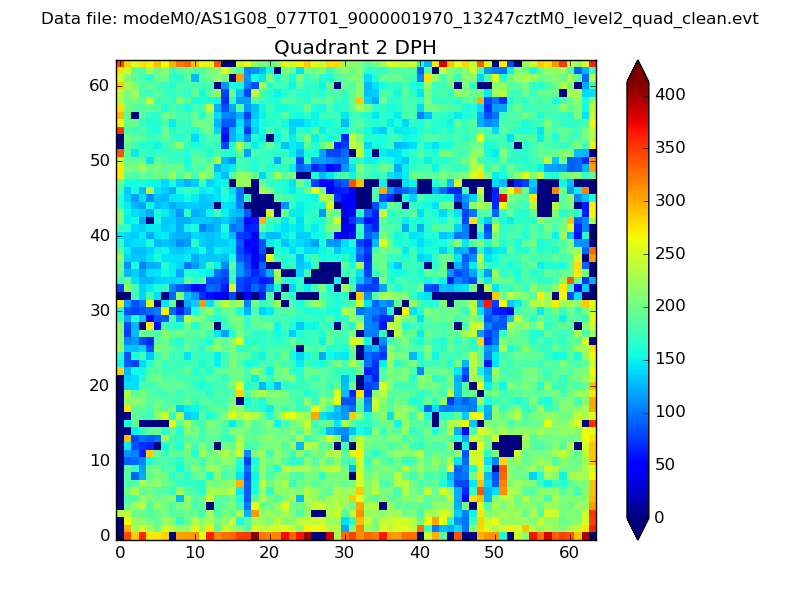
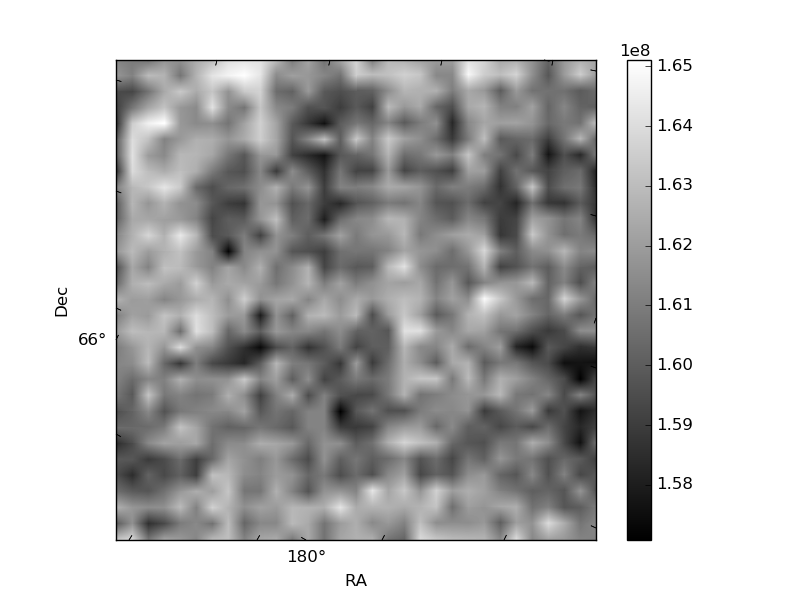
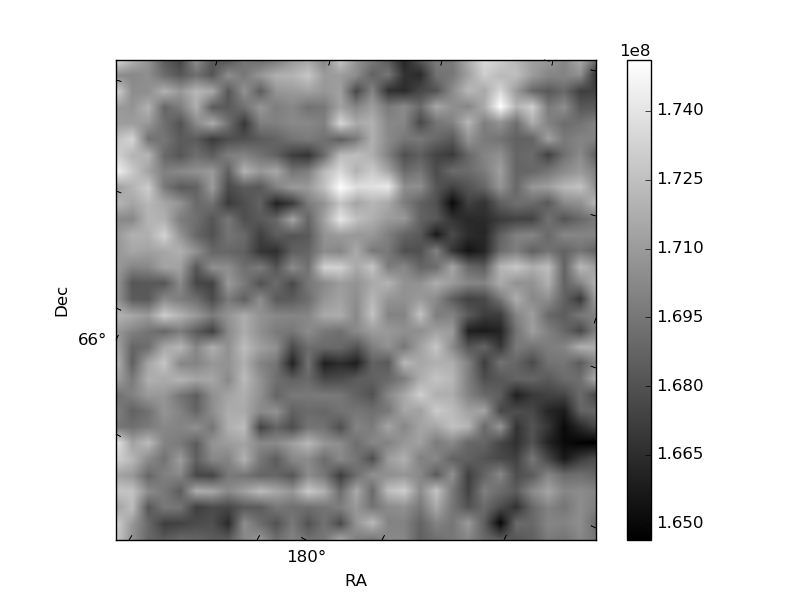
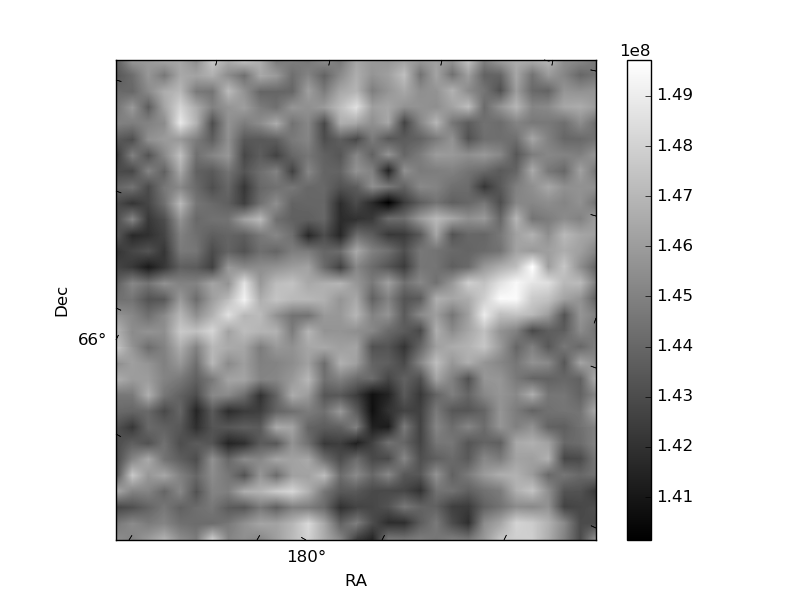
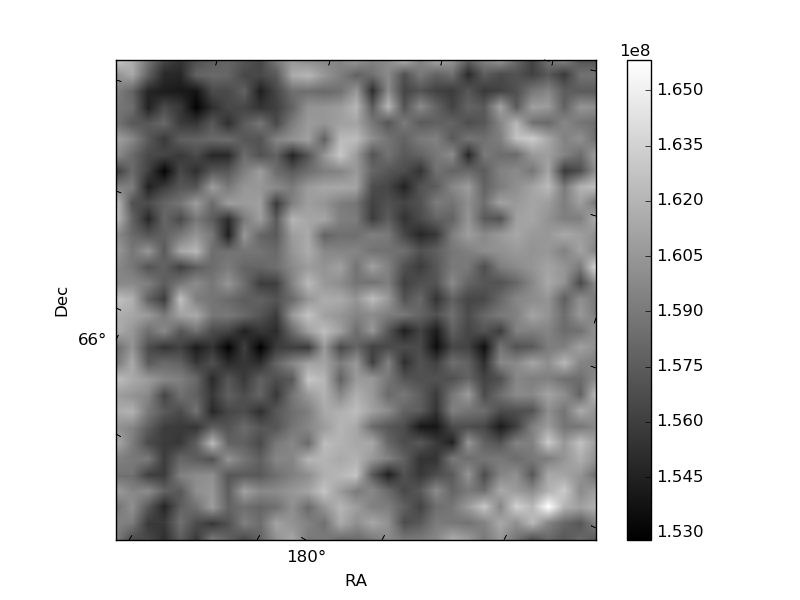
Histogram calculated using DETX and DETY for each event in the final _common_clean file
| Quadrant A | 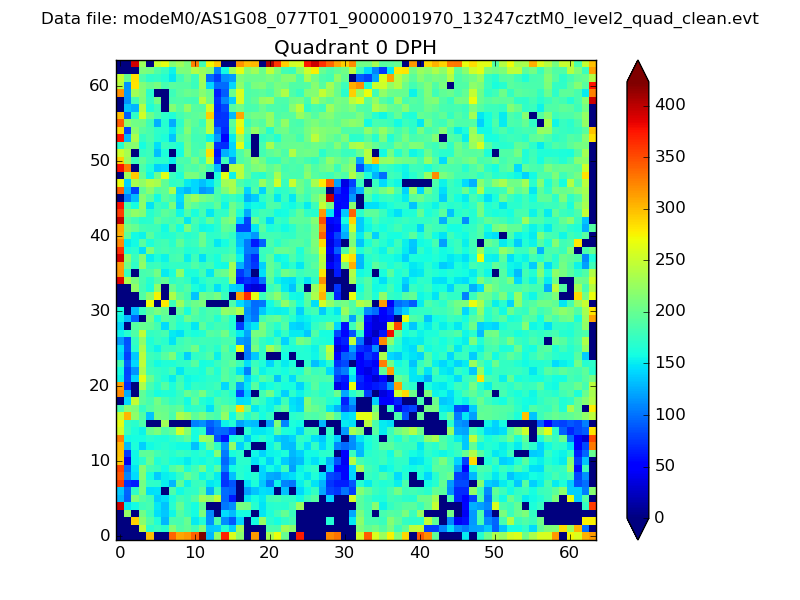 |
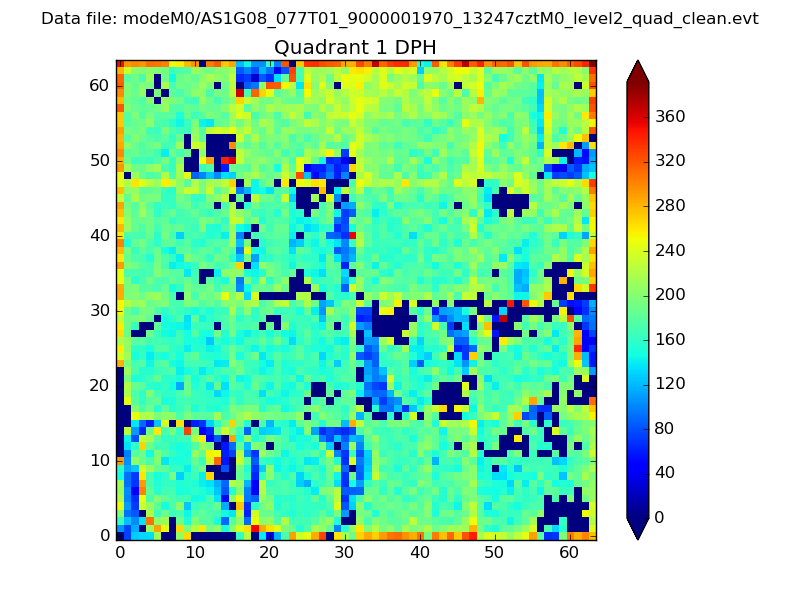 |
Quadrant B |
|---|---|---|---|
| Quadrant D | 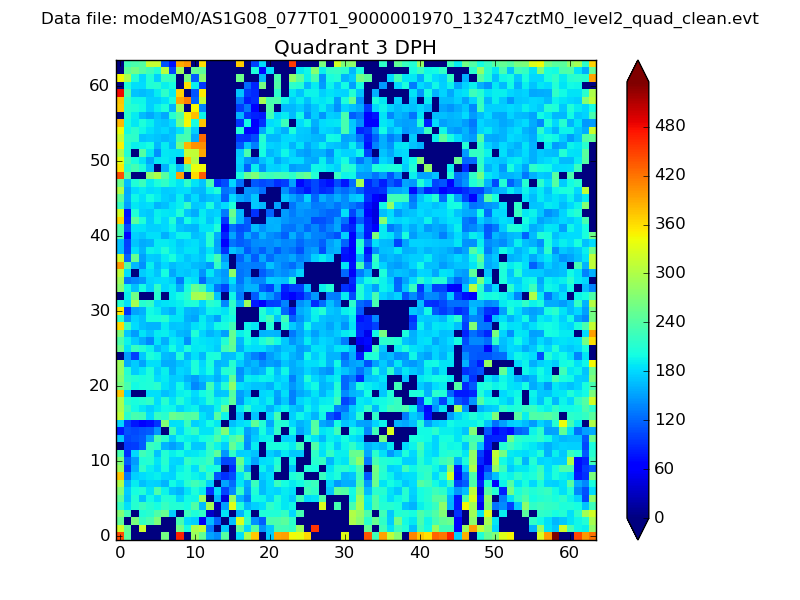 |
 |
Quadrant C |
| Plot type | Count rate plots | Images |
|---|---|---|
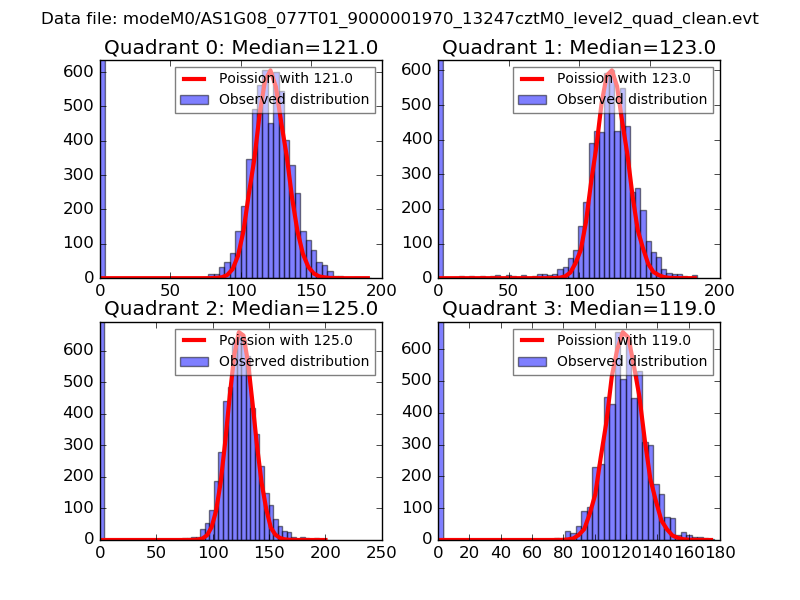
| Comparison with Poisson distribution Blue bars denote a histogram of data divided into 1 sec bins. Red curve is a Poisson curve with rate = median count rate of data. |
 |
 |
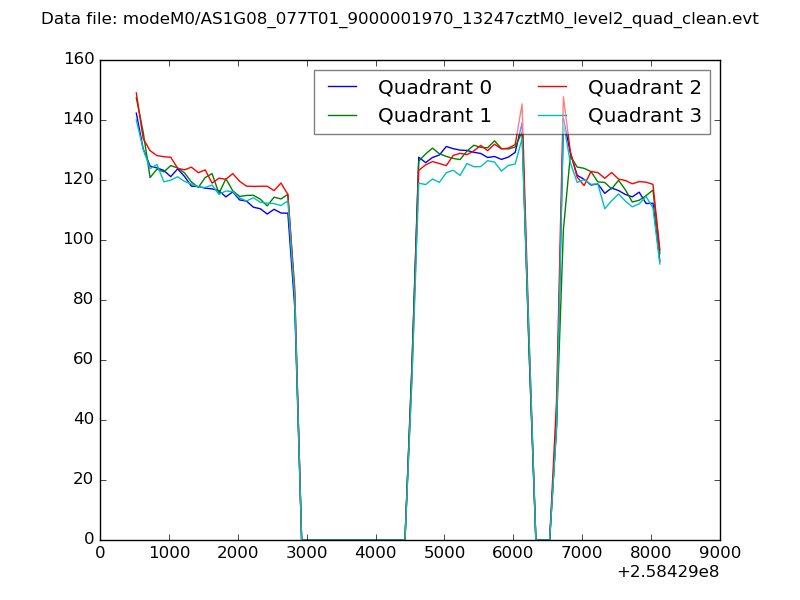
| Quadrant-wise count rates Data is divided into 100 sec bins |
 |
|
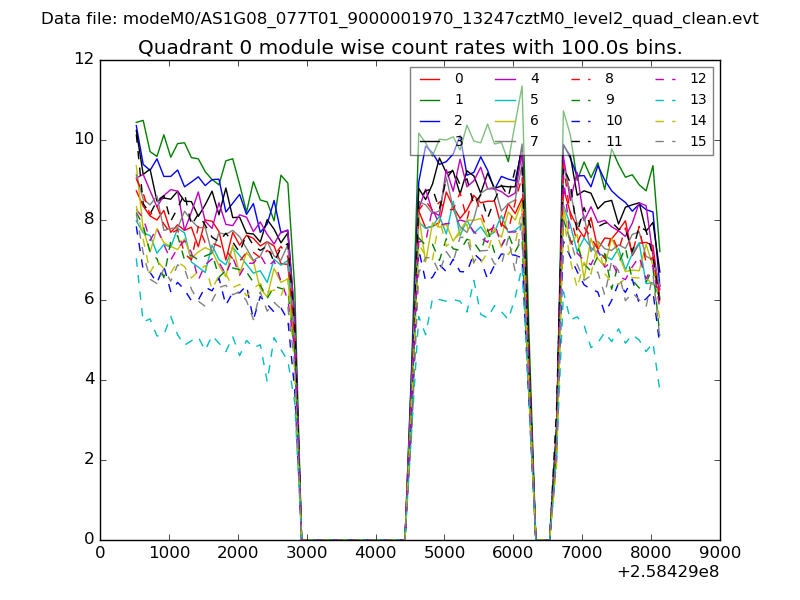
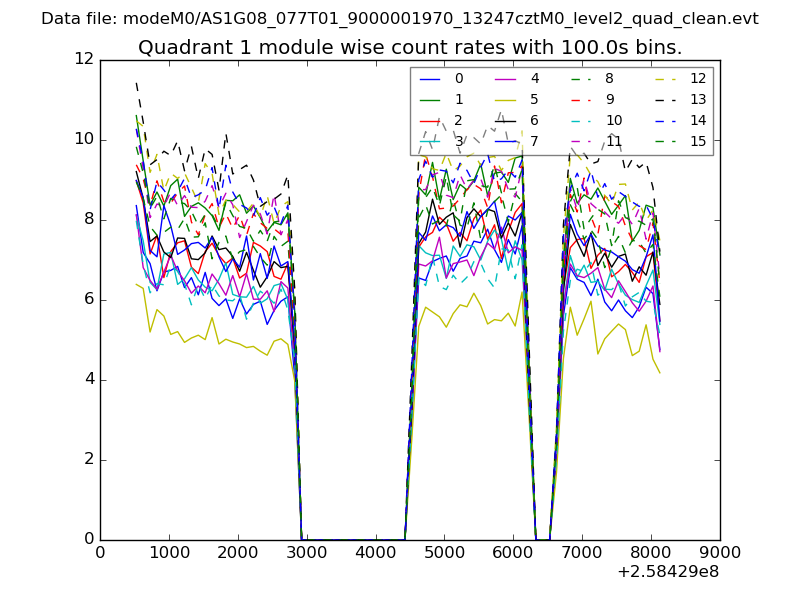
| Module-wise count rates for Quadrant A Data is divided into 100 sec bins |
 |
 |
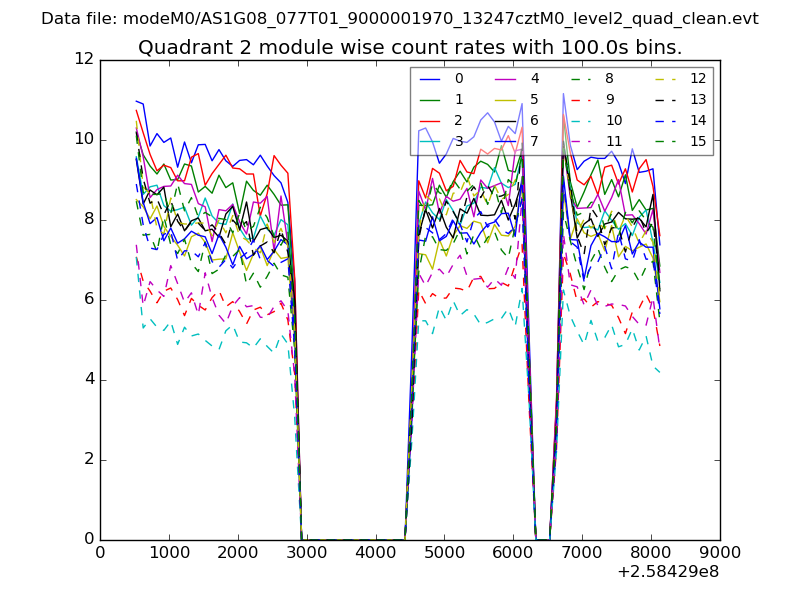
| Module-wise count rates for Quadrant B Data is divided into 100 sec bins |
 |
 |
| Module-wise count rates for Quadrant C Data is divided into 100 sec bins |
 |
 |
| Module-wise count rates for Quadrant D Data is divided into 100 sec bins |
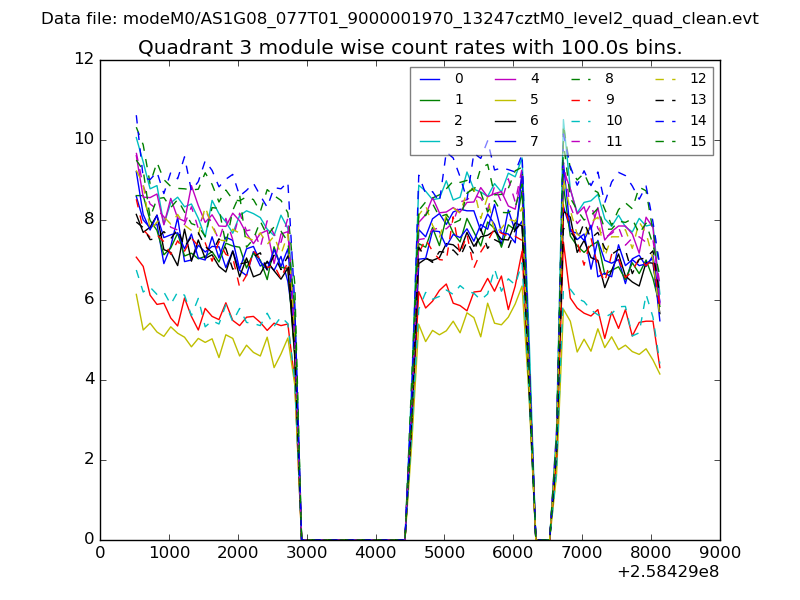 |
 |
| Parameter | Plot |
|---|---|
| CZT HV Monitor | 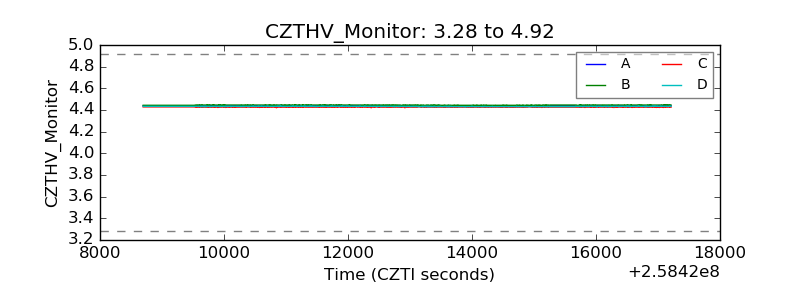 |
| D_VDD | 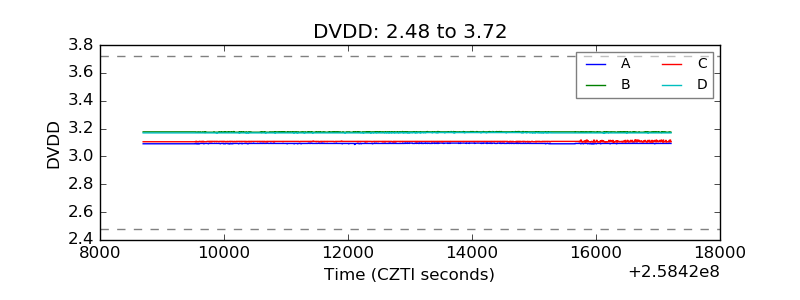 |
| Temperature 1 | 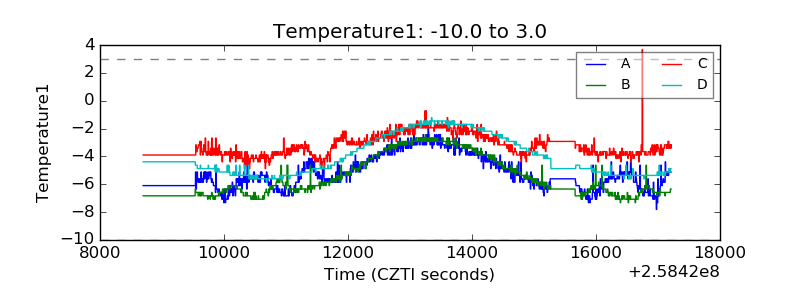 |
| Veto HV Monitor |  |
| Veto LLD | 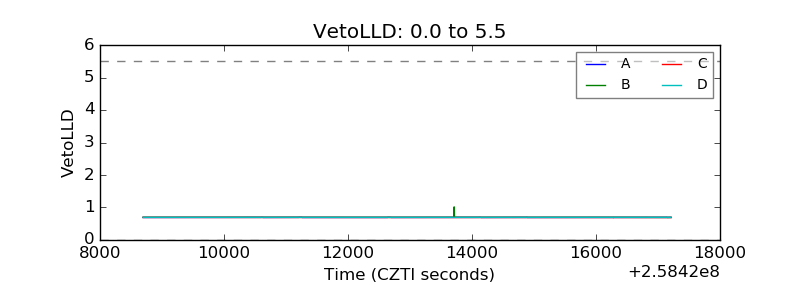 |
| Alpha Counter | 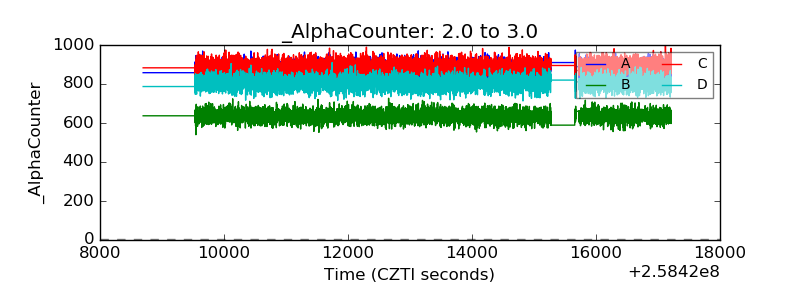 |
| _CPM_Rate | 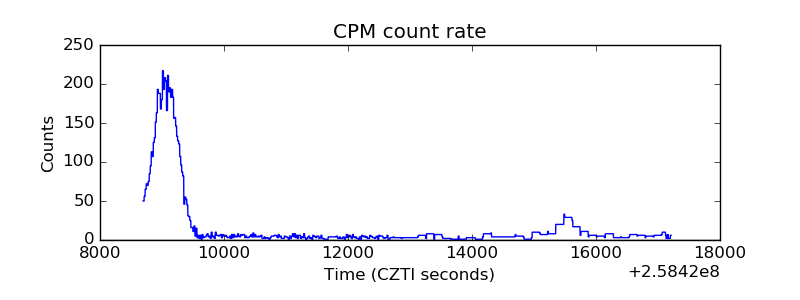 |
| CZT Counter | 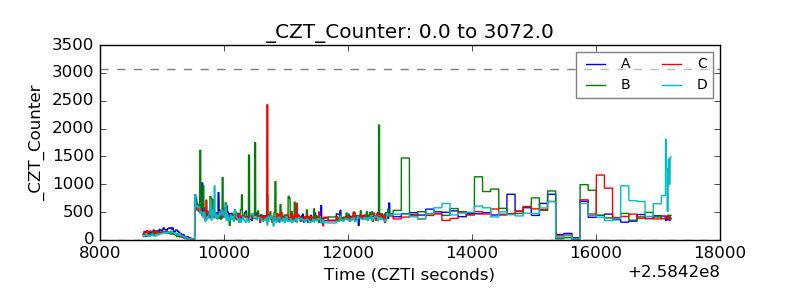 |
| +2.5 Volts monitor |  |
| +5 Volts monitor |  |
| _ROLL_ROT | 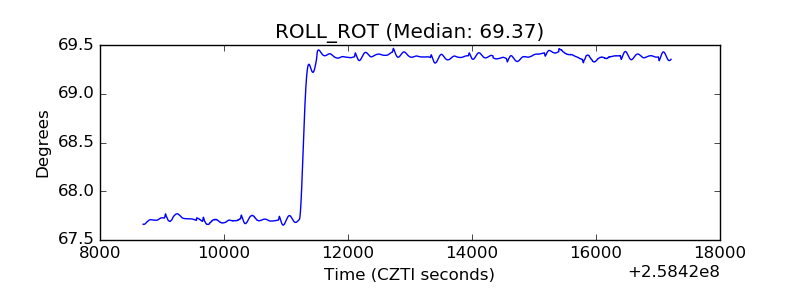 |
| _Roll_DEC | 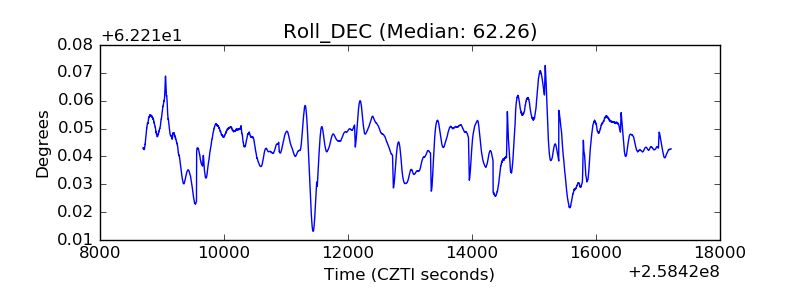 |
| _Roll_RA | 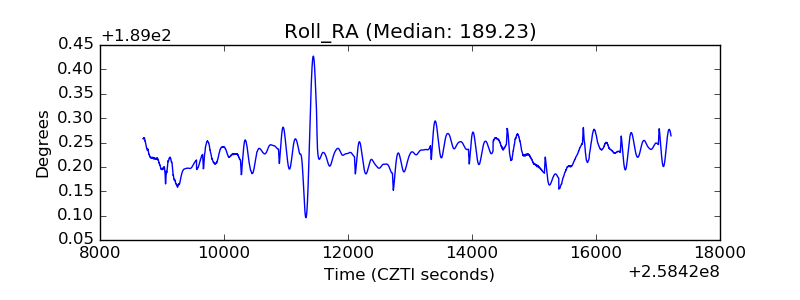 |
| Veto Counter | 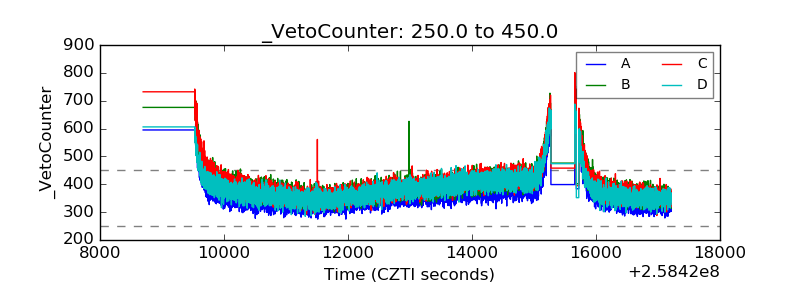 |