| Param | Original file | Final file |
|---|---|---|
| Filename | modeM0/AS1G08_077T01_9000001970_13248cztM0_level2.evt | modeM0/AS1G08_077T01_9000001970_13248cztM0_level2_quad_clean.evt |
| Size (bytes) | 553,705,920 | 111,312,000 |
| Size | 528.1 MB | 106.2 MB |
| Events in quadrant A | 3,613,842 | 707,101 |
| Events in quadrant B | 3,909,323 | 720,509 |
| Events in quadrant C | 3,503,204 | 729,152 |
| Events in quadrant D | 5,226,356 | 685,150 |
| Mode M9 | |||
|---|---|---|---|
| Quadrant | BADHDUFLAG | Total packets | Discarded packets |
| A | 0 | 1 | 0 |
| B | 0 | 1 | 0 |
| C | 0 | 1 | 0 |
| D | 0 | 1 | 0 |
| Mode SS | |||
|---|---|---|---|
| Quadrant | BADHDUFLAG | Total packets | Discarded packets |
| A | 0 | 154 | 0 |
| B | 0 | 154 | 0 |
| C | 0 | 154 | 0 |
| D | 0 | 154 | 0 |
| Mode M0 | |||
|---|---|---|---|
| Quadrant | BADHDUFLAG | Total packets | Discarded packets |
| A | 0 | 16052 | 2 |
| B | 0 | 16853 | 1 |
| C | 0 | 15950 | 1 |
| D | 0 | 20973 | 1 |
| Quadrant | Total seconds | Saturated seconds | Saturation percentage |
|---|---|---|---|
| A | 7607 | 112 | 1.472328% |
| B | 7607 | 269 | 3.536217% |
| C | 7607 | 54 | 0.709872% |
| D | 7607 | 313 | 4.114631% |
Noise dominated data is calculated using 1-second bins in cleaned event files. If a bin has >2000 counts, and if more than 50% of those come from <1% of pixels, then it is considered to be noise-dominated and hence unusable.
| Quadrant | # 1 sec bins | Bins with >0 counts | Bins with >2000 counts | High rate bins dominated by noise | Noise dominated (total time) | Noise dominated (detector-on time) | Marked lightcurve |
|---|---|---|---|---|---|---|---|
| A | 7683 | 7609 | 0 | 0 | 0.00% | 0.00% | 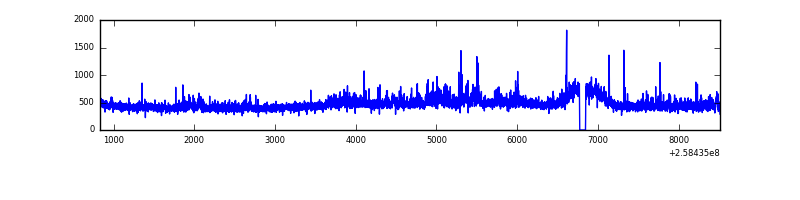 |
| B | 7683 | 7609 | 84 | 84 | 1.09% | 1.10% | 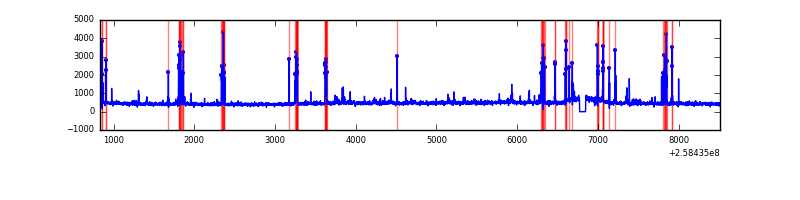 |
| C | 7683 | 7609 | 18 | 18 | 0.23% | 0.24% | 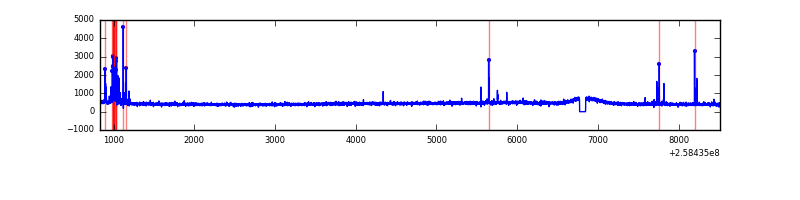 |
| D | 7683 | 7609 | 234 | 234 | 3.05% | 3.08% | 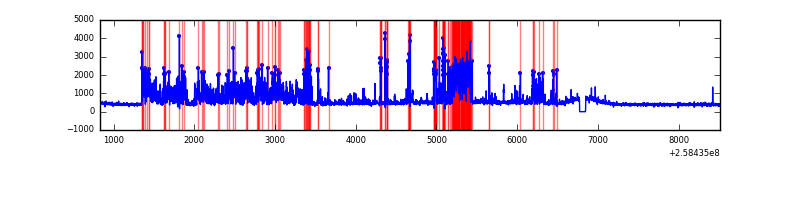 |
Top three noisy pixels from each quadrant. If the there are fewer than three noisy pixels in the level2.evt file, extra rows are filled as -1
| Pixel properties | Quadrant properties | ||||||
|---|---|---|---|---|---|---|---|
| Quadrant | DetID | PixID | Counts | Sigma | Mean | Median | Sigma |
| A | 12 | 189 | 215280 | 1213.66 | 863 | 842 | 176.7 |
| A | 15 | 239 | 64331 | 359.33 | 863 | 842 | 176.7 |
| A | 1 | 162 | 11774 | 61.87 | 863 | 842 | 176.7 |
| B | 4 | 239 | 412234 | 2514.56 | 866 | 843 | 163.6 |
| B | 0 | 214 | 33624 | 200.37 | 866 | 843 | 163.6 |
| B | 4 | 80 | 28488 | 168.98 | 866 | 843 | 163.6 |
| C | 15 | 208 | 143384 | 727.39 | 851 | 853 | 195.9 |
| C | 14 | 234 | 19075 | 92.99 | 851 | 853 | 195.9 |
| C | 8 | 128 | 11897 | 56.36 | 851 | 853 | 195.9 |
| D | 1 | 52 | 2019008 | 10134.51 | 829 | 802 | 199.1 |
| D | 8 | 195 | 37708 | 185.33 | 829 | 802 | 199.1 |
| D | 2 | 234 | 29269 | 142.95 | 829 | 802 | 199.1 |
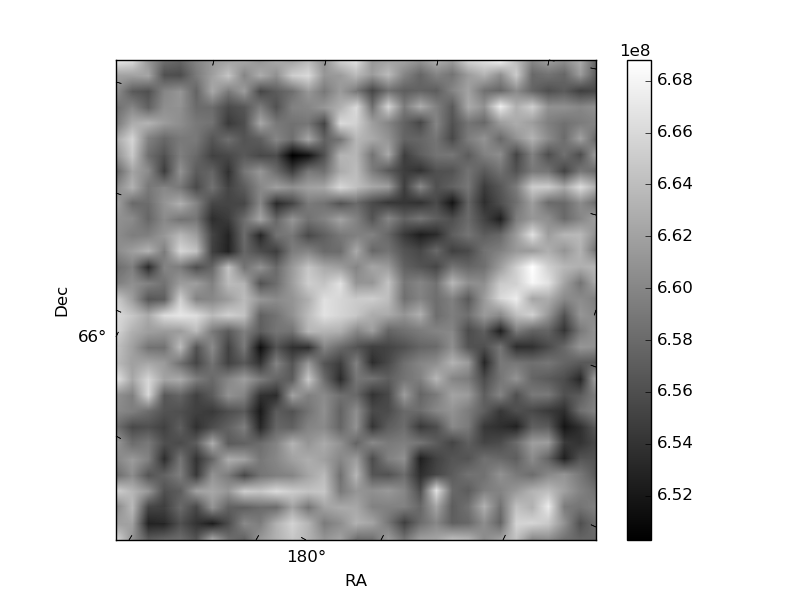
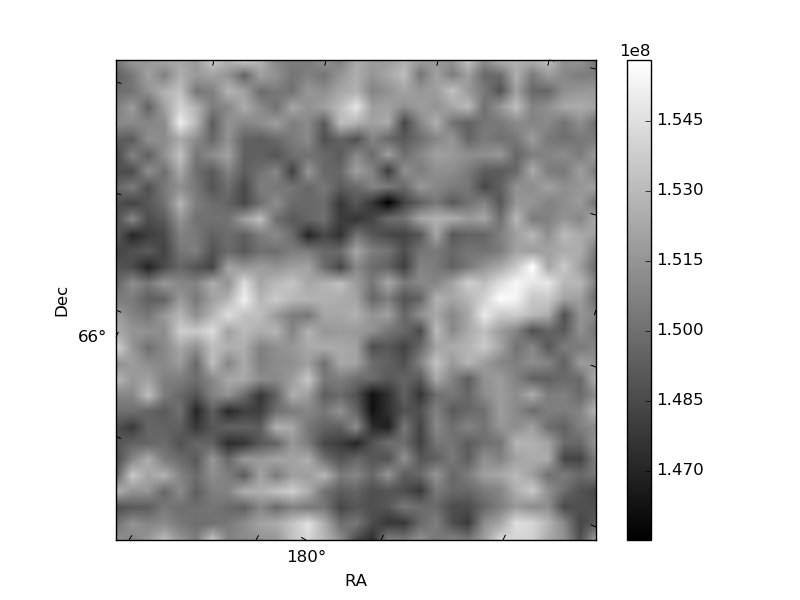
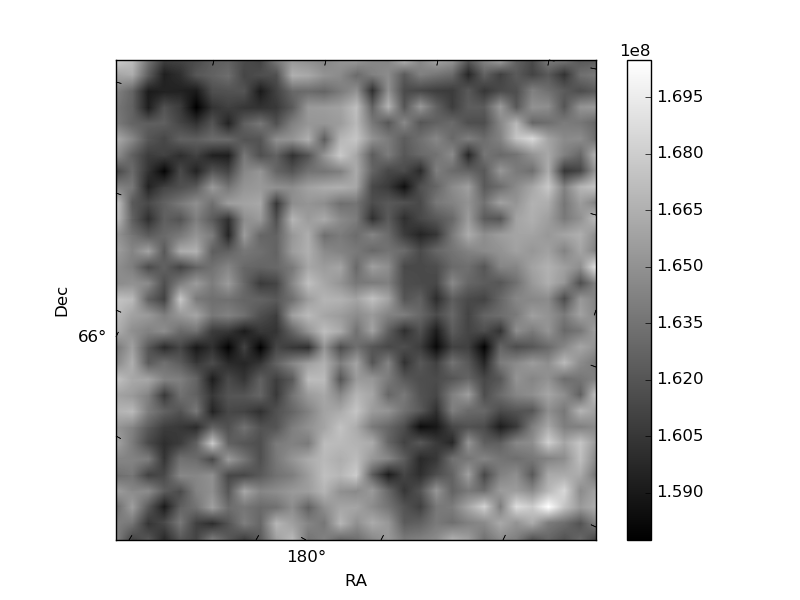
Histogram calculated using DETX and DETY for each event in the final _common_clean file
| Quadrant A | 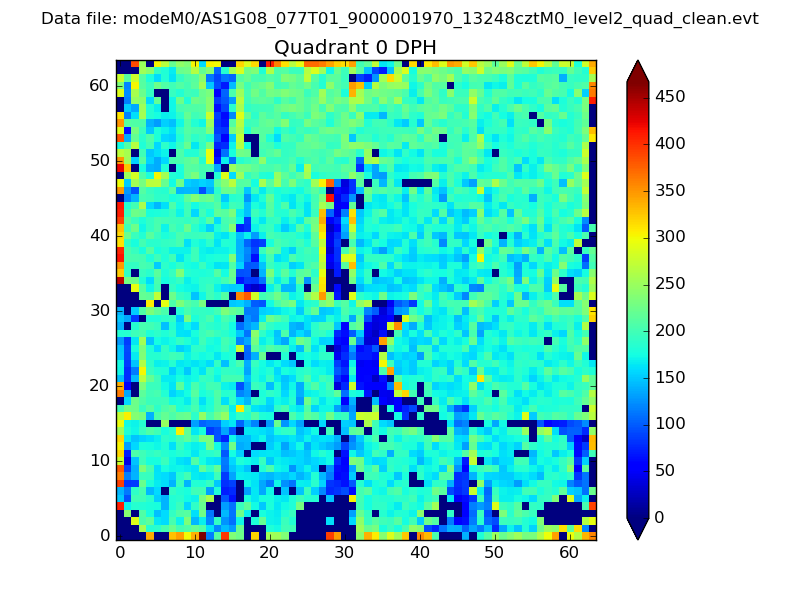 |
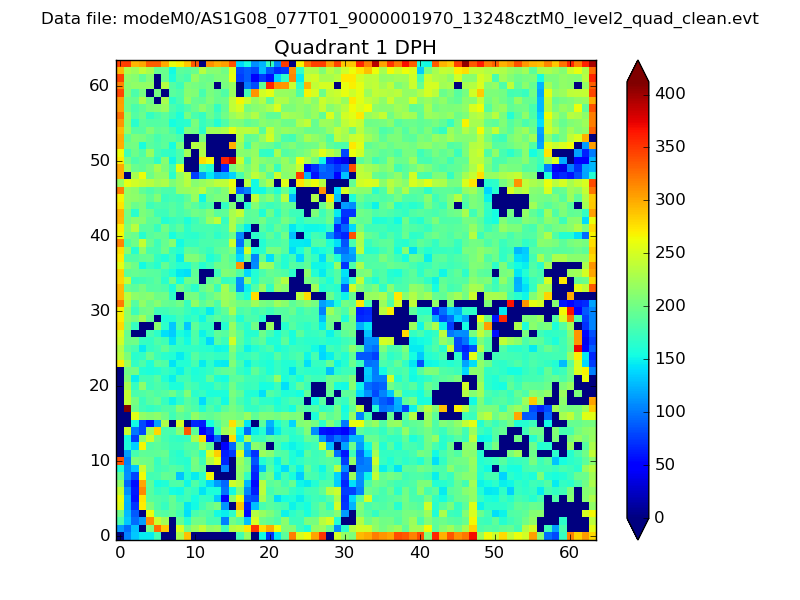 |
Quadrant B |
|---|---|---|---|
| Quadrant D | 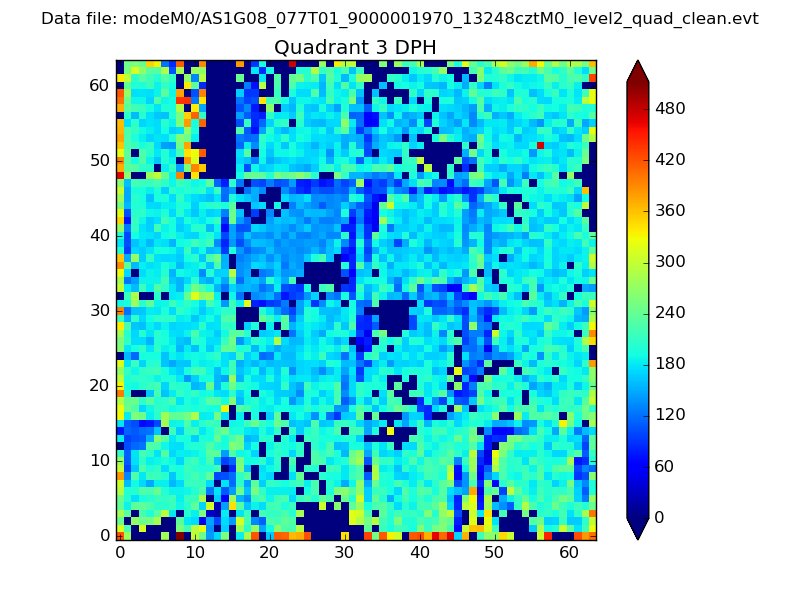 |
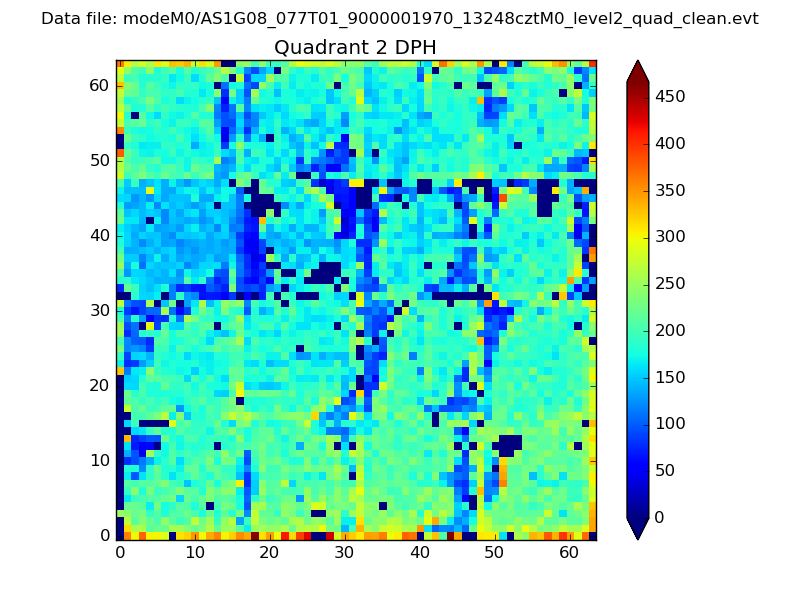 |
Quadrant C |
| Plot type | Count rate plots | Images |
|---|---|---|
| Comparison with Poisson distribution Blue bars denote a histogram of data divided into 1 sec bins. Red curve is a Poisson curve with rate = median count rate of data. |
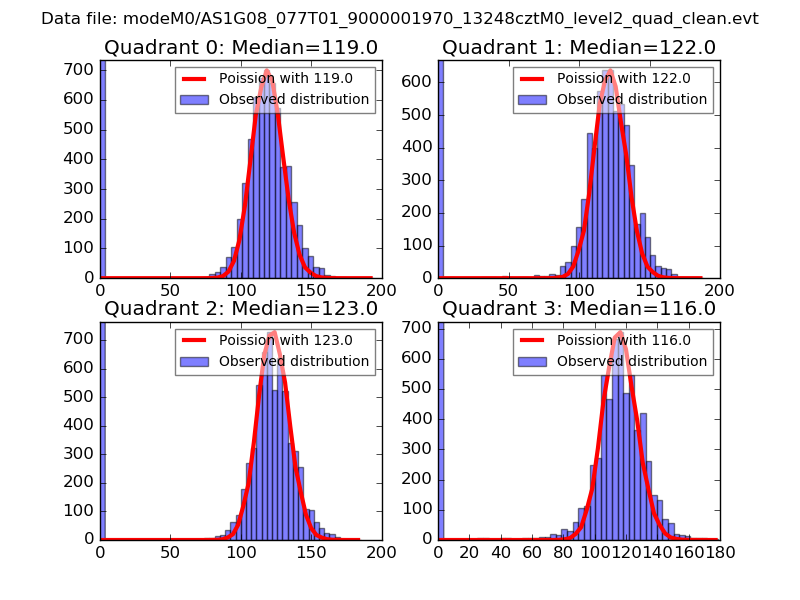 |
 |
| Quadrant-wise count rates Data is divided into 100 sec bins |
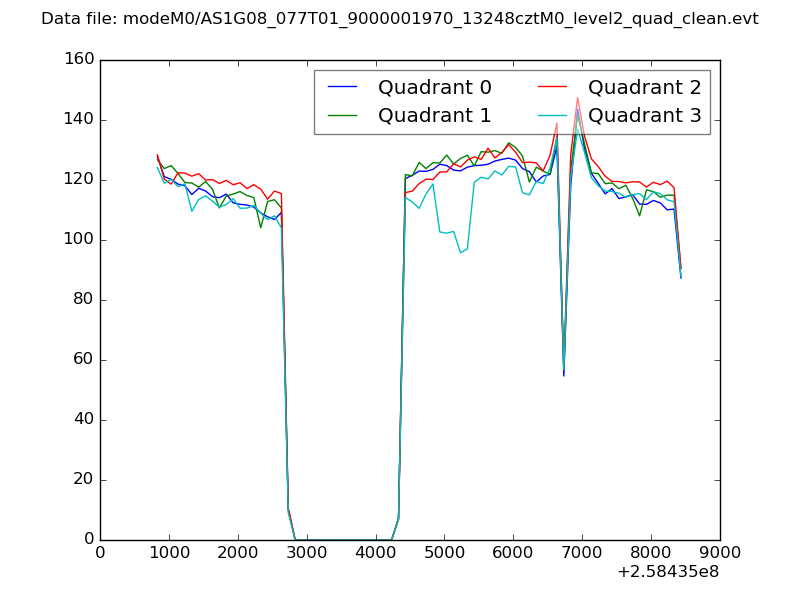 |
|
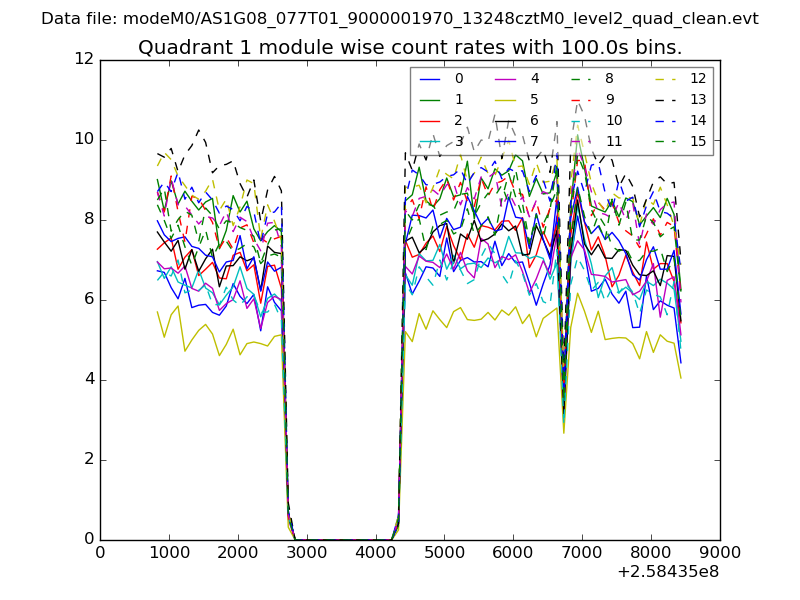
| Module-wise count rates for Quadrant A Data is divided into 100 sec bins |
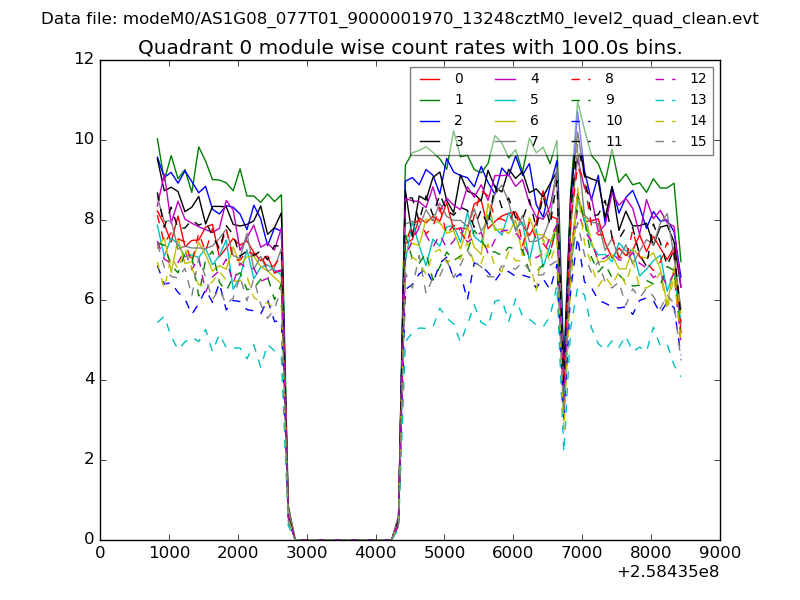 |
 |
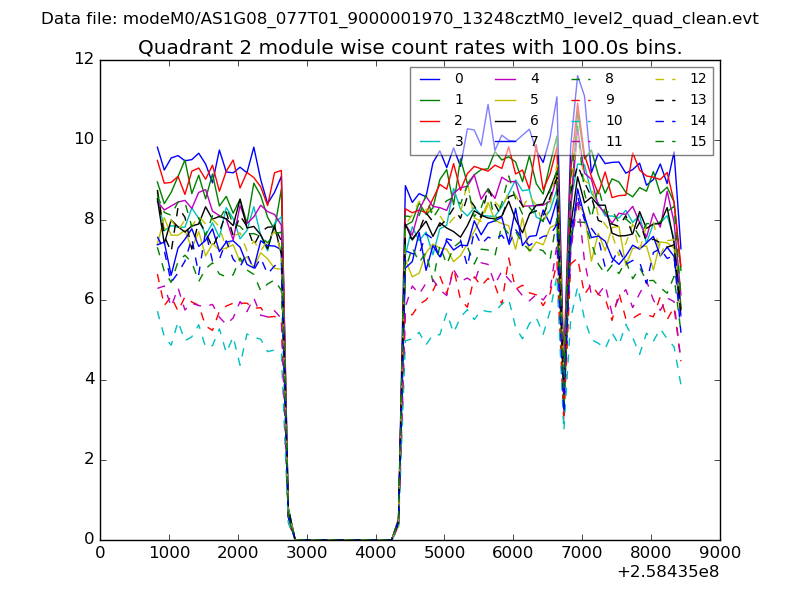
| Module-wise count rates for Quadrant B Data is divided into 100 sec bins |
 |
 |
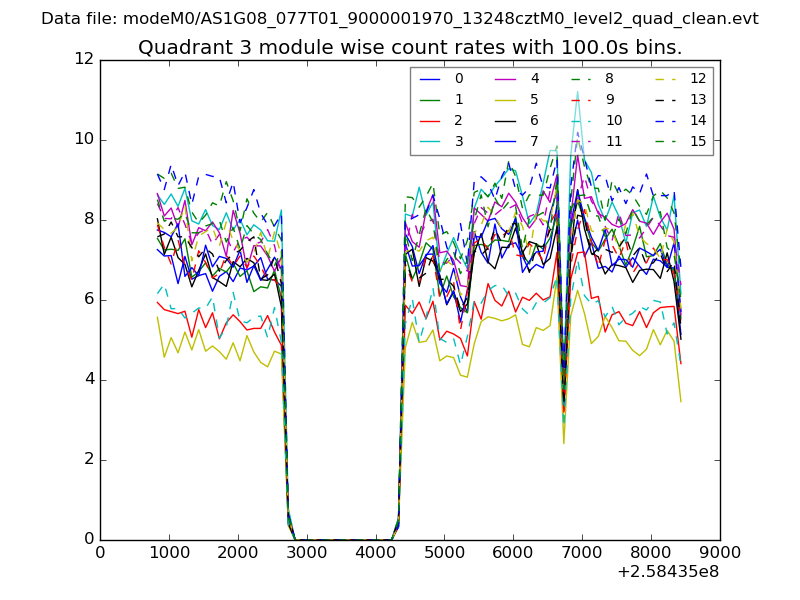
| Module-wise count rates for Quadrant C Data is divided into 100 sec bins |
 |
 |
| Module-wise count rates for Quadrant D Data is divided into 100 sec bins |
 |
 |
| Parameter | Plot |
|---|---|
| CZT HV Monitor | 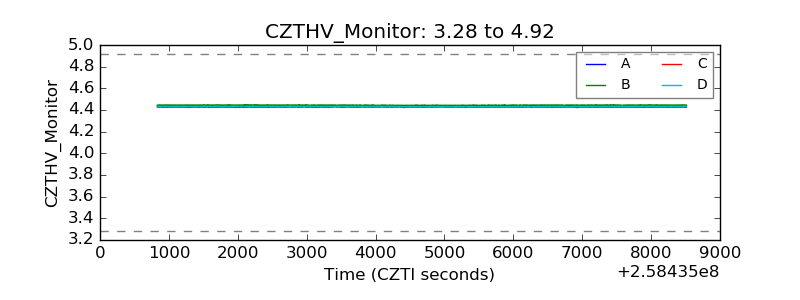 |
| D_VDD | 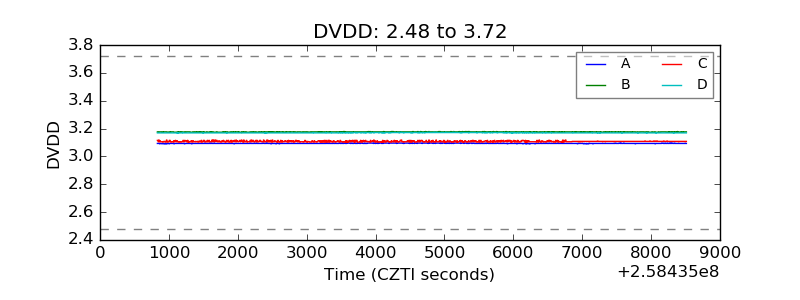 |
| Temperature 1 |  |
| Veto HV Monitor | 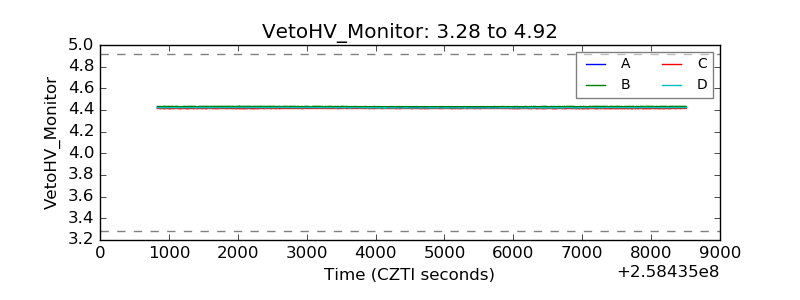 |
| Veto LLD |  |
| Alpha Counter | 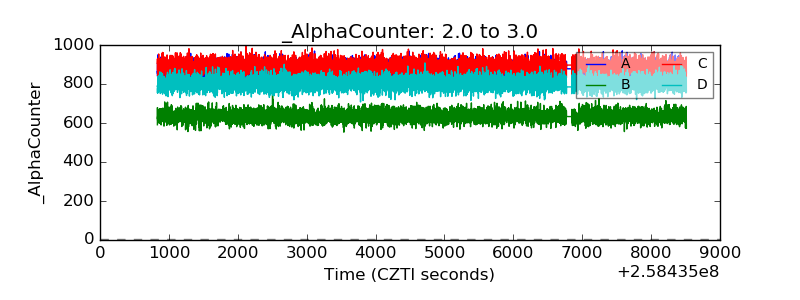 |
| _CPM_Rate | 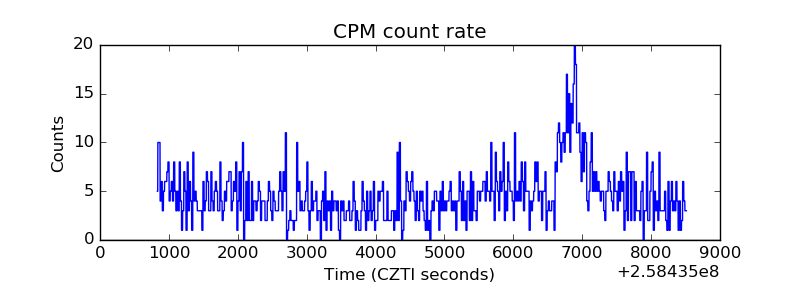 |
| CZT Counter | 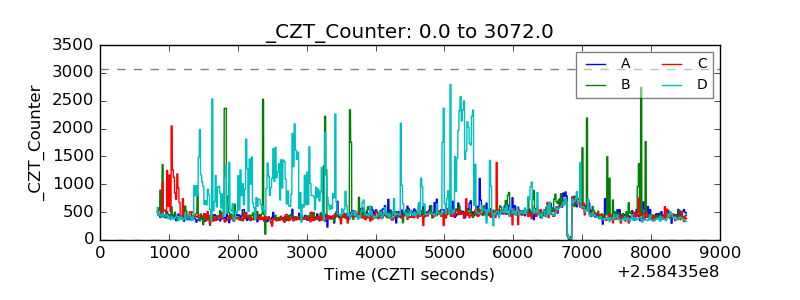 |
| +2.5 Volts monitor |  |
| +5 Volts monitor |  |
| _ROLL_ROT | 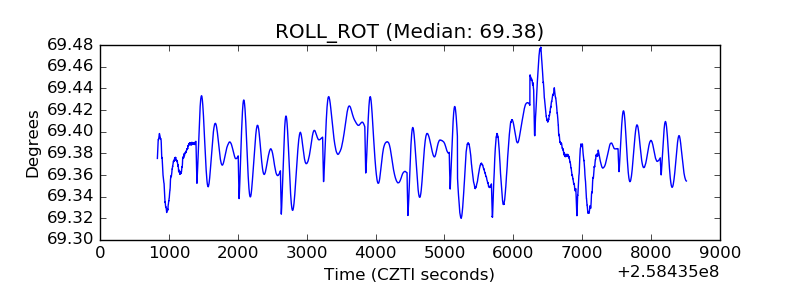 |
| _Roll_DEC | 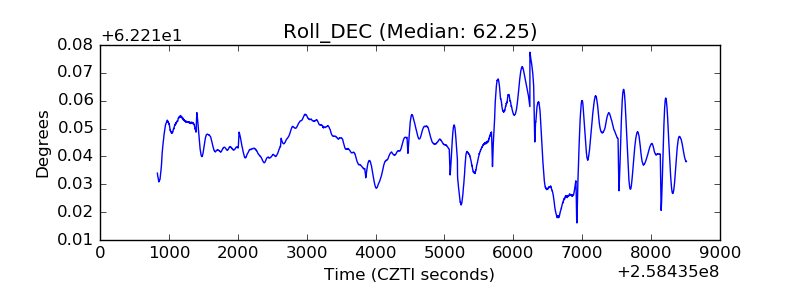 |
| _Roll_RA | 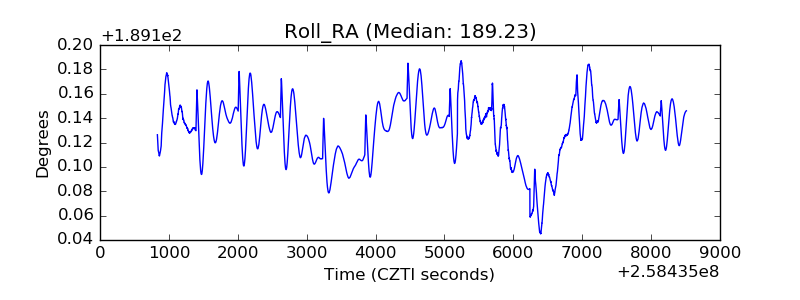 |
| Veto Counter | 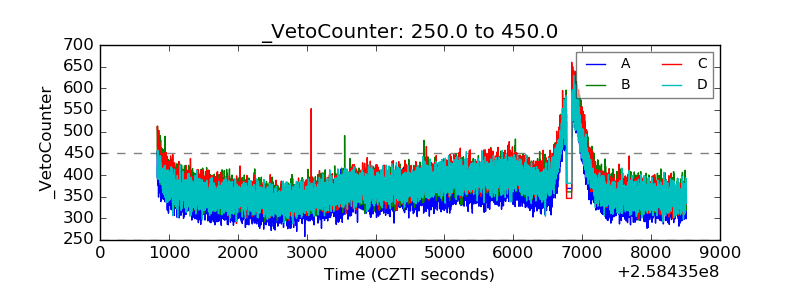 |