| Param | Original file | Final file |
|---|---|---|
| Filename | modeM0/AS1G08_077T01_9000001970_13249cztM0_level2.evt | modeM0/AS1G08_077T01_9000001970_13249cztM0_level2_quad_clean.evt |
| Size (bytes) | 501,310,080 | 101,583,360 |
| Size | 478.1 MB | 96.9 MB |
| Events in quadrant A | 3,823,468 | 632,025 |
| Events in quadrant B | 4,016,038 | 638,203 |
| Events in quadrant C | 3,368,013 | 652,759 |
| Events in quadrant D | 3,460,259 | 626,784 |
| Mode M9 | |||
|---|---|---|---|
| Quadrant | BADHDUFLAG | Total packets | Discarded packets |
| A | 0 | 3 | 0 |
| B | 0 | 3 | 0 |
| C | 0 | 3 | 0 |
| D | 0 | 3 | 0 |
| Mode SS | |||
|---|---|---|---|
| Quadrant | BADHDUFLAG | Total packets | Discarded packets |
| A | 0 | 154 | 0 |
| B | 0 | 154 | 0 |
| C | 0 | 154 | 0 |
| D | 0 | 154 | 0 |
| Mode M0 | |||
|---|---|---|---|
| Quadrant | BADHDUFLAG | Total packets | Discarded packets |
| A | 0 | 16455 | 2 |
| B | 0 | 17042 | 1 |
| C | 0 | 15548 | 1 |
| D | 0 | 15839 | 1 |
| Quadrant | Total seconds | Saturated seconds | Saturation percentage |
|---|---|---|---|
| A | 7574 | 144 | 1.901241% |
| B | 7574 | 295 | 3.894904% |
| C | 7574 | 96 | 1.267494% |
| D | 7574 | 99 | 1.307103% |
Noise dominated data is calculated using 1-second bins in cleaned event files. If a bin has >2000 counts, and if more than 50% of those come from <1% of pixels, then it is considered to be noise-dominated and hence unusable.
| Quadrant | # 1 sec bins | Bins with >0 counts | Bins with >2000 counts | High rate bins dominated by noise | Noise dominated (total time) | Noise dominated (detector-on time) | Marked lightcurve |
|---|---|---|---|---|---|---|---|
| A | 7780 | 7578 | 15 | 15 | 0.19% | 0.20% | 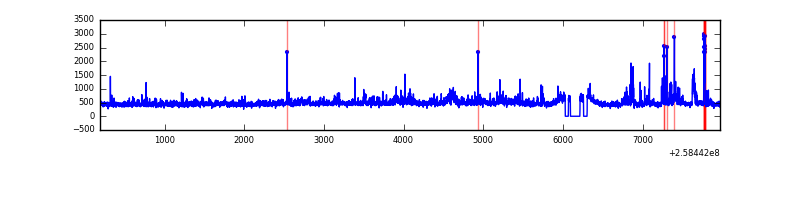 |
| B | 7780 | 7578 | 103 | 103 | 1.32% | 1.36% | 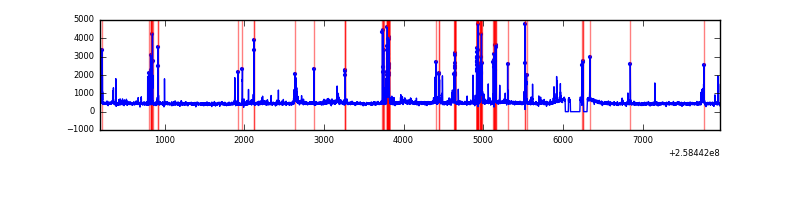 |
| C | 7780 | 7578 | 10 | 10 | 0.13% | 0.13% | 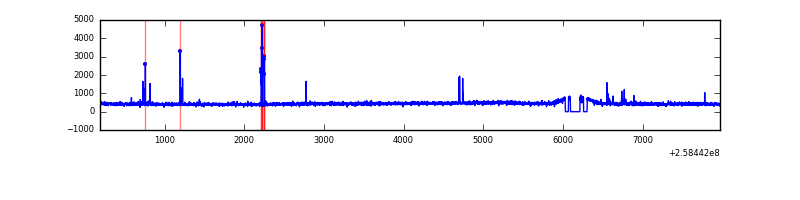 |
| D | 7780 | 7578 | 9 | 9 | 0.12% | 0.12% | 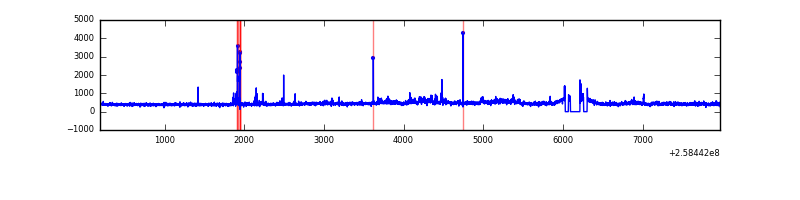 |
Top three noisy pixels from each quadrant. If the there are fewer than three noisy pixels in the level2.evt file, extra rows are filled as -1
| Pixel properties | Quadrant properties | ||||||
|---|---|---|---|---|---|---|---|
| Quadrant | DetID | PixID | Counts | Sigma | Mean | Median | Sigma |
| A | 12 | 189 | 376321 | 2130.52 | 856 | 838 | 176.2 |
| A | 15 | 239 | 85823 | 482.21 | 856 | 838 | 176.2 |
| A | 14 | 111 | 33775 | 186.89 | 856 | 838 | 176.2 |
| B | 4 | 239 | 555663 | 3356.22 | 856 | 833 | 165.3 |
| B | 0 | 214 | 45214 | 268.46 | 856 | 833 | 165.3 |
| B | 4 | 80 | 28172 | 165.38 | 856 | 833 | 165.3 |
| C | 14 | 234 | 52960 | 269.8 | 840 | 842 | 193.2 |
| C | 15 | 208 | 29768 | 149.74 | 840 | 842 | 193.2 |
| C | 13 | 61 | 6122 | 27.33 | 840 | 842 | 193.2 |
| D | 8 | 195 | 202008 | 1002.31 | 831 | 807 | 200.7 |
| D | 1 | 52 | 61549 | 302.59 | 831 | 807 | 200.7 |
| D | 2 | 234 | 27592 | 133.43 | 831 | 807 | 200.7 |
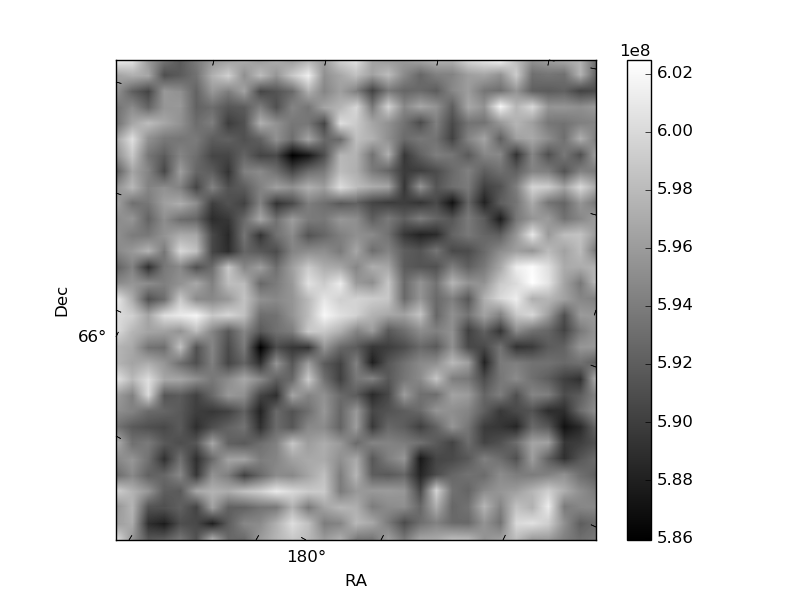
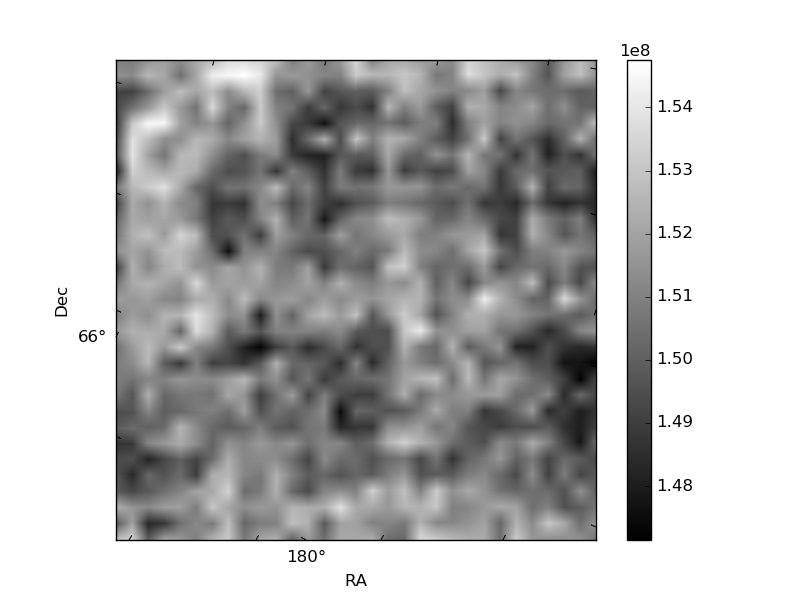
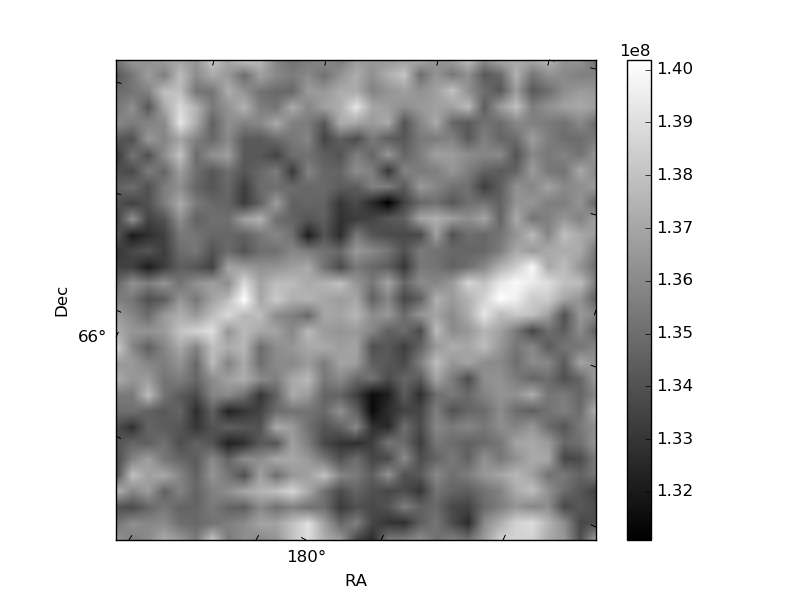
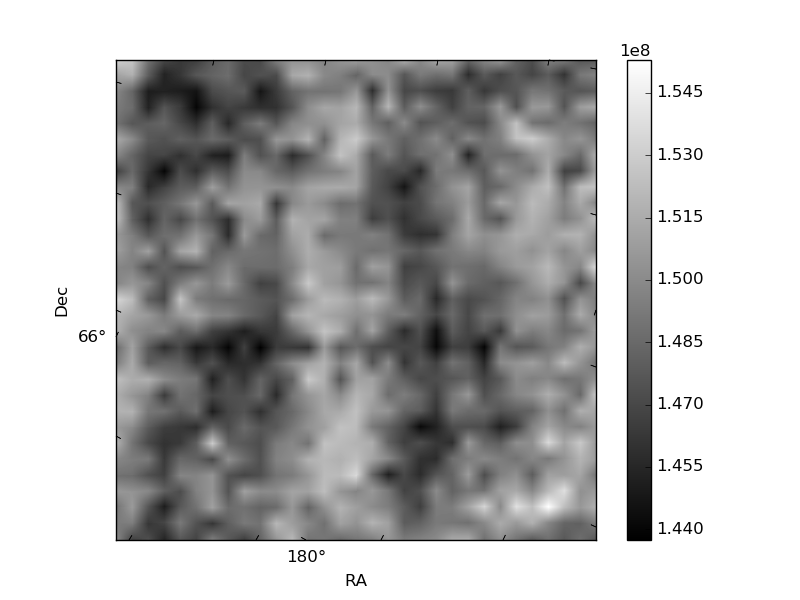
Histogram calculated using DETX and DETY for each event in the final _common_clean file
| Quadrant A | 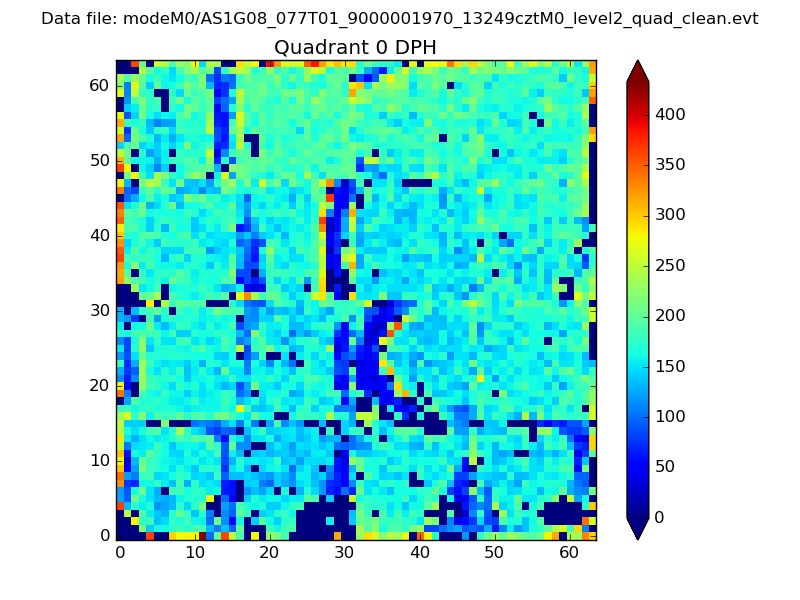 |
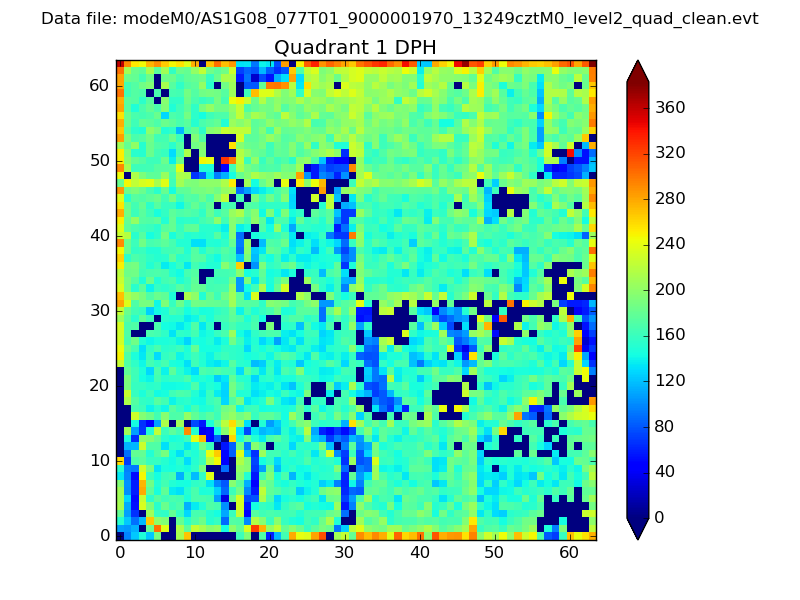 |
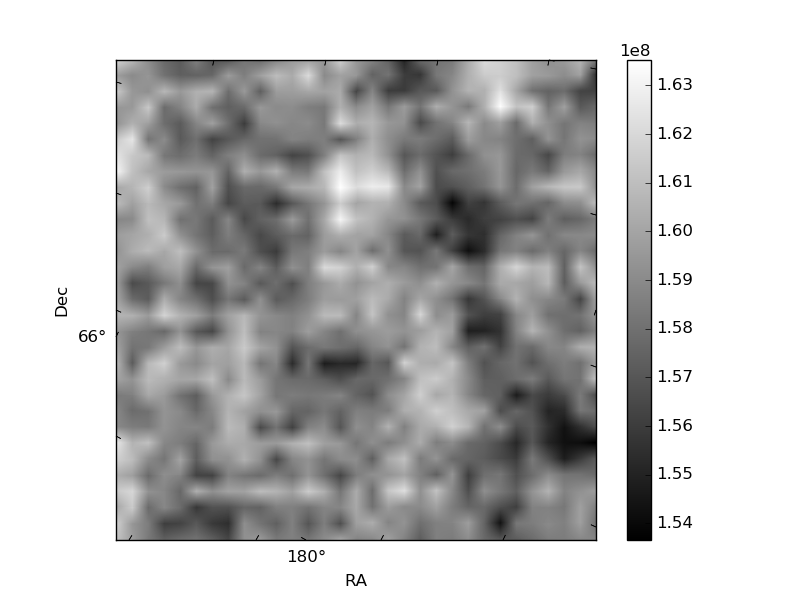
Quadrant B |
|---|---|---|---|
| Quadrant D | 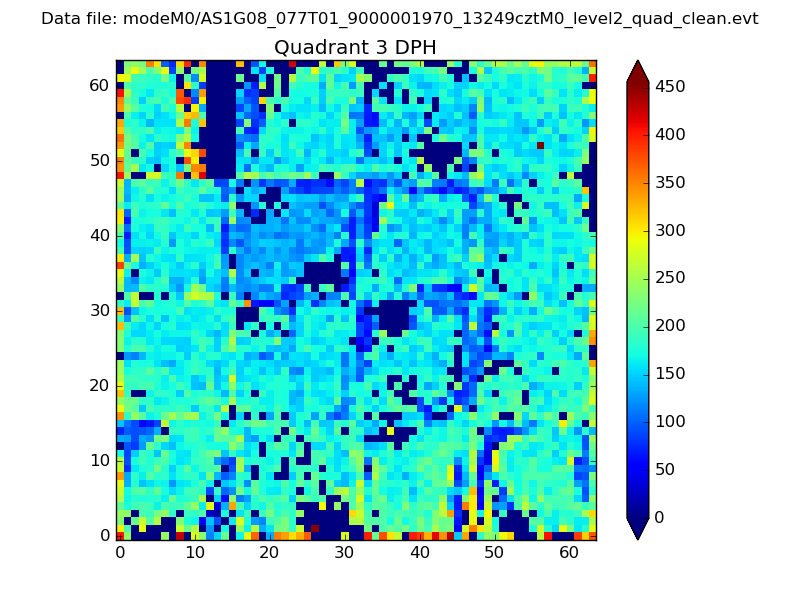 |
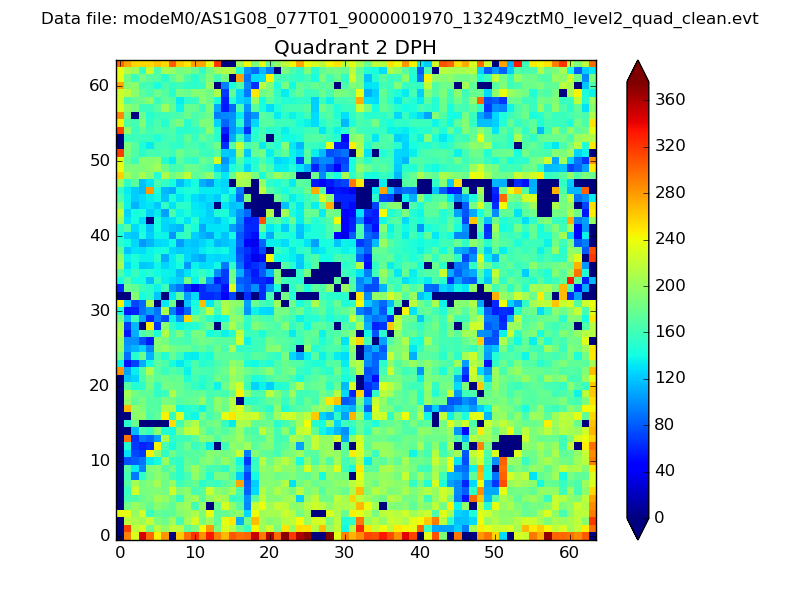 |
Quadrant C |
| Plot type | Count rate plots | Images |
|---|---|---|
| Comparison with Poisson distribution Blue bars denote a histogram of data divided into 1 sec bins. Red curve is a Poisson curve with rate = median count rate of data. |
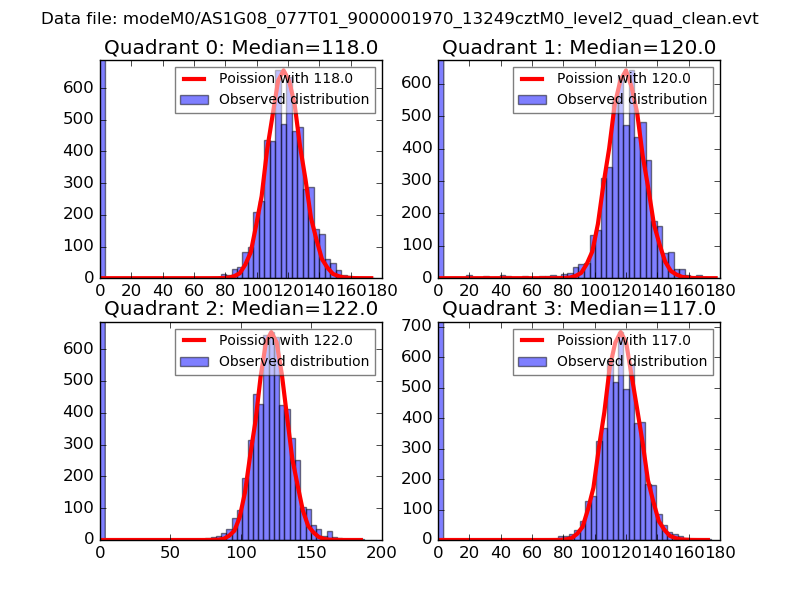 |
 |
| Quadrant-wise count rates Data is divided into 100 sec bins |
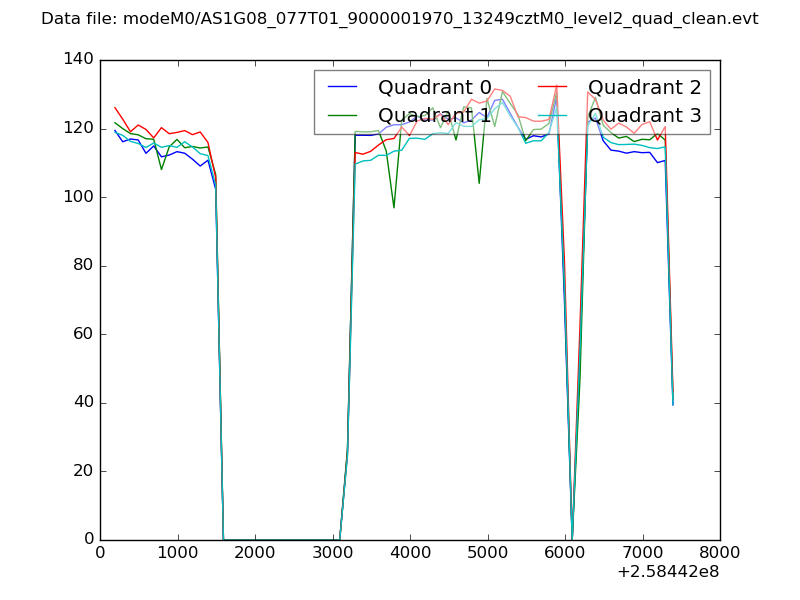 |
|
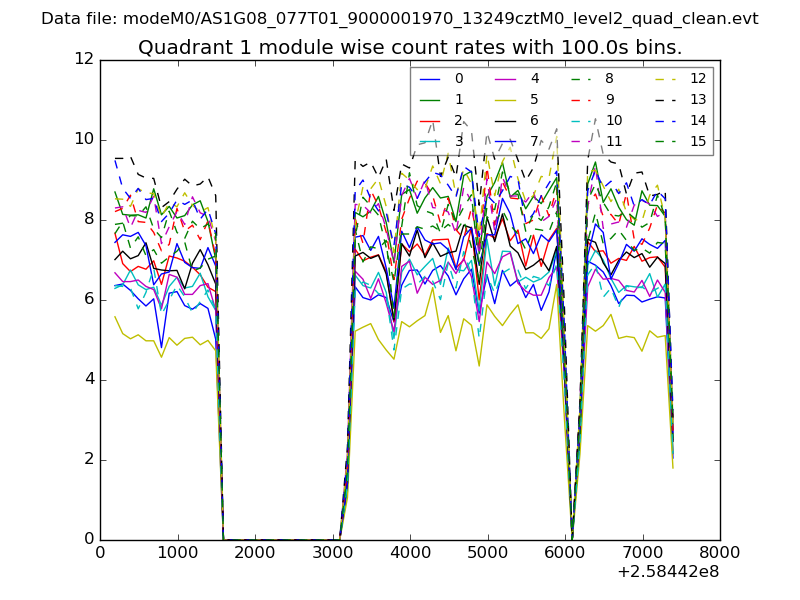
| Module-wise count rates for Quadrant A Data is divided into 100 sec bins |
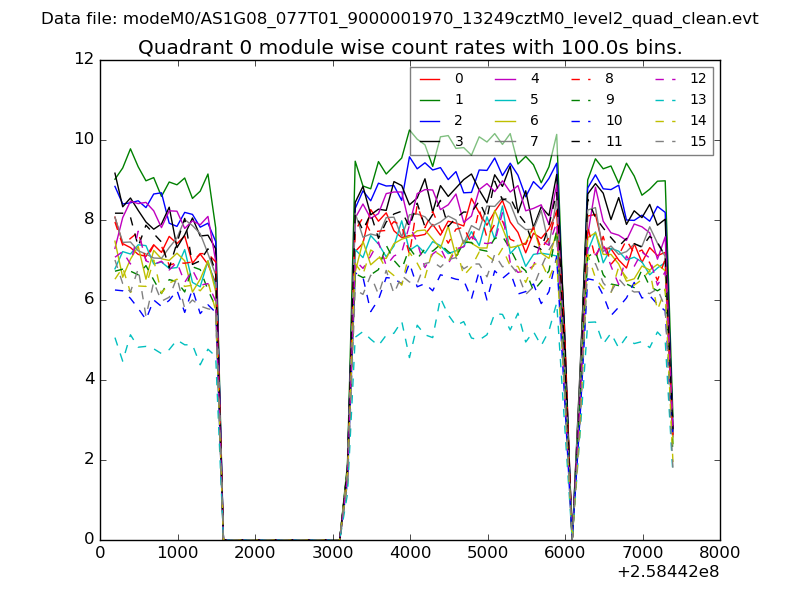 |
 |
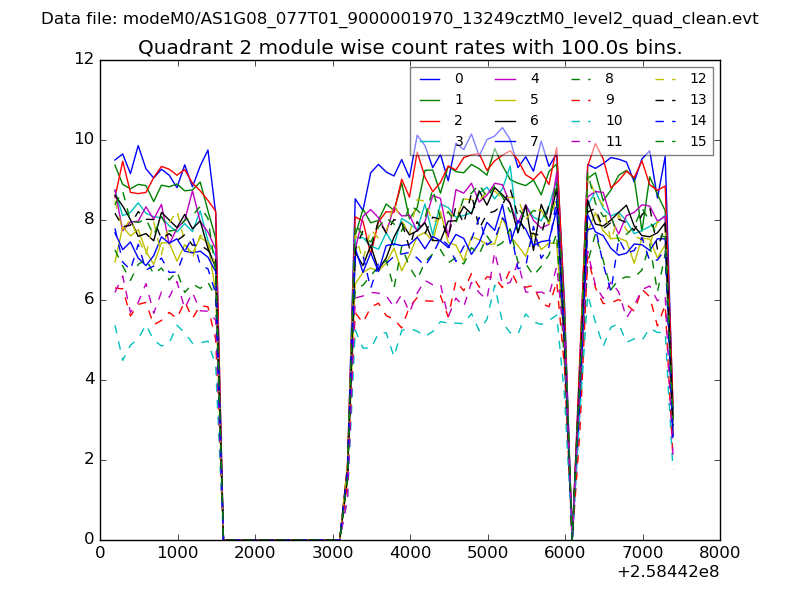
| Module-wise count rates for Quadrant B Data is divided into 100 sec bins |
 |
 |
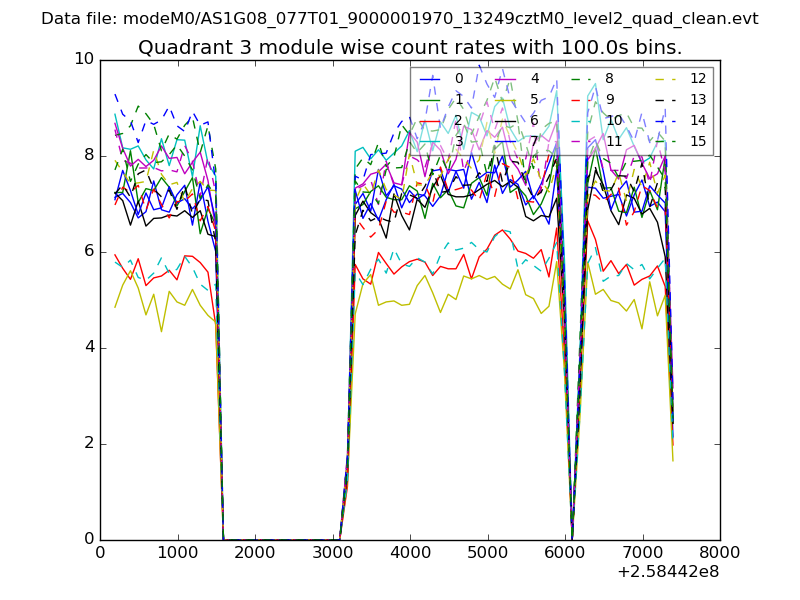
| Module-wise count rates for Quadrant C Data is divided into 100 sec bins |
 |
 |
| Module-wise count rates for Quadrant D Data is divided into 100 sec bins |
 |
 |
| Parameter | Plot |
|---|---|
| CZT HV Monitor | 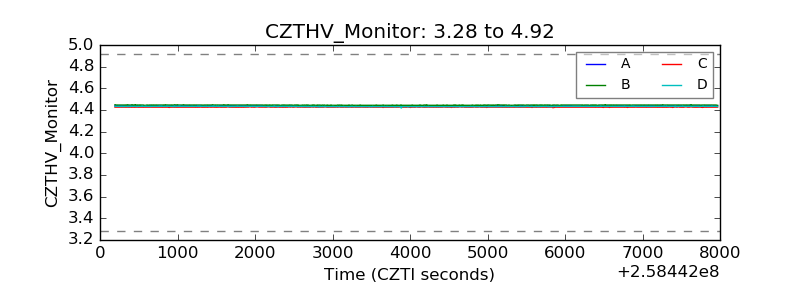 |
| D_VDD | 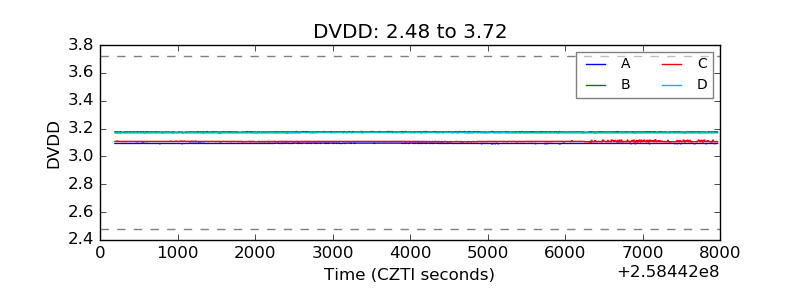 |
| Temperature 1 | 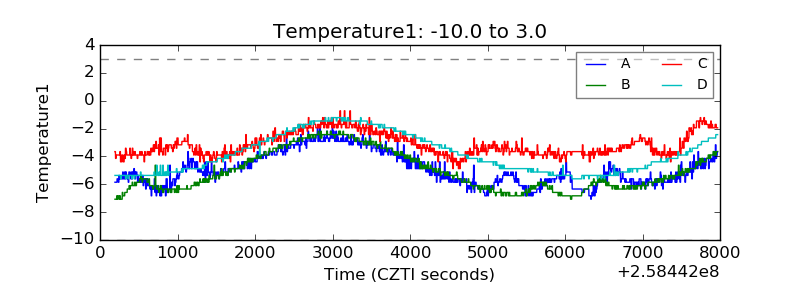 |
| Veto HV Monitor | 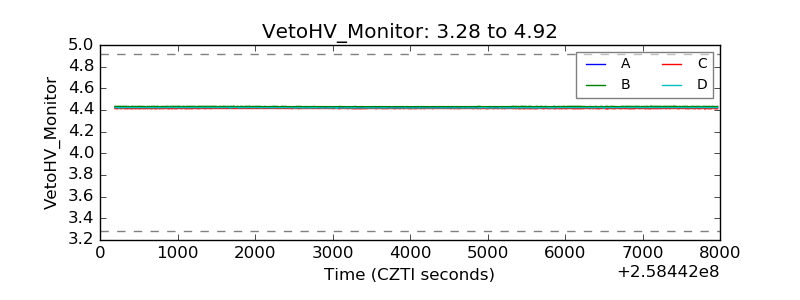 |
| Veto LLD | 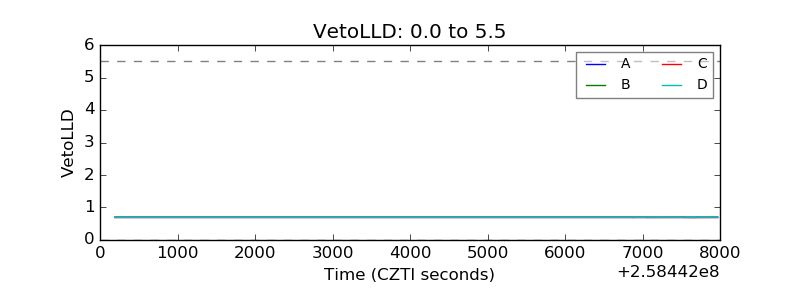 |
| Alpha Counter | 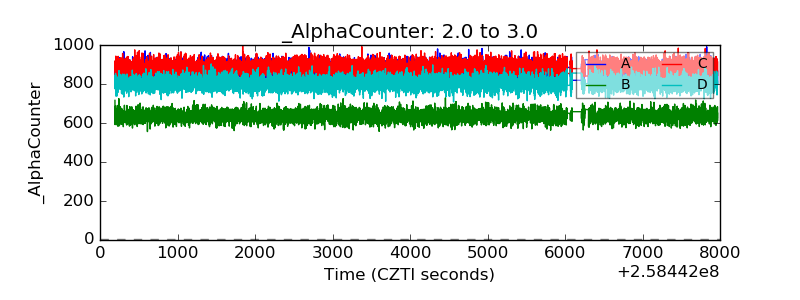 |
| _CPM_Rate | 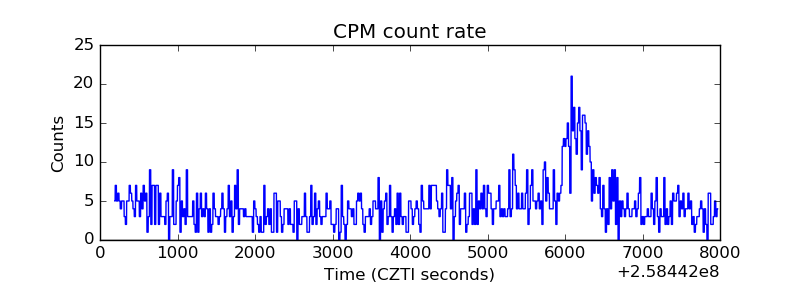 |
| CZT Counter | 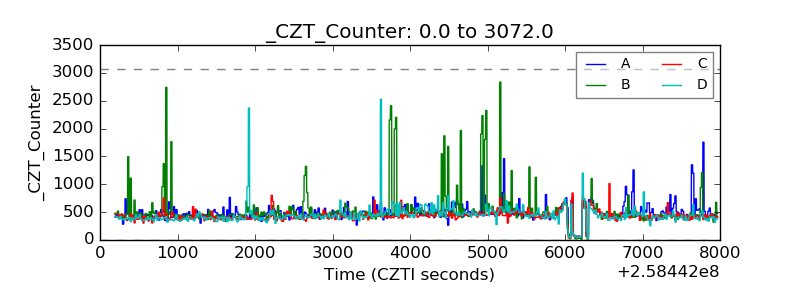 |
| +2.5 Volts monitor | 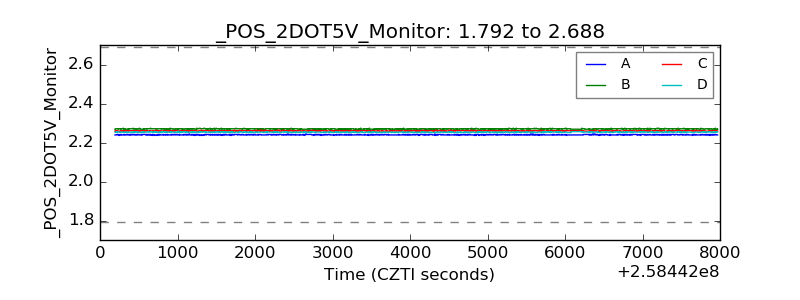 |
| +5 Volts monitor |  |
| _ROLL_ROT | 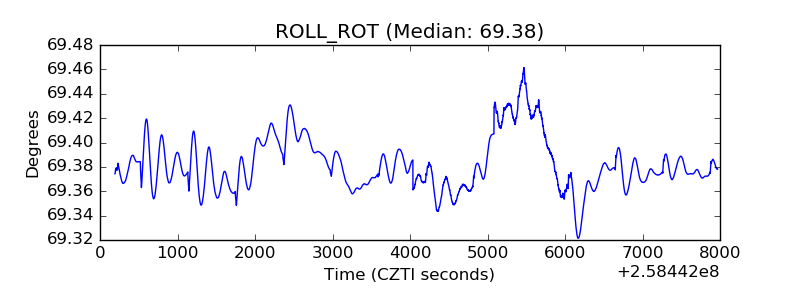 |
| _Roll_DEC | 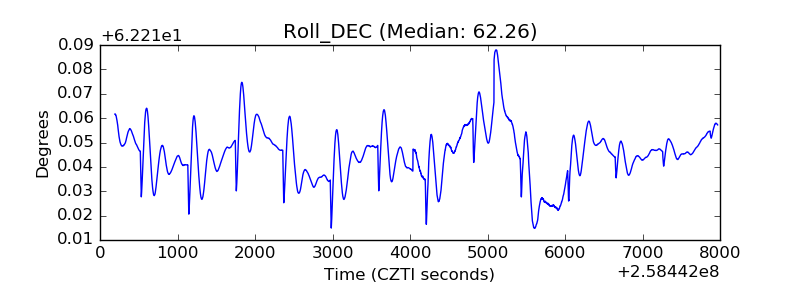 |
| _Roll_RA | 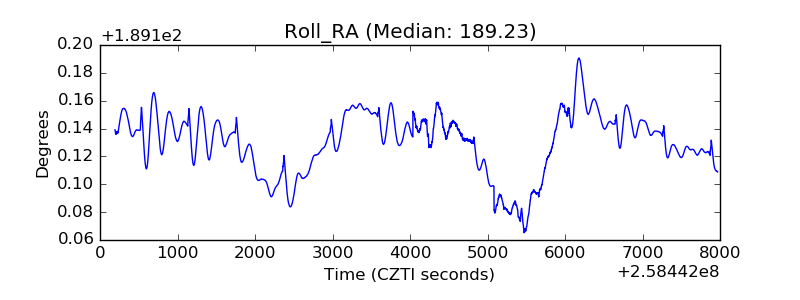 |
| Veto Counter | 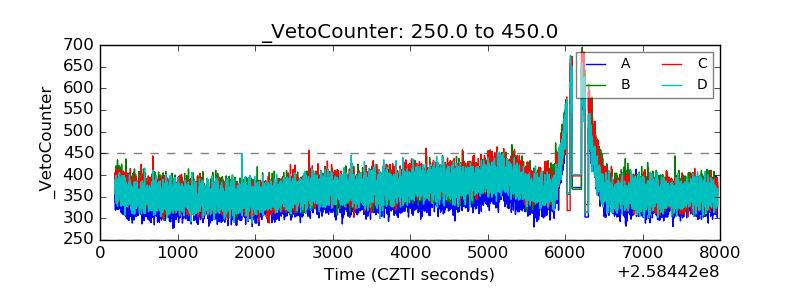 |