| Param | Original file | Final file |
|---|---|---|
| Filename | modeM0/AS1G08_077T01_9000001970_13255cztM0_level2.evt | modeM0/AS1G08_077T01_9000001970_13255cztM0_level2_quad_clean.evt |
| Size (bytes) | 465,932,160 | 96,114,240 |
| Size | 444.3 MB | 91.7 MB |
| Events in quadrant A | 3,161,547 | 615,705 |
| Events in quadrant B | 3,904,046 | 619,537 |
| Events in quadrant C | 3,066,091 | 625,894 |
| Events in quadrant D | 3,542,862 | 601,813 |
| Mode M9 | |||
|---|---|---|---|
| Quadrant | BADHDUFLAG | Total packets | Discarded packets |
| A | 0 | 17 | 0 |
| B | 0 | 17 | 0 |
| C | 0 | 17 | 0 |
| D | 0 | 18 | 0 |
| Mode SS | |||
|---|---|---|---|
| Quadrant | BADHDUFLAG | Total packets | Discarded packets |
| A | 0 | 132 | 0 |
| B | 0 | 132 | 0 |
| C | 0 | 132 | 0 |
| D | 0 | 132 | 0 |
| Mode M0 | |||
|---|---|---|---|
| Quadrant | BADHDUFLAG | Total packets | Discarded packets |
| A | 0 | 13769 | 3 |
| B | 0 | 15929 | 2 |
| C | 0 | 13512 | 2 |
| D | 0 | 14927 | 2 |
| Quadrant | Total seconds | Saturated seconds | Saturation percentage |
|---|---|---|---|
| A | 6415 | 65 | 1.013250% |
| B | 6415 | 230 | 3.585347% |
| C | 6415 | 48 | 0.748246% |
| D | 6415 | 77 | 1.200312% |
Noise dominated data is calculated using 1-second bins in cleaned event files. If a bin has >2000 counts, and if more than 50% of those come from <1% of pixels, then it is considered to be noise-dominated and hence unusable.
| Quadrant | # 1 sec bins | Bins with >0 counts | Bins with >2000 counts | High rate bins dominated by noise | Noise dominated (total time) | Noise dominated (detector-on time) | Marked lightcurve |
|---|---|---|---|---|---|---|---|
| A | 7536 | 6417 | 2 | 2 | 0.03% | 0.03% | 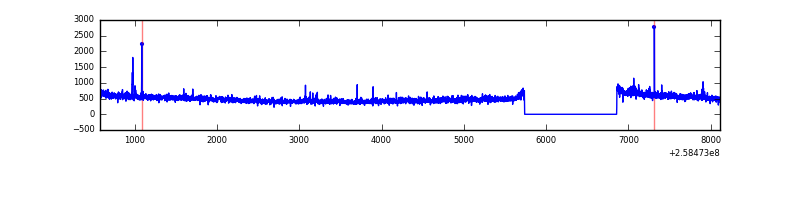 |
| B | 7536 | 6417 | 132 | 132 | 1.75% | 2.06% | 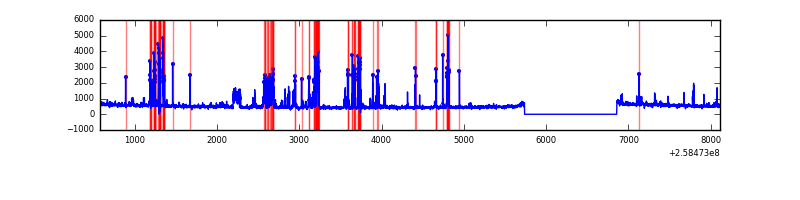 |
| C | 7536 | 6417 | 1 | 1 | 0.01% | 0.02% | 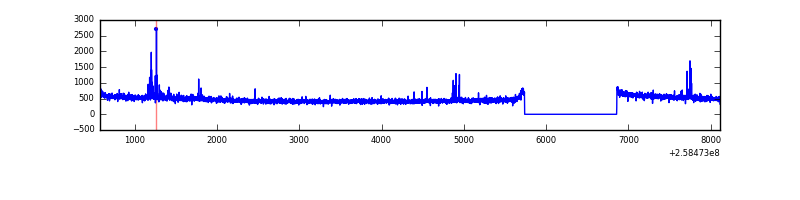 |
| D | 7536 | 6417 | 14 | 14 | 0.19% | 0.22% | 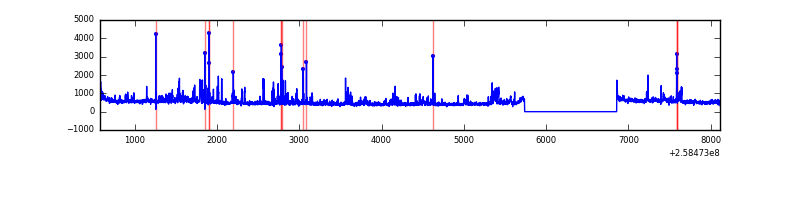 |
Top three noisy pixels from each quadrant. If the there are fewer than three noisy pixels in the level2.evt file, extra rows are filled as -1
| Pixel properties | Quadrant properties | ||||||
|---|---|---|---|---|---|---|---|
| Quadrant | DetID | PixID | Counts | Sigma | Mean | Median | Sigma |
| A | 15 | 239 | 58397 | 361.28 | 785 | 769 | 159.5 |
| A | 1 | 162 | 32920 | 201.56 | 785 | 769 | 159.5 |
| A | 1 | 178 | 13161 | 77.69 | 785 | 769 | 159.5 |
| B | 4 | 239 | 708916 | 4848.68 | 777 | 758 | 146.1 |
| B | 3 | 64 | 95757 | 650.45 | 777 | 758 | 146.1 |
| B | 0 | 230 | 27258 | 181.44 | 777 | 758 | 146.1 |
| C | 15 | 208 | 45157 | 250.3 | 774 | 778 | 177.3 |
| C | 13 | 61 | 5506 | 26.67 | 774 | 778 | 177.3 |
| C | 14 | 234 | 2973 | 12.38 | 774 | 778 | 177.3 |
| D | 1 | 52 | 486369 | 2639.94 | 768 | 746 | 184.0 |
| D | 5 | 222 | 76295 | 410.7 | 768 | 746 | 184.0 |
| D | 8 | 195 | 33946 | 180.48 | 768 | 746 | 184.0 |
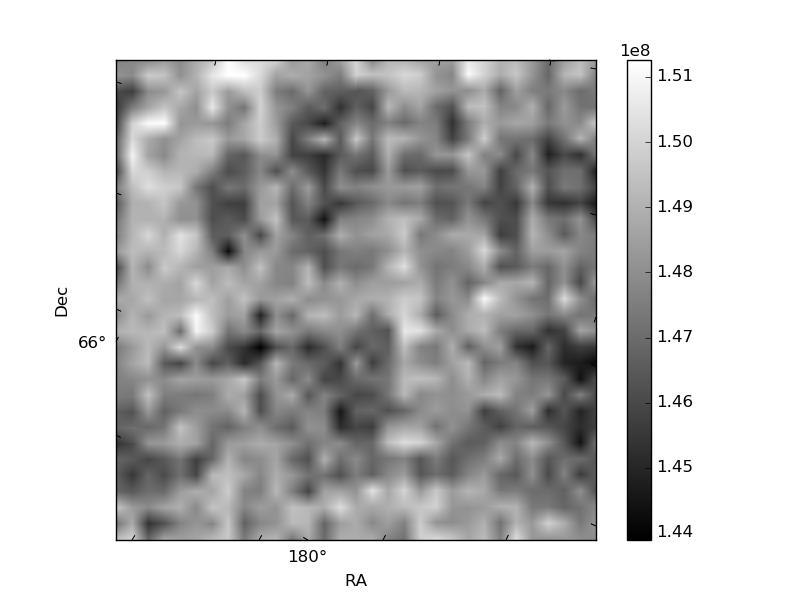
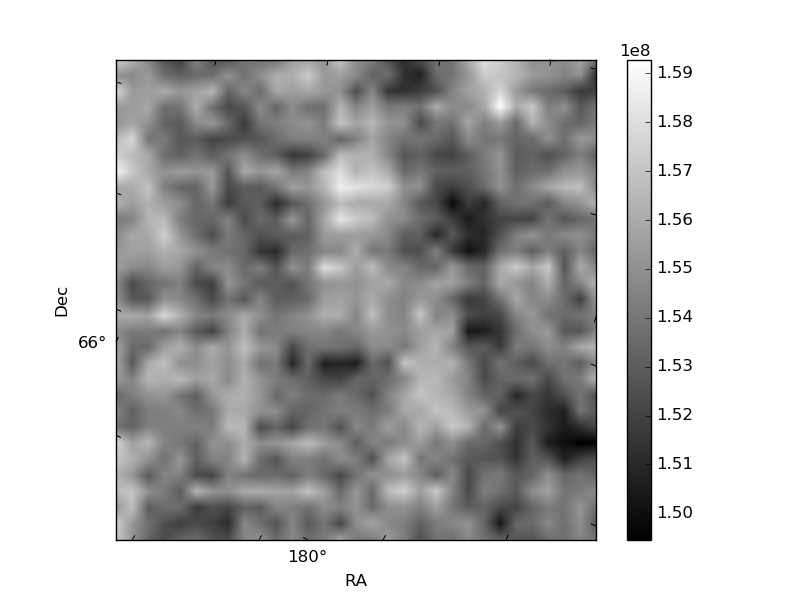
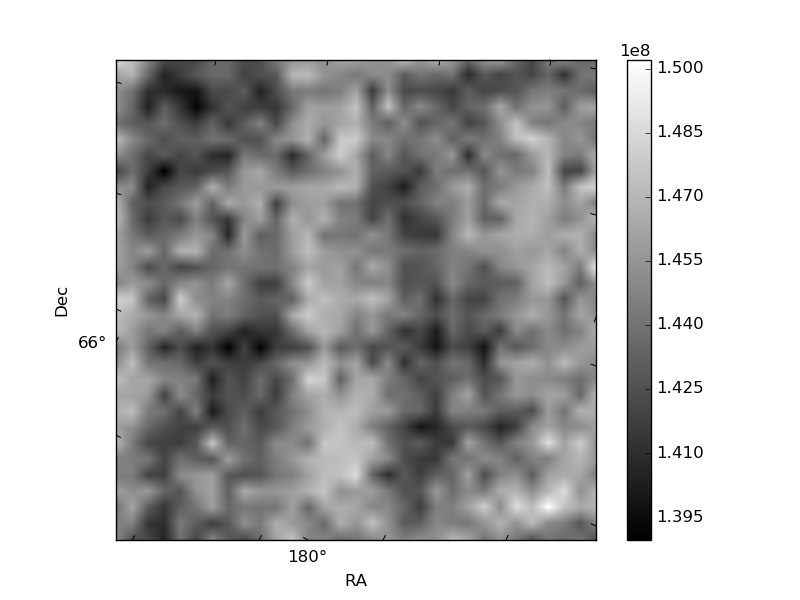
Histogram calculated using DETX and DETY for each event in the final _common_clean file
| Quadrant A | 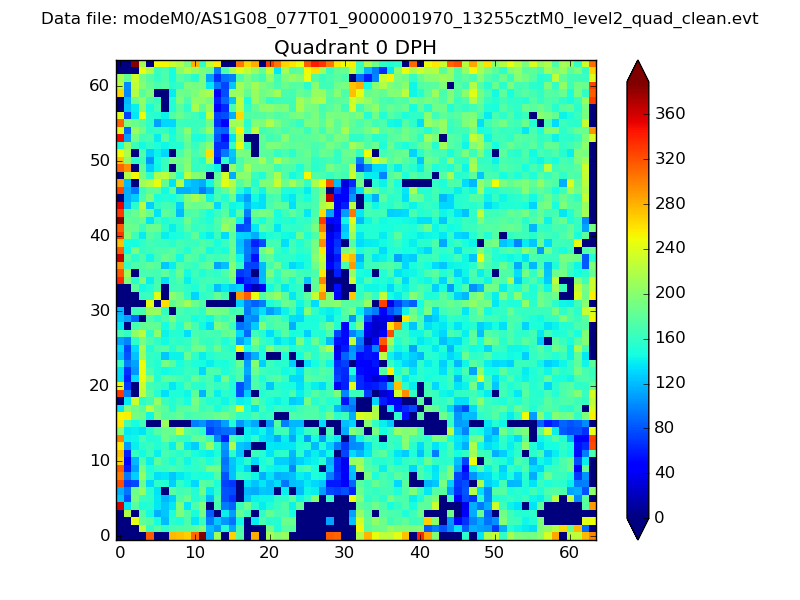 |
 |
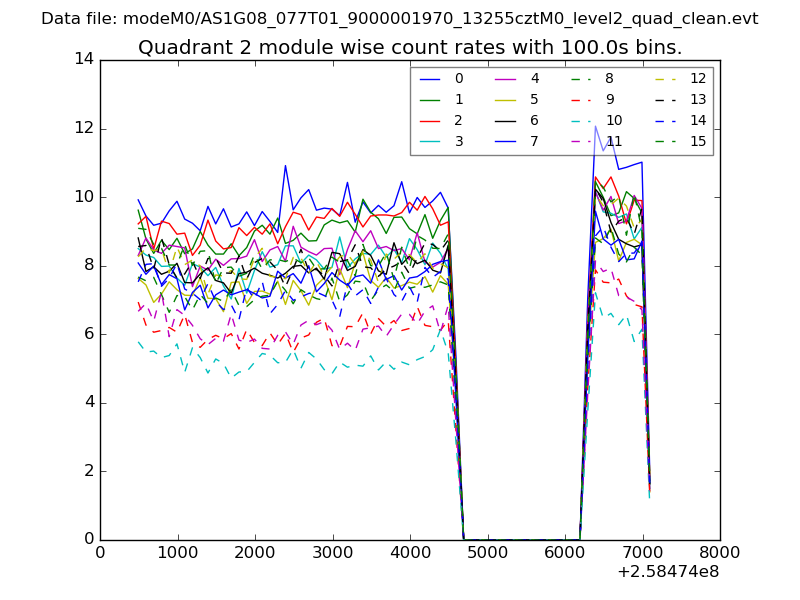
Quadrant B |
|---|---|---|---|
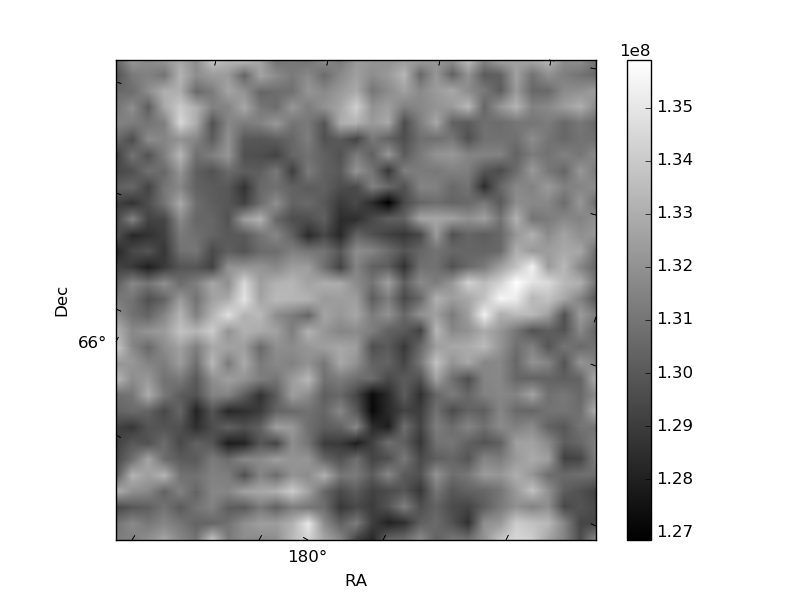
| Quadrant D | 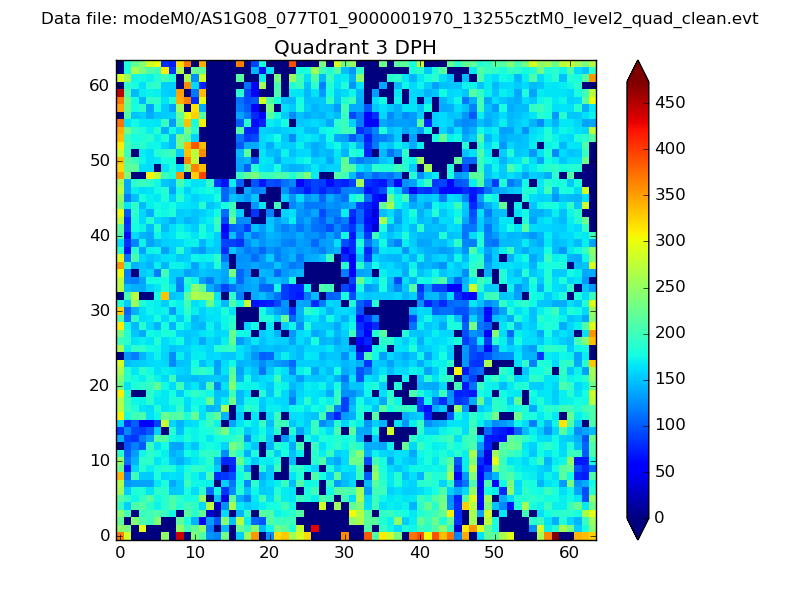 |
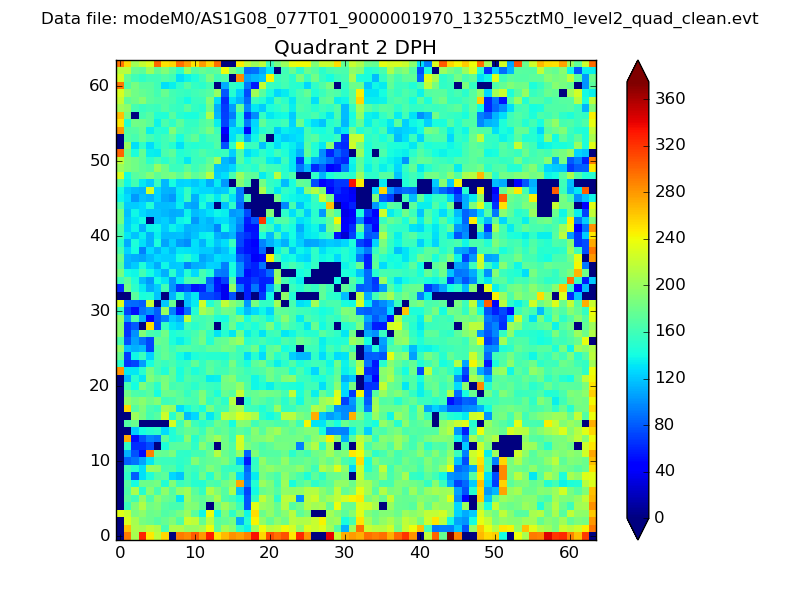 |
Quadrant C |
| Plot type | Count rate plots | Images |
|---|---|---|
| Comparison with Poisson distribution Blue bars denote a histogram of data divided into 1 sec bins. Red curve is a Poisson curve with rate = median count rate of data. |
 |
 |
| Quadrant-wise count rates Data is divided into 100 sec bins |
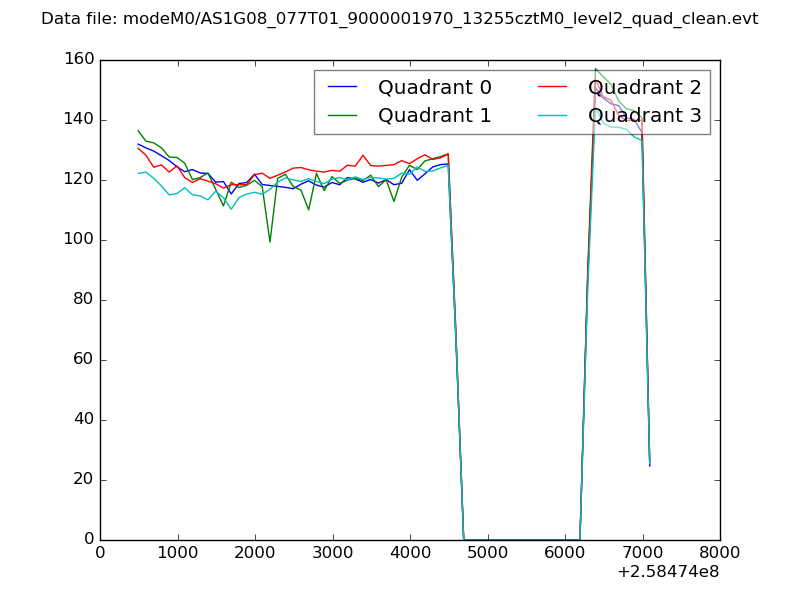 |
|
| Module-wise count rates for Quadrant A Data is divided into 100 sec bins |
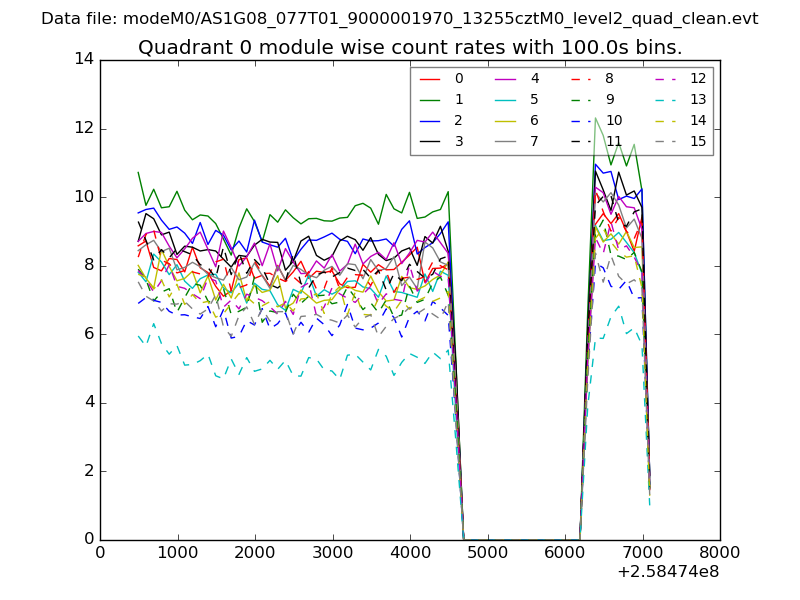 |
 |
| Module-wise count rates for Quadrant B Data is divided into 100 sec bins |
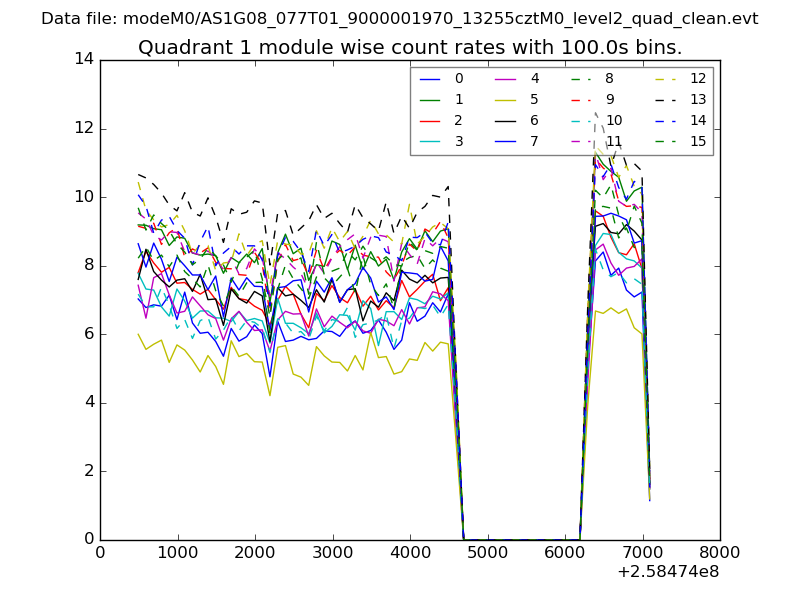 |
 |
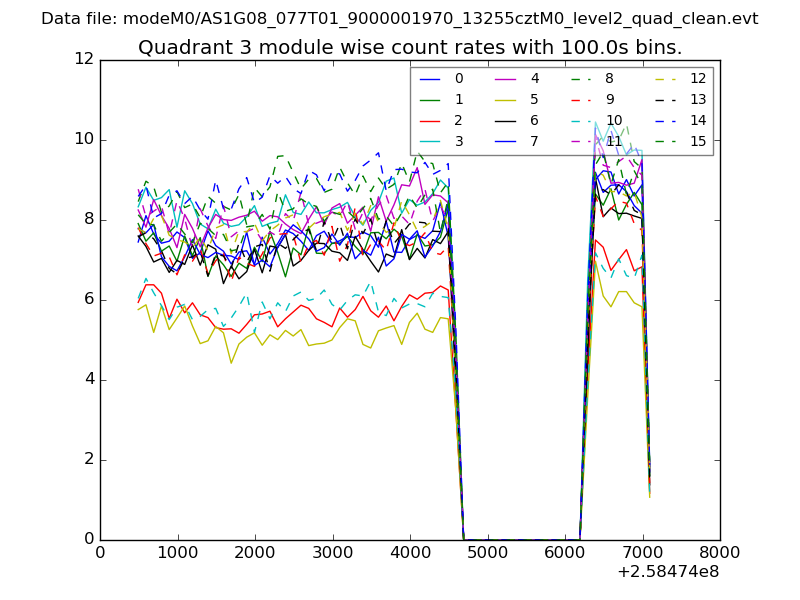
| Module-wise count rates for Quadrant C Data is divided into 100 sec bins |
 |
 |
| Module-wise count rates for Quadrant D Data is divided into 100 sec bins |
 |
 |
| Parameter | Plot |
|---|---|
| CZT HV Monitor | 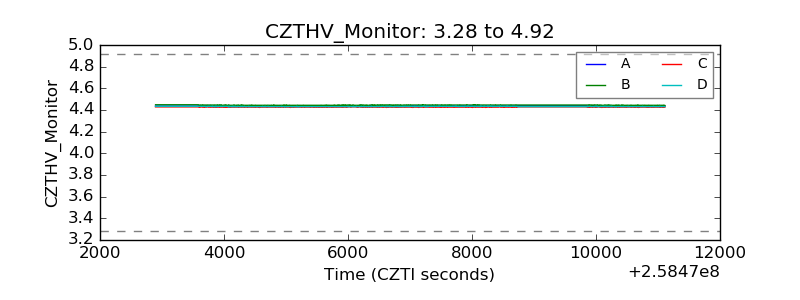 |
| D_VDD | 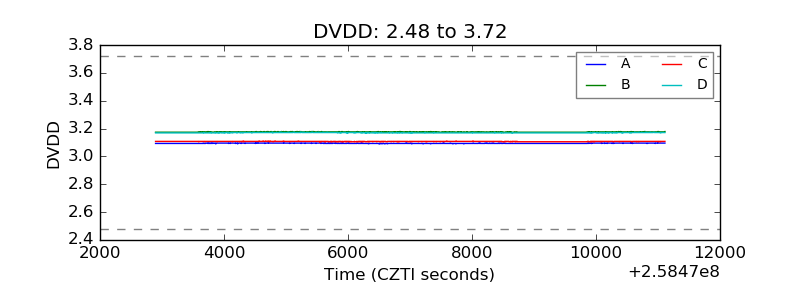 |
| Temperature 1 | 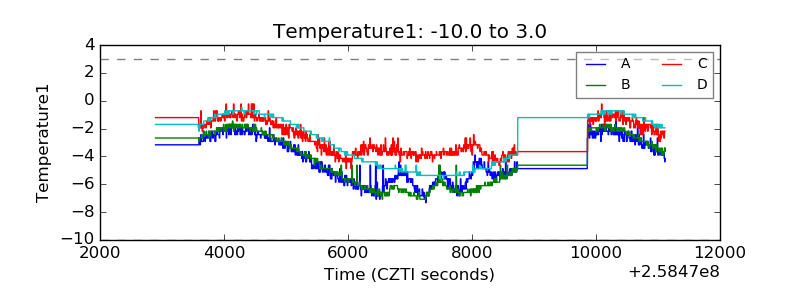 |
| Veto HV Monitor | 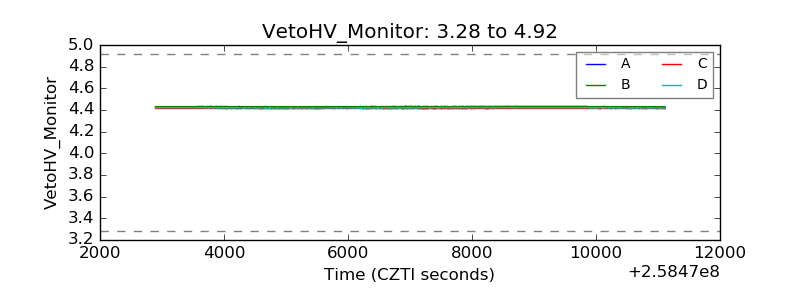 |
| Veto LLD | 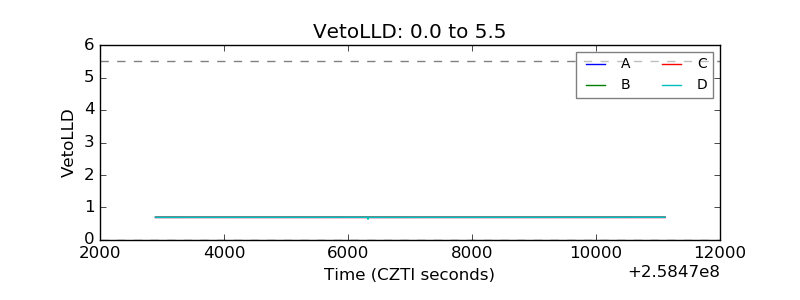 |
| Alpha Counter | 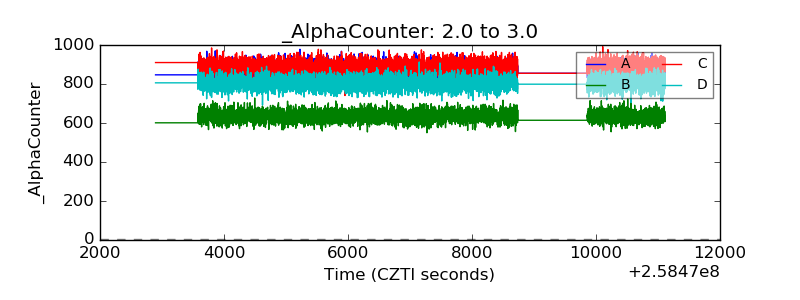 |
| _CPM_Rate | 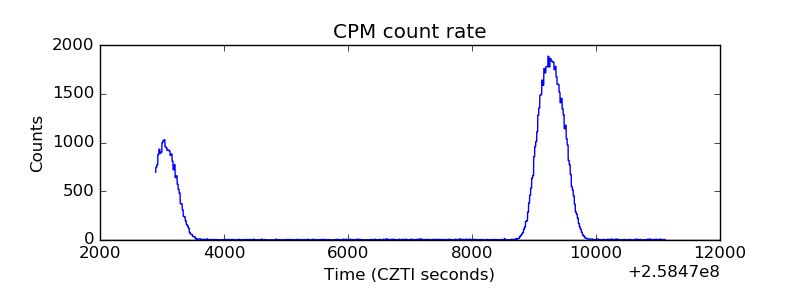 |
| CZT Counter | 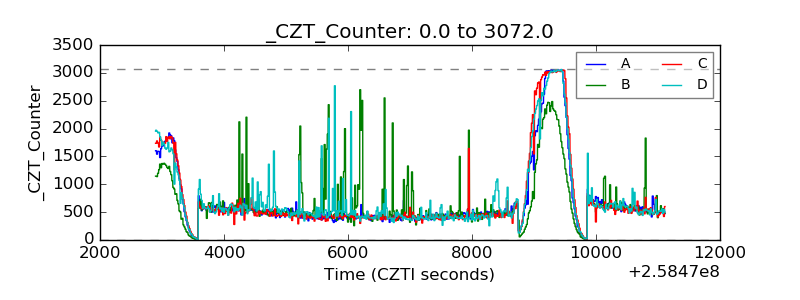 |
| +2.5 Volts monitor |  |
| +5 Volts monitor |  |
| _ROLL_ROT |  |
| _Roll_DEC | 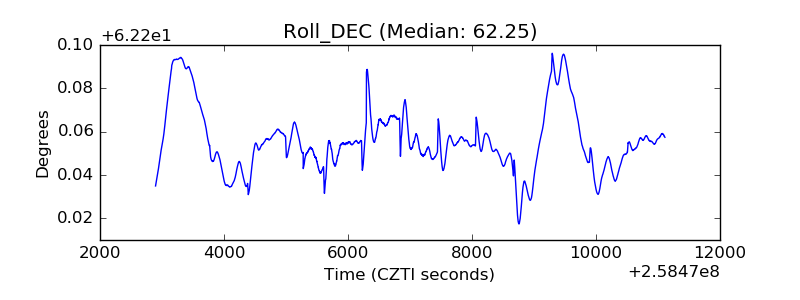 |
| _Roll_RA | 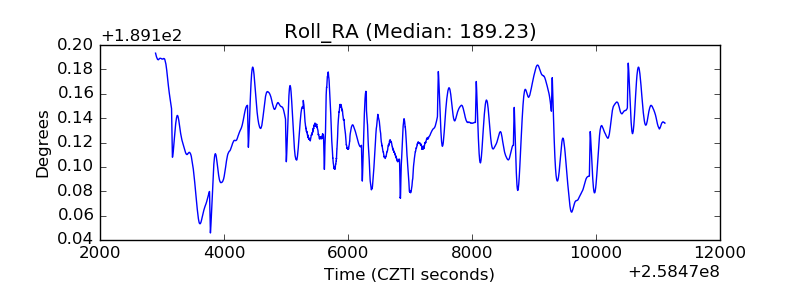 |
| Veto Counter | 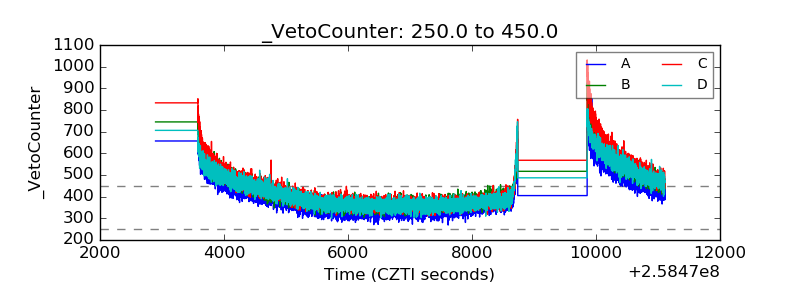 |