| Param | Original file | Final file |
|---|---|---|
| Filename | modeM0/AS1G08_077T01_9000001970_13258cztM0_level2.evt | modeM0/AS1G08_077T01_9000001970_13258cztM0_level2_quad_clean.evt |
| Size (bytes) | 484,470,720 | 107,827,200 |
| Size | 462.0 MB | 102.8 MB |
| Events in quadrant A | 3,092,215 | 717,410 |
| Events in quadrant B | 5,041,214 | 660,952 |
| Events in quadrant C | 3,079,895 | 754,878 |
| Events in quadrant D | 3,047,311 | 709,011 |
| Mode M9 | |||
|---|---|---|---|
| Quadrant | BADHDUFLAG | Total packets | Discarded packets |
| A | 0 | 14 | 0 |
| B | 0 | 14 | 0 |
| C | 0 | 14 | 0 |
| D | 0 | 15 | 0 |
| Mode SS | |||
|---|---|---|---|
| Quadrant | BADHDUFLAG | Total packets | Discarded packets |
| A | 0 | 122 | 0 |
| B | 0 | 122 | 0 |
| C | 0 | 122 | 0 |
| D | 0 | 122 | 0 |
| Mode M0 | |||
|---|---|---|---|
| Quadrant | BADHDUFLAG | Total packets | Discarded packets |
| A | 0 | 13220 | 3 |
| B | 0 | 19047 | 2 |
| C | 0 | 13130 | 2 |
| D | 0 | 13140 | 2 |
| Quadrant | Total seconds | Saturated seconds | Saturation percentage |
|---|---|---|---|
| A | 6063 | 62 | 1.022596% |
| B | 6063 | 917 | 15.124526% |
| C | 6063 | 53 | 0.874155% |
| D | 6063 | 48 | 0.791687% |
Noise dominated data is calculated using 1-second bins in cleaned event files. If a bin has >2000 counts, and if more than 50% of those come from <1% of pixels, then it is considered to be noise-dominated and hence unusable.
| Quadrant | # 1 sec bins | Bins with >0 counts | Bins with >2000 counts | High rate bins dominated by noise | Noise dominated (total time) | Noise dominated (detector-on time) | Marked lightcurve |
|---|---|---|---|---|---|---|---|
| A | 7419 | 6065 | 2 | 2 | 0.03% | 0.03% | 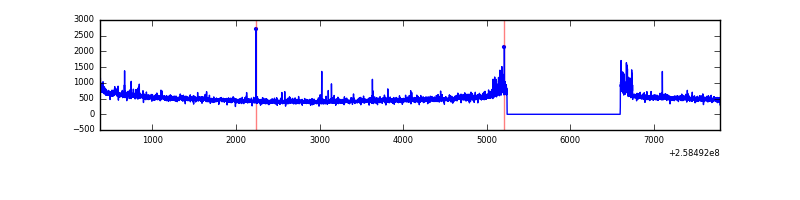 |
| B | 7419 | 6064 | 591 | 591 | 7.97% | 9.75% | 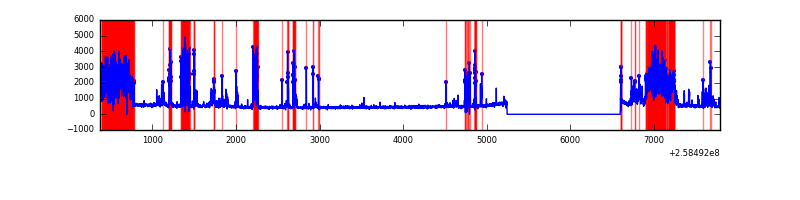 |
| C | 7419 | 6065 | 8 | 8 | 0.11% | 0.13% | 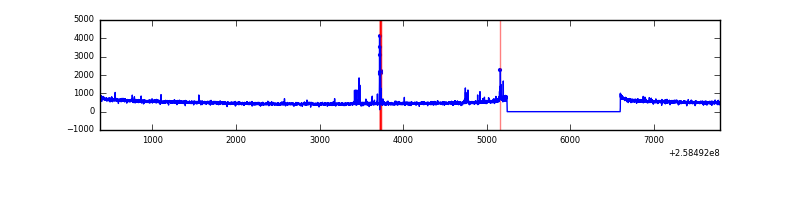 |
| D | 7419 | 6065 | 10 | 10 | 0.13% | 0.16% | 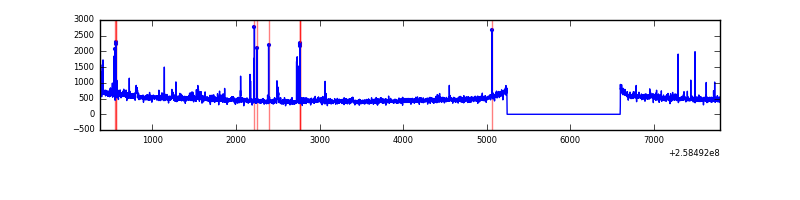 |
Top three noisy pixels from each quadrant. If the there are fewer than three noisy pixels in the level2.evt file, extra rows are filled as -1
| Pixel properties | Quadrant properties | ||||||
|---|---|---|---|---|---|---|---|
| Quadrant | DetID | PixID | Counts | Sigma | Mean | Median | Sigma |
| A | 15 | 239 | 127037 | 836.85 | 759 | 745 | 150.9 |
| A | 1 | 162 | 23144 | 148.42 | 759 | 745 | 150.9 |
| A | 1 | 178 | 7792 | 46.7 | 759 | 745 | 150.9 |
| B | 4 | 239 | 2221356 | 17075.94 | 705 | 688 | 130.0 |
| B | 3 | 64 | 19589 | 145.34 | 705 | 688 | 130.0 |
| B | 0 | 214 | 16403 | 120.84 | 705 | 688 | 130.0 |
| C | 15 | 208 | 74484 | 422.62 | 768 | 772 | 174.4 |
| C | 3 | 233 | 8354 | 43.47 | 768 | 772 | 174.4 |
| C | 13 | 61 | 5611 | 27.74 | 768 | 772 | 174.4 |
| D | 1 | 52 | 101541 | 564.28 | 752 | 731 | 178.7 |
| D | 8 | 195 | 65275 | 361.28 | 752 | 731 | 178.7 |
| D | 2 | 234 | 22275 | 120.59 | 752 | 731 | 178.7 |
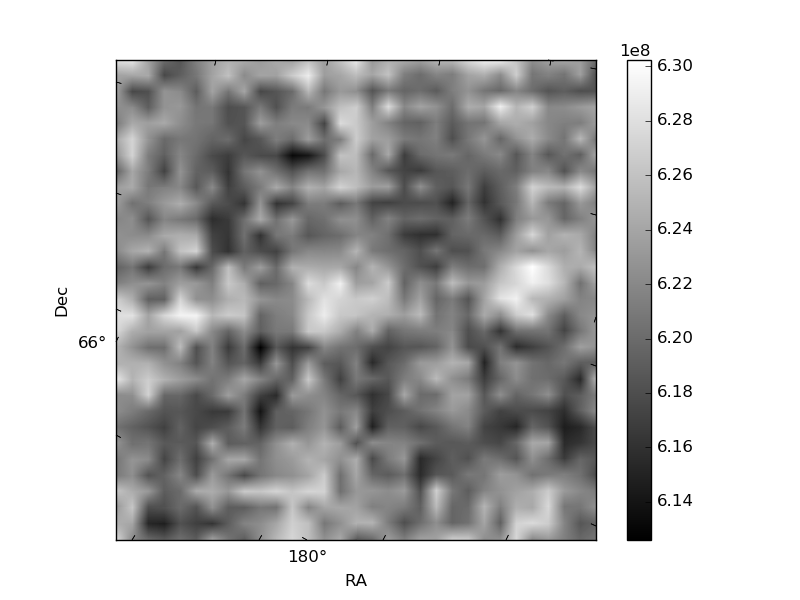
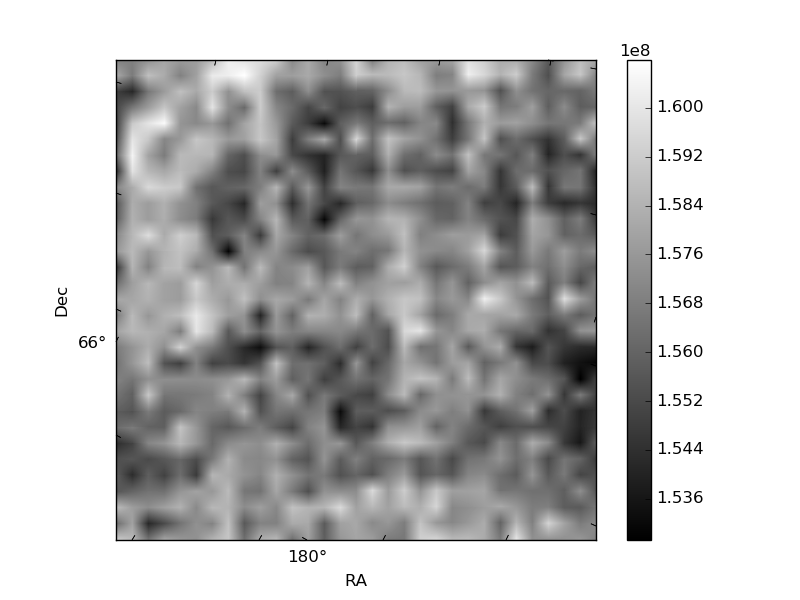
Histogram calculated using DETX and DETY for each event in the final _common_clean file
| Quadrant A | 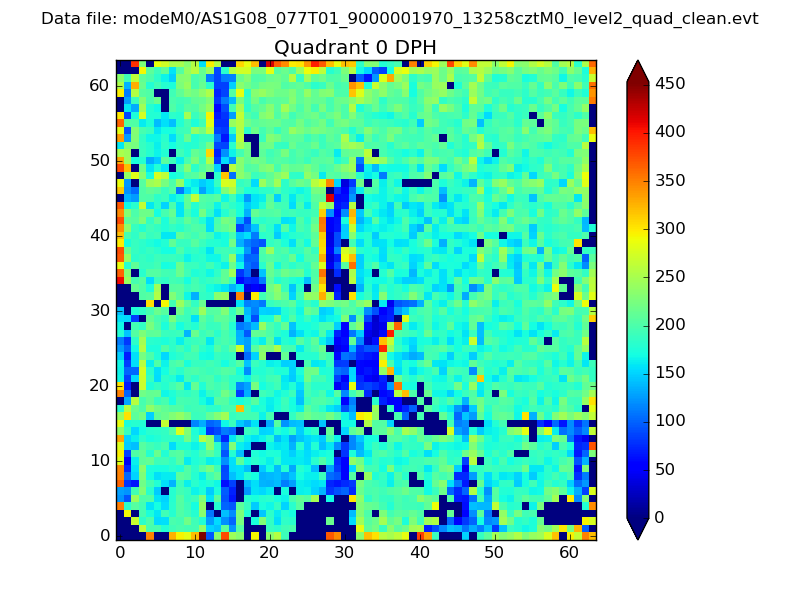 |
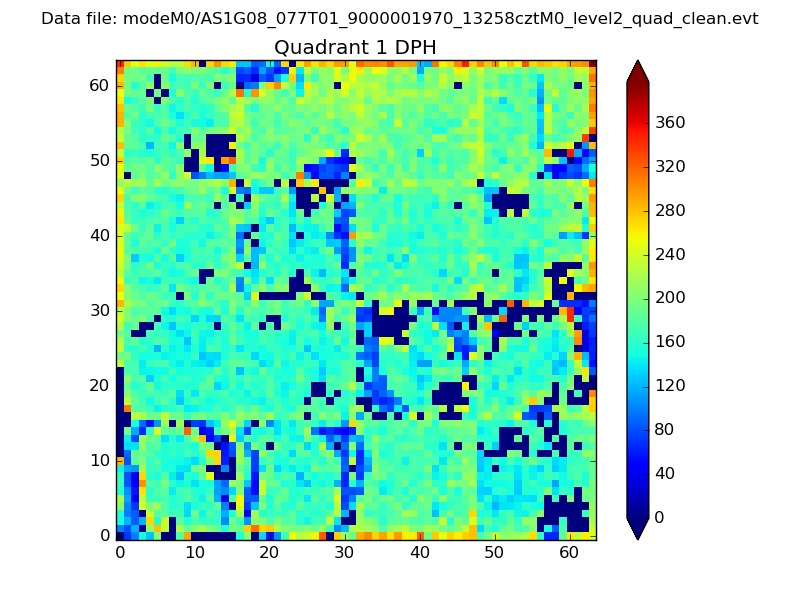 |
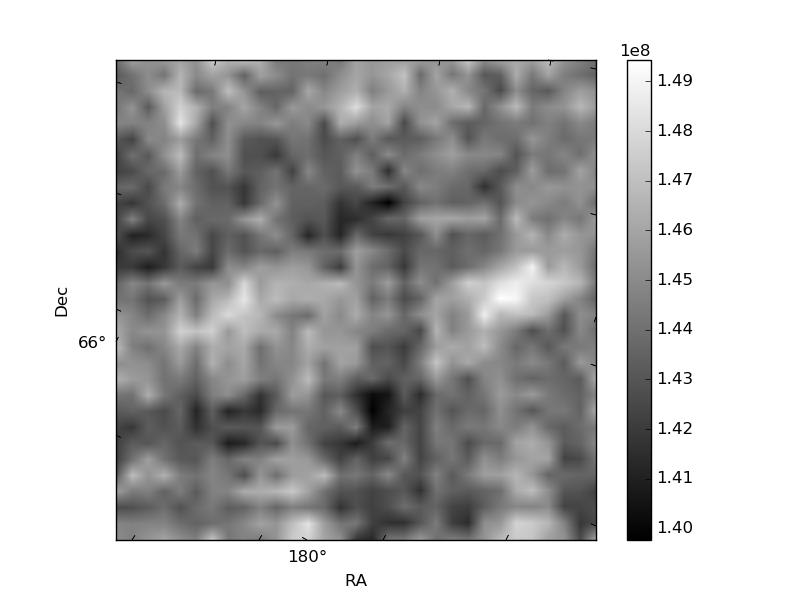
Quadrant B |
|---|---|---|---|
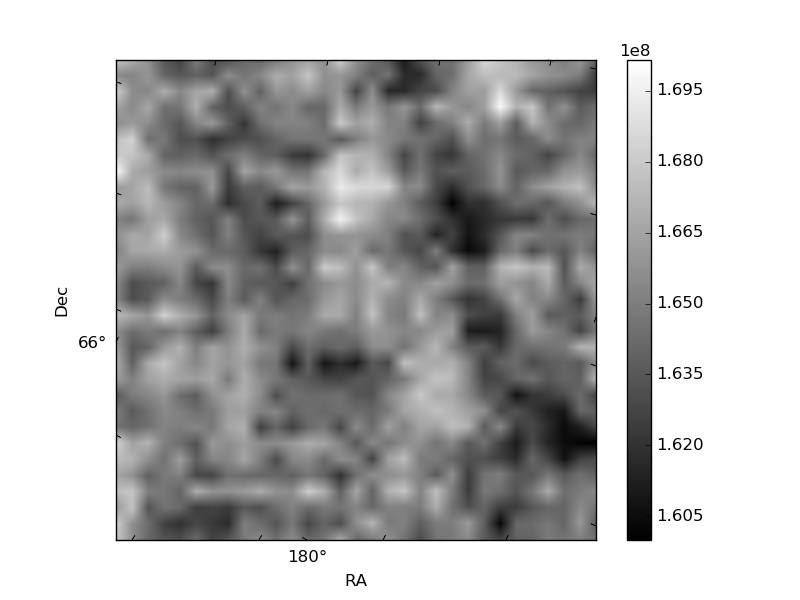
| Quadrant D | 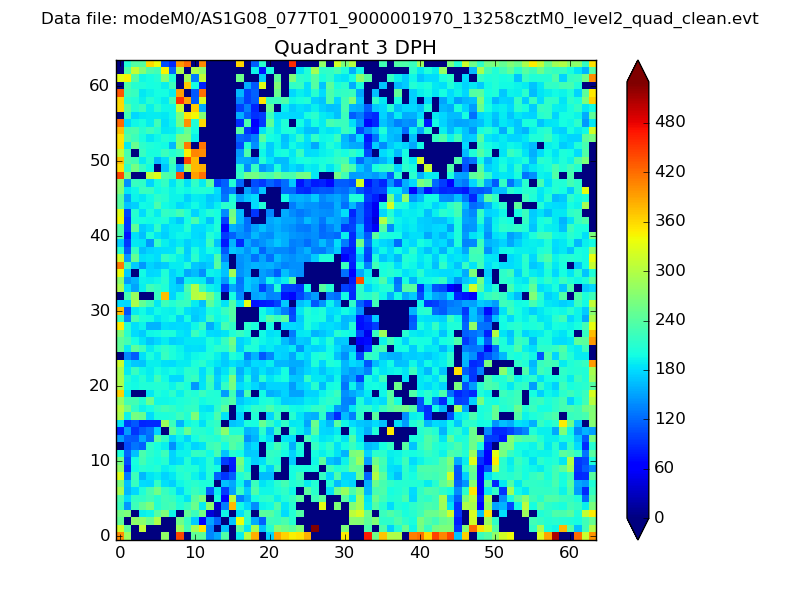 |
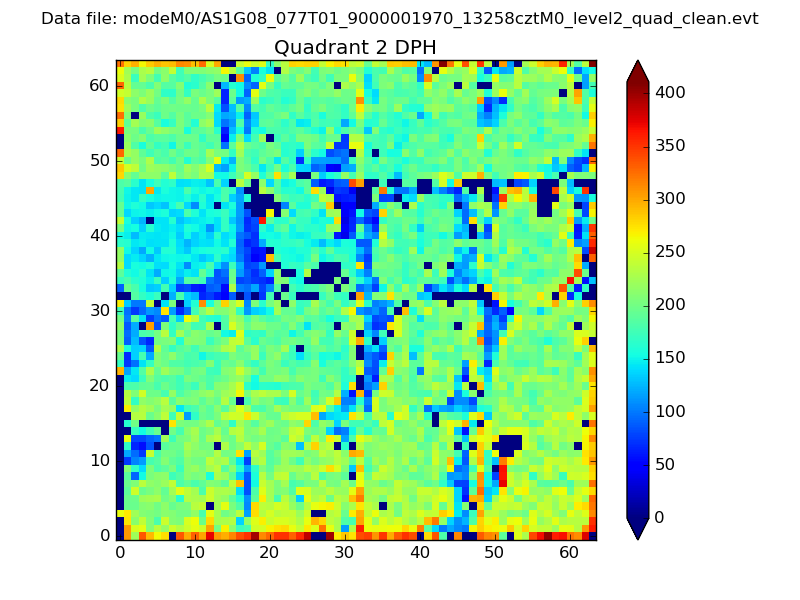 |
Quadrant C |
| Plot type | Count rate plots | Images |
|---|---|---|
| Comparison with Poisson distribution Blue bars denote a histogram of data divided into 1 sec bins. Red curve is a Poisson curve with rate = median count rate of data. |
 |
 |
| Quadrant-wise count rates Data is divided into 100 sec bins |
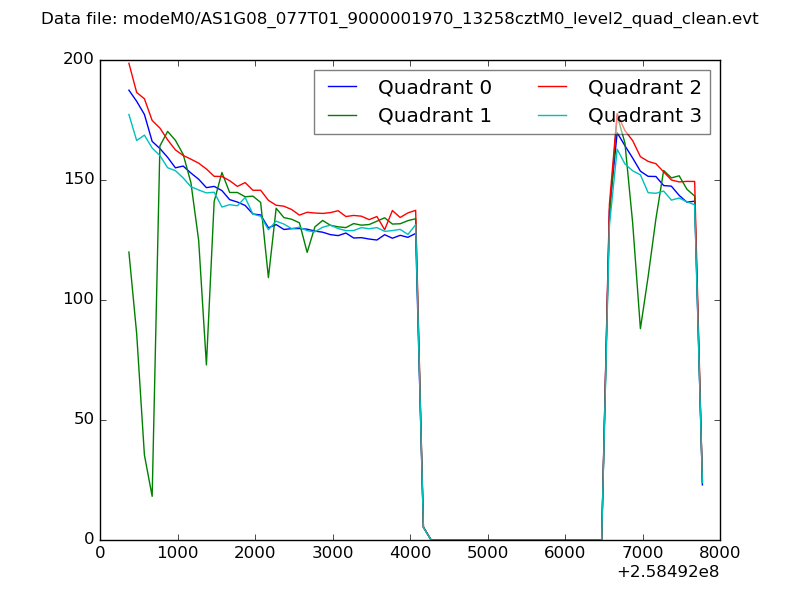 |
|
| Module-wise count rates for Quadrant A Data is divided into 100 sec bins |
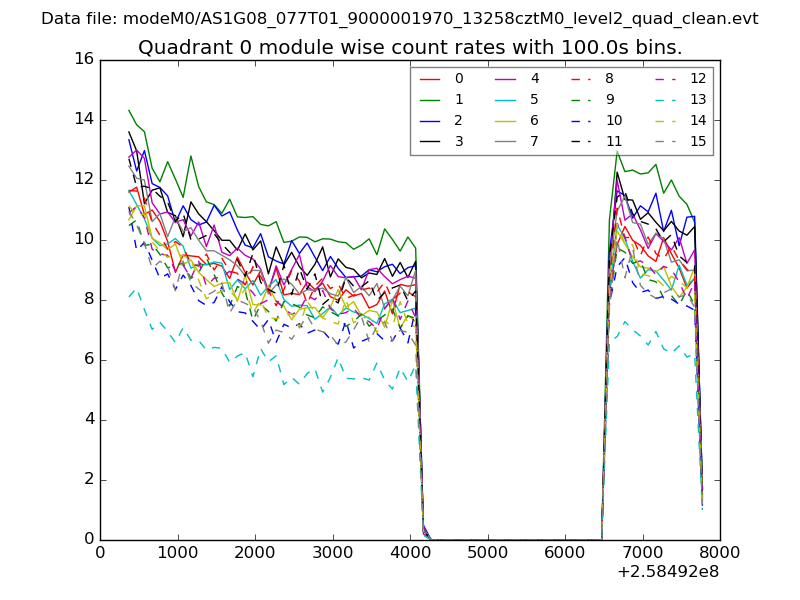 |
 |
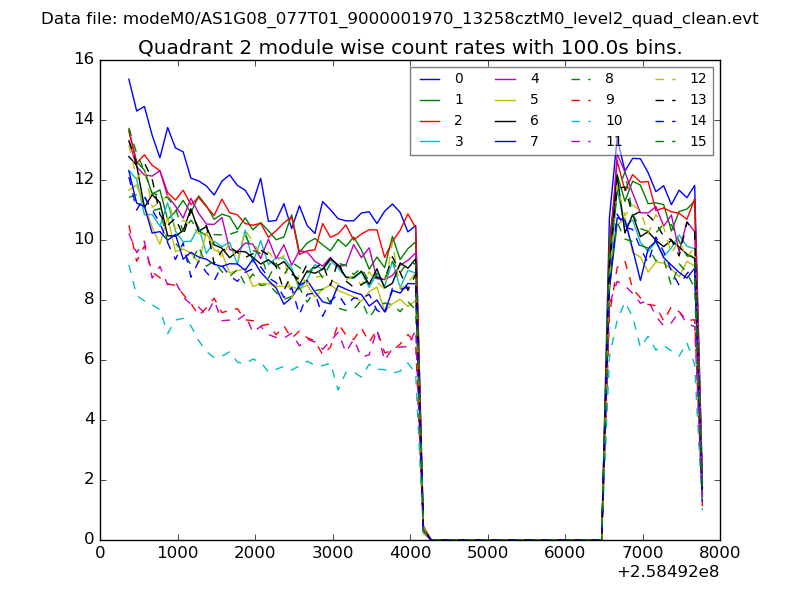
| Module-wise count rates for Quadrant B Data is divided into 100 sec bins |
 |
 |
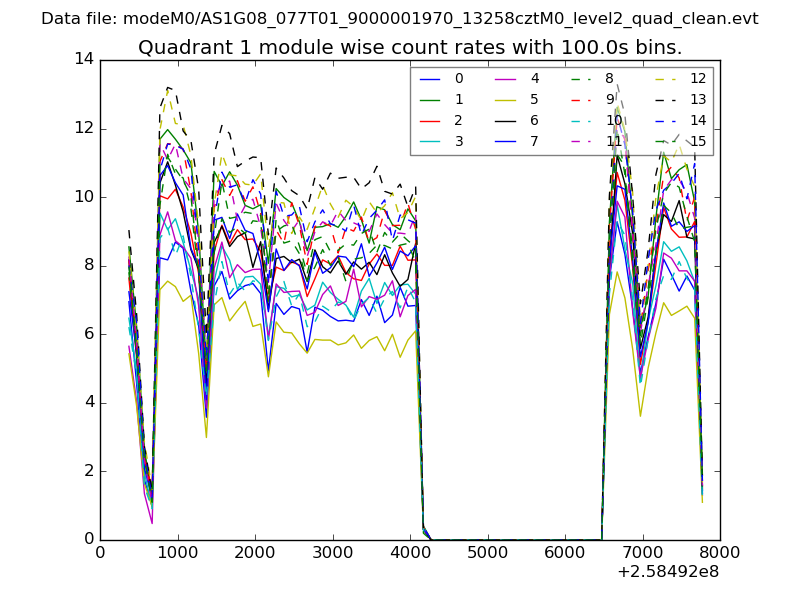
| Module-wise count rates for Quadrant C Data is divided into 100 sec bins |
 |
 |
| Module-wise count rates for Quadrant D Data is divided into 100 sec bins |
 |
 |
| Parameter | Plot |
|---|---|
| CZT HV Monitor | 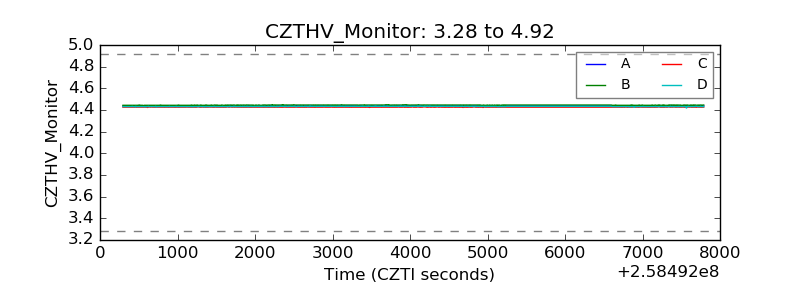 |
| D_VDD | 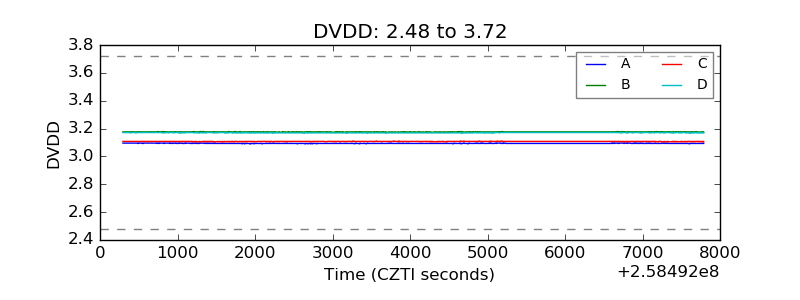 |
| Temperature 1 | 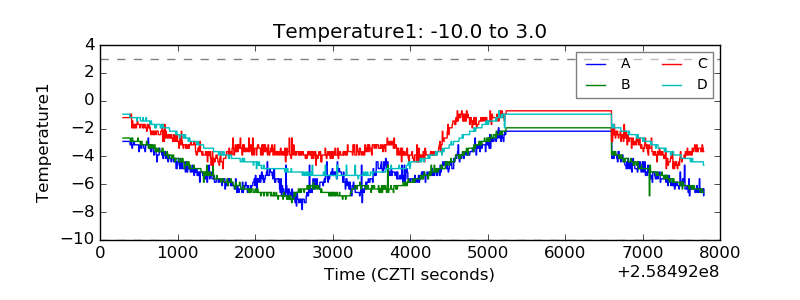 |
| Veto HV Monitor | 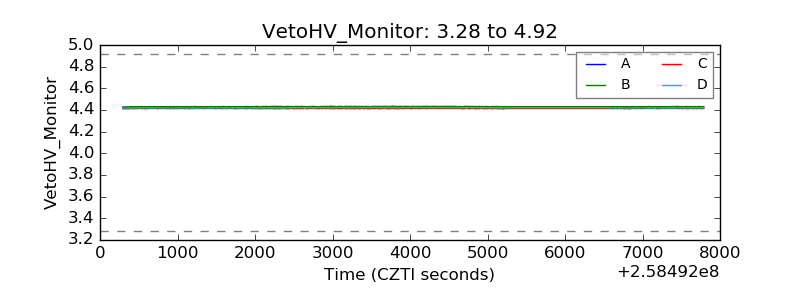 |
| Veto LLD | 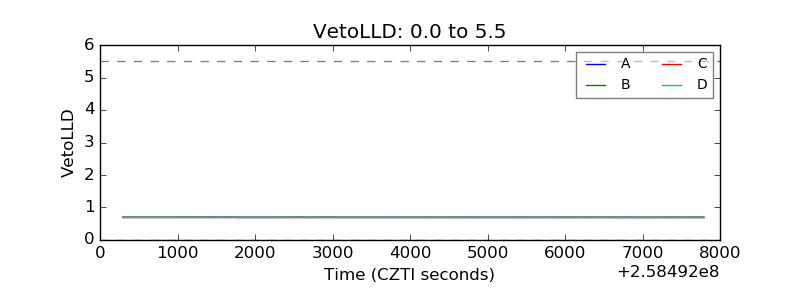 |
| Alpha Counter | 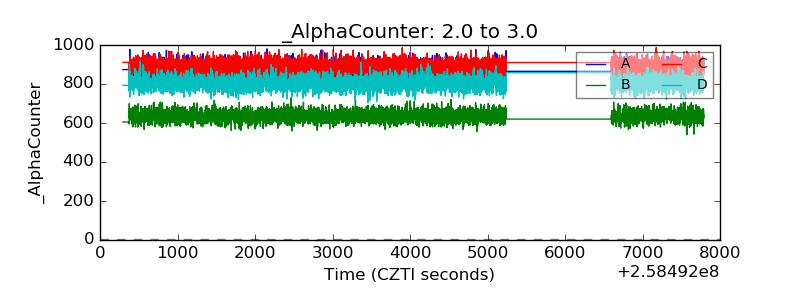 |
| _CPM_Rate | 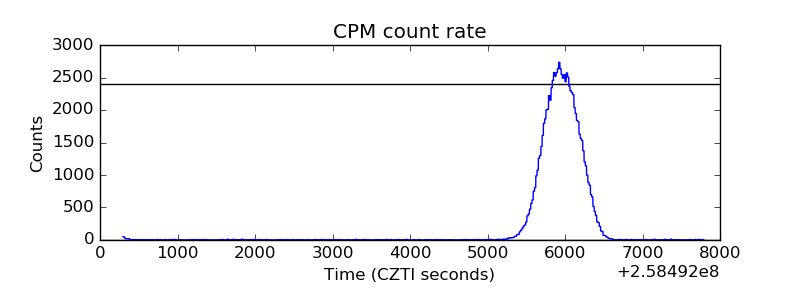 |
| CZT Counter | 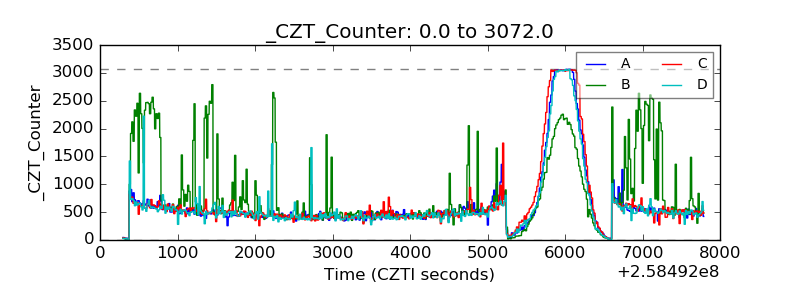 |
| +2.5 Volts monitor |  |
| +5 Volts monitor |  |
| _ROLL_ROT |  |
| _Roll_DEC |  |
| _Roll_RA | 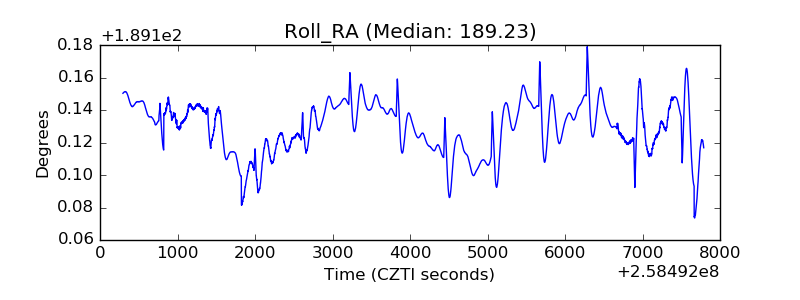 |
| Veto Counter | 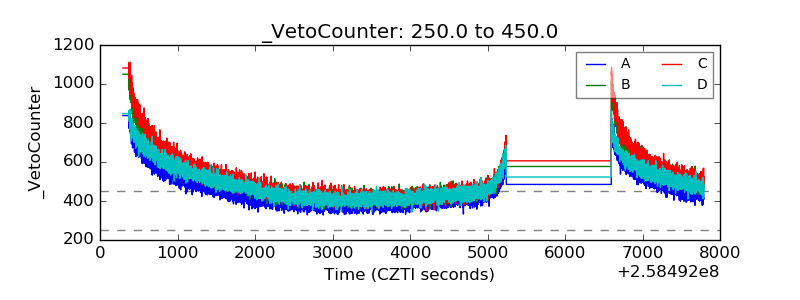 |