| Param | Original file | Final file |
|---|---|---|
| Filename | modeM0/AS1G08_077T01_9000001970_13259cztM0_level2.evt | modeM0/AS1G08_077T01_9000001970_13259cztM0_level2_quad_clean.evt |
| Size (bytes) | 480,669,120 | 96,609,600 |
| Size | 458.4 MB | 92.1 MB |
| Events in quadrant A | 3,228,654 | 629,741 |
| Events in quadrant B | 4,998,131 | 577,789 |
| Events in quadrant C | 2,981,848 | 666,506 |
| Events in quadrant D | 2,932,715 | 624,279 |
| Mode M9 | |||
|---|---|---|---|
| Quadrant | BADHDUFLAG | Total packets | Discarded packets |
| A | 0 | 24 | 0 |
| B | 0 | 24 | 0 |
| C | 0 | 24 | 0 |
| D | 0 | 25 | 0 |
| Mode SS | |||
|---|---|---|---|
| Quadrant | BADHDUFLAG | Total packets | Discarded packets |
| A | 0 | 124 | 0 |
| B | 0 | 124 | 0 |
| C | 0 | 124 | 0 |
| D | 0 | 124 | 0 |
| Mode M0 | |||
|---|---|---|---|
| Quadrant | BADHDUFLAG | Total packets | Discarded packets |
| A | 0 | 13693 | 3 |
| B | 0 | 18987 | 2 |
| C | 0 | 12930 | 2 |
| D | 0 | 12902 | 2 |
| Quadrant | Total seconds | Saturated seconds | Saturation percentage |
|---|---|---|---|
| A | 6118 | 86 | 1.405688% |
| B | 6118 | 908 | 14.841451% |
| C | 6118 | 34 | 0.555737% |
| D | 6118 | 21 | 0.343249% |
Noise dominated data is calculated using 1-second bins in cleaned event files. If a bin has >2000 counts, and if more than 50% of those come from <1% of pixels, then it is considered to be noise-dominated and hence unusable.
| Quadrant | # 1 sec bins | Bins with >0 counts | Bins with >2000 counts | High rate bins dominated by noise | Noise dominated (total time) | Noise dominated (detector-on time) | Marked lightcurve |
|---|---|---|---|---|---|---|---|
| A | 7449 | 6120 | 58 | 58 | 0.78% | 0.95% | 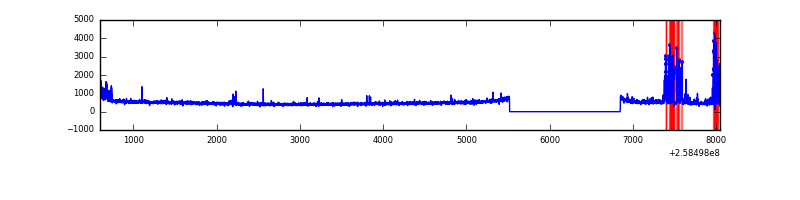 |
| B | 7449 | 6120 | 624 | 624 | 8.38% | 10.20% |  |
| C | 7449 | 6120 | 11 | 11 | 0.15% | 0.18% | 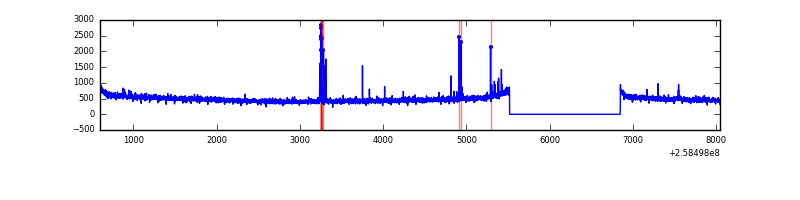 |
| D | 7449 | 6120 | 3 | 3 | 0.04% | 0.05% | 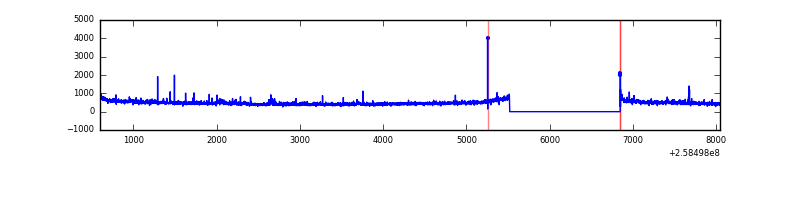 |
Top three noisy pixels from each quadrant. If the there are fewer than three noisy pixels in the level2.evt file, extra rows are filled as -1
| Pixel properties | Quadrant properties | ||||||
|---|---|---|---|---|---|---|---|
| Quadrant | DetID | PixID | Counts | Sigma | Mean | Median | Sigma |
| A | 15 | 239 | 348438 | 2334.42 | 739 | 724 | 149.0 |
| A | 1 | 162 | 14161 | 90.21 | 739 | 724 | 149.0 |
| A | 12 | 96 | 8820 | 54.35 | 739 | 724 | 149.0 |
| B | 4 | 239 | 2237343 | 17381.07 | 691 | 674 | 128.7 |
| B | 0 | 230 | 19162 | 143.67 | 691 | 674 | 128.7 |
| B | 3 | 209 | 16719 | 124.69 | 691 | 674 | 128.7 |
| C | 15 | 208 | 55703 | 322.21 | 747 | 751 | 170.5 |
| C | 14 | 234 | 13293 | 73.54 | 747 | 751 | 170.5 |
| C | 13 | 61 | 5353 | 26.98 | 747 | 751 | 170.5 |
| D | 8 | 195 | 58788 | 333.72 | 729 | 709 | 174.0 |
| D | 1 | 52 | 49265 | 279.0 | 729 | 709 | 174.0 |
| D | 2 | 234 | 23042 | 128.33 | 729 | 709 | 174.0 |
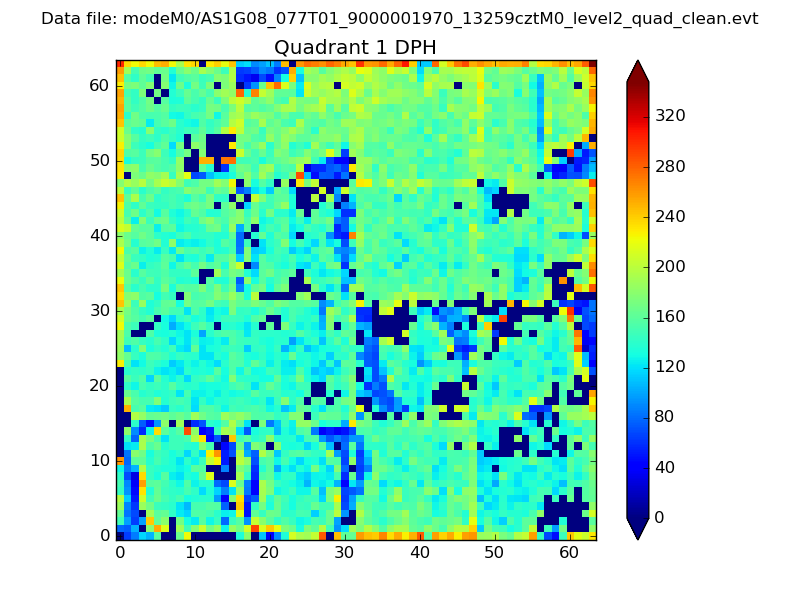
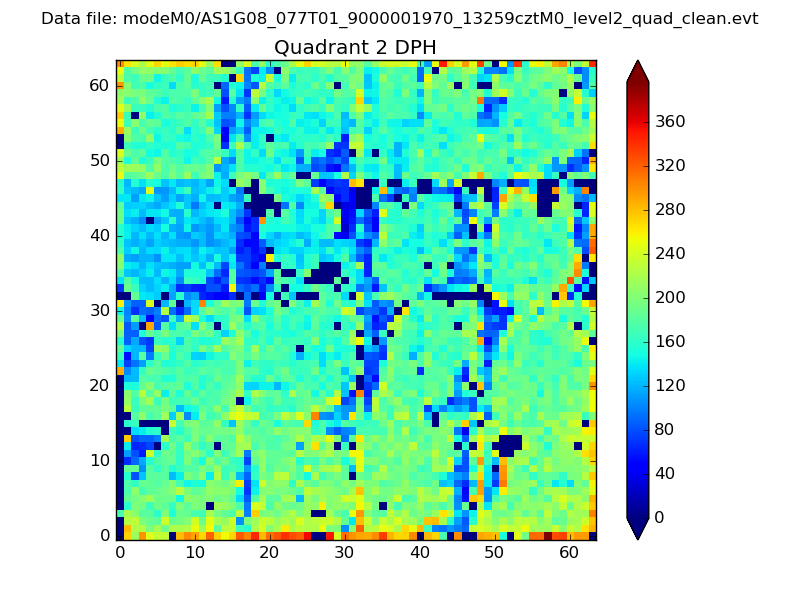
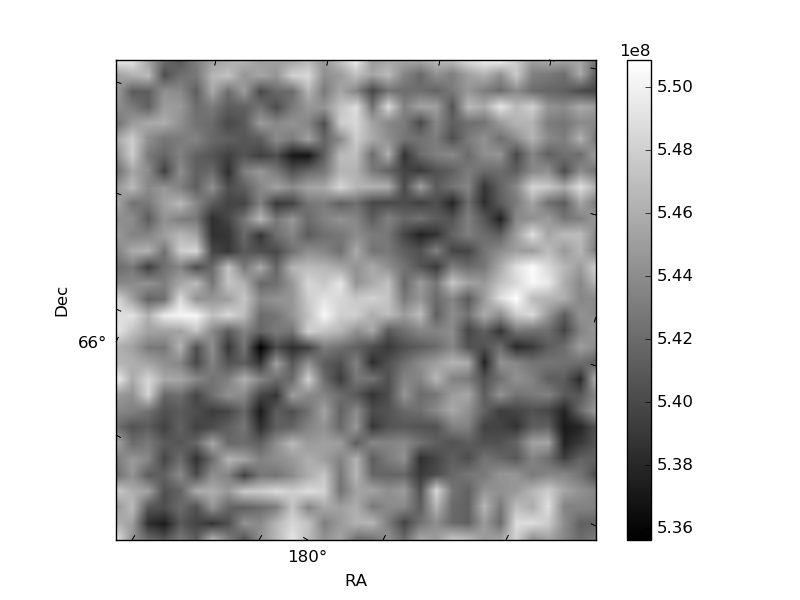
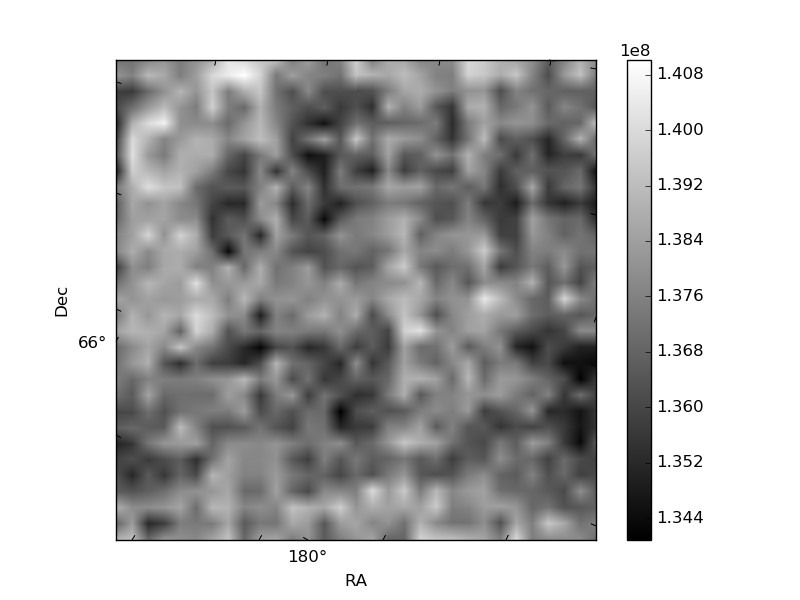
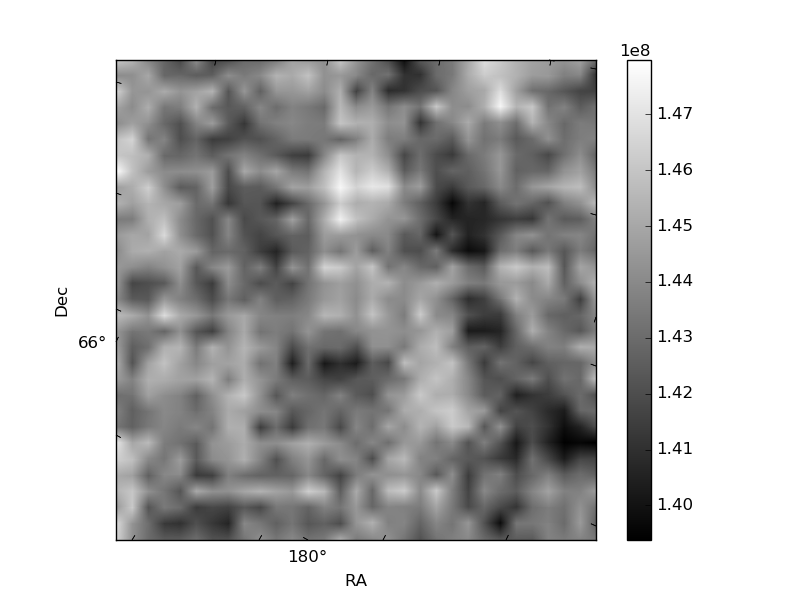
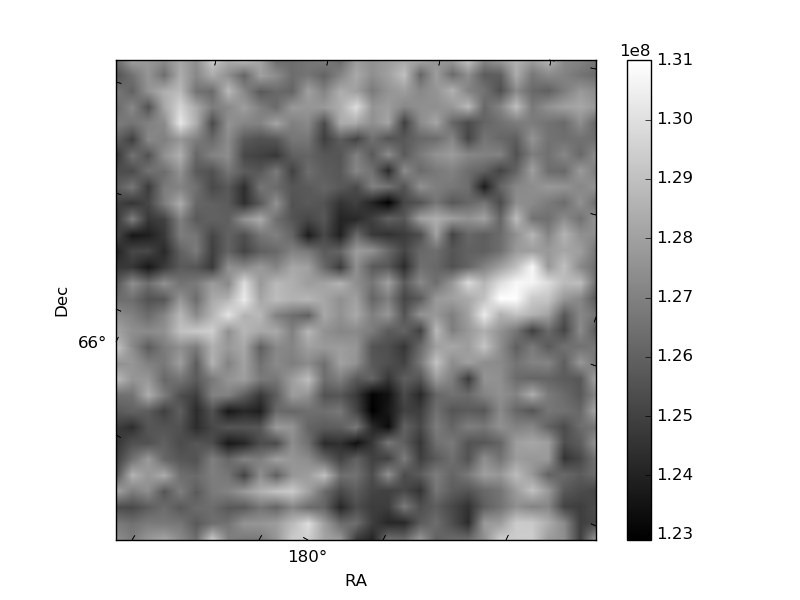
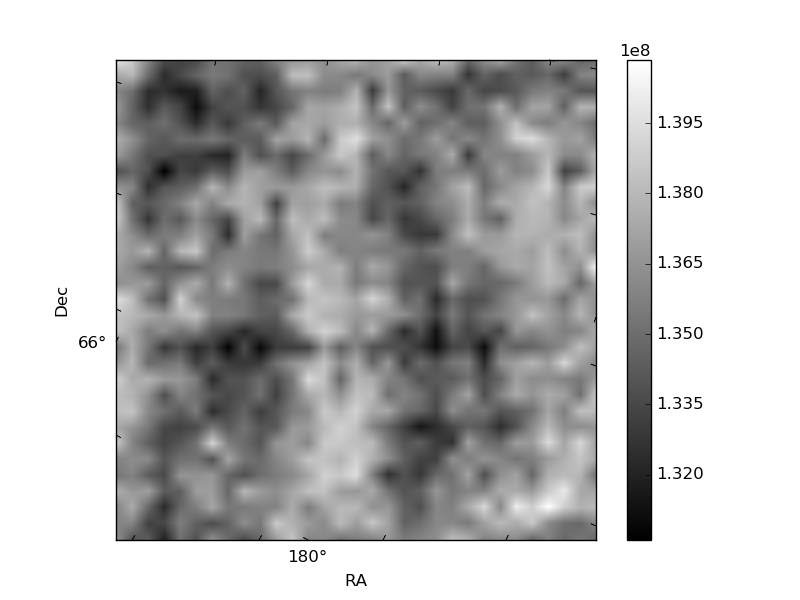
Histogram calculated using DETX and DETY for each event in the final _common_clean file
| Quadrant A | 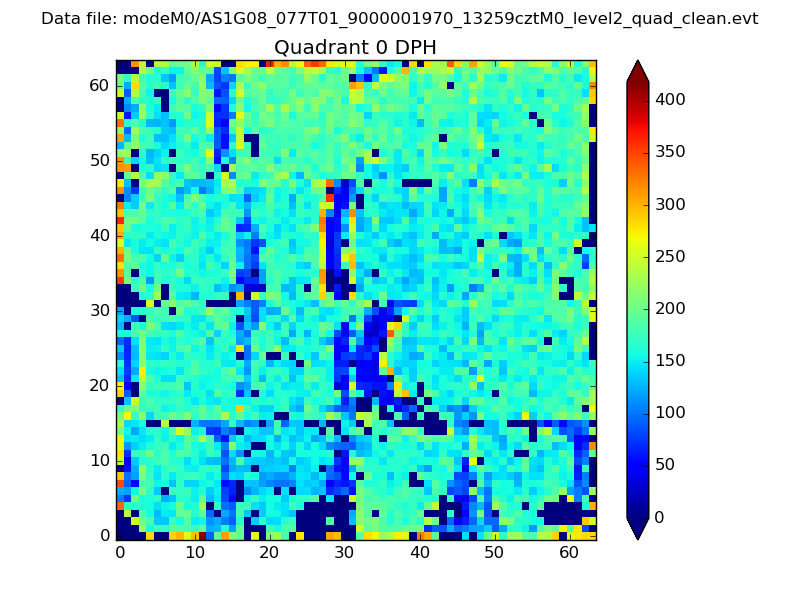 |
 |
Quadrant B |
|---|---|---|---|
| Quadrant D | 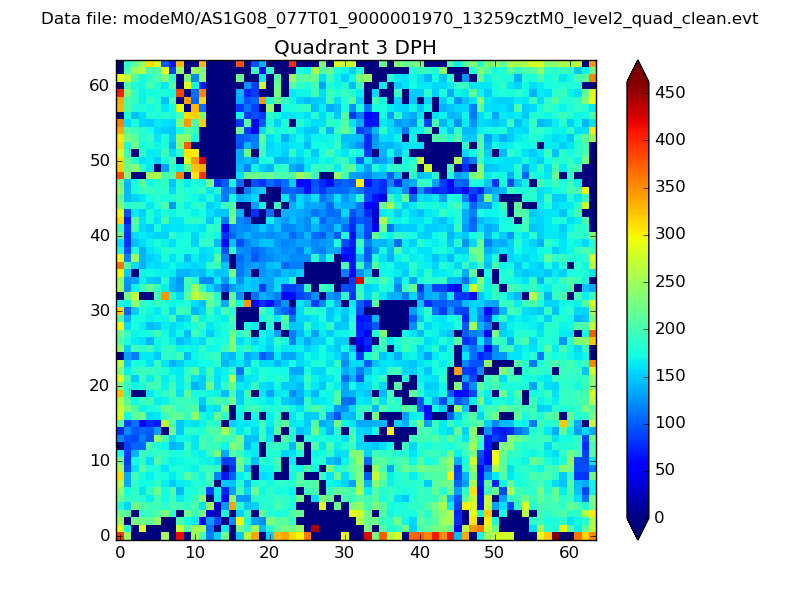 |
 |
Quadrant C |
| Plot type | Count rate plots | Images |
|---|---|---|
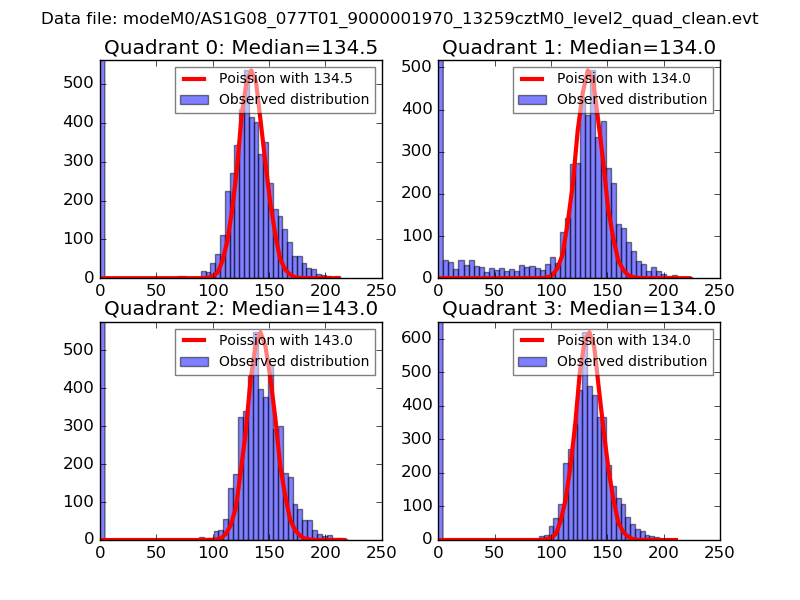
| Comparison with Poisson distribution Blue bars denote a histogram of data divided into 1 sec bins. Red curve is a Poisson curve with rate = median count rate of data. |
 |
 |
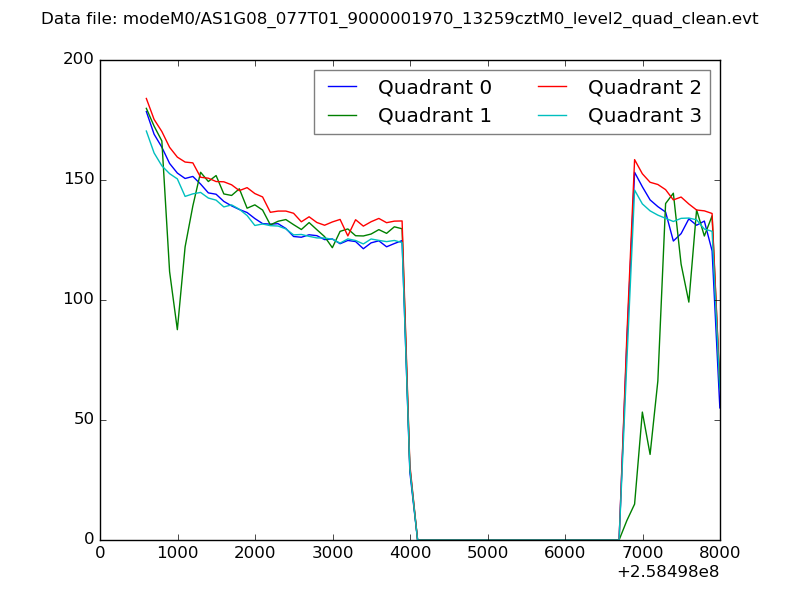
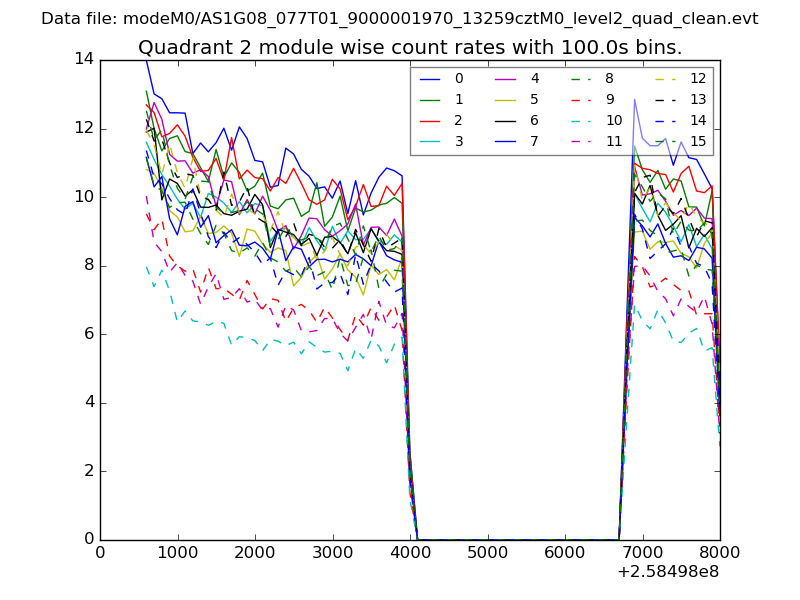
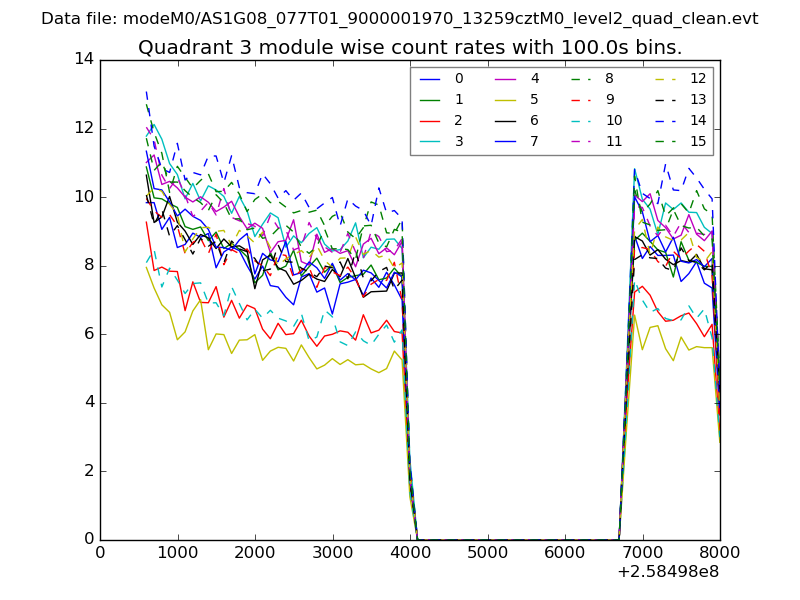
| Quadrant-wise count rates Data is divided into 100 sec bins |
 |
|
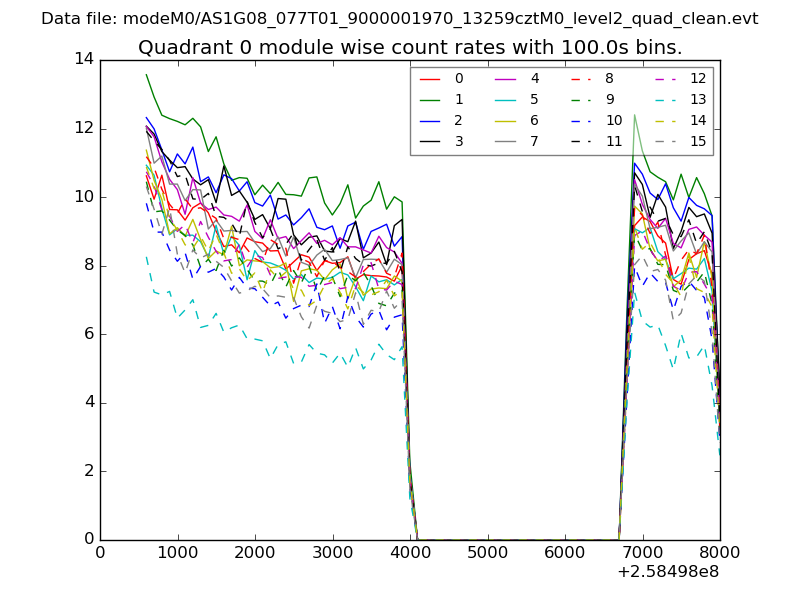
| Module-wise count rates for Quadrant A Data is divided into 100 sec bins |
 |
 |
| Module-wise count rates for Quadrant B Data is divided into 100 sec bins |
 |
 |
| Module-wise count rates for Quadrant C Data is divided into 100 sec bins |
 |
 |
| Module-wise count rates for Quadrant D Data is divided into 100 sec bins |
 |
 |
| Parameter | Plot |
|---|---|
| CZT HV Monitor | 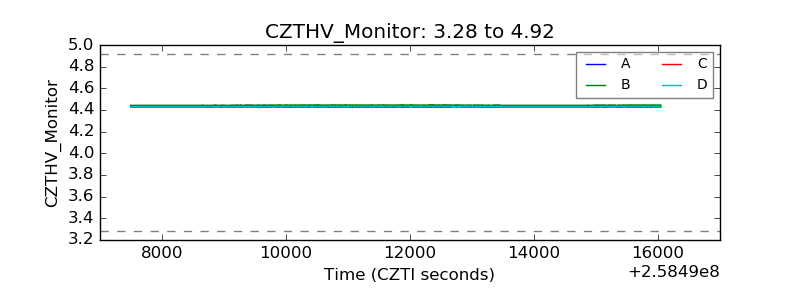 |
| D_VDD | 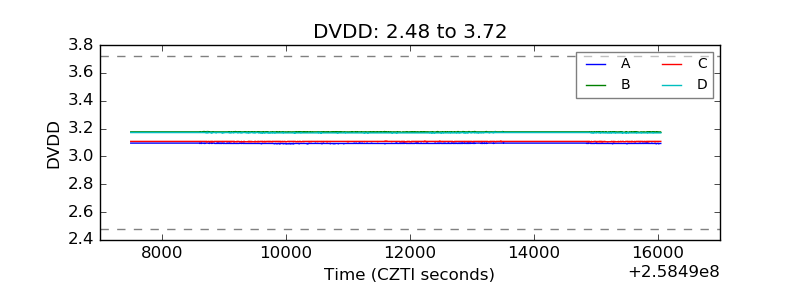 |
| Temperature 1 | 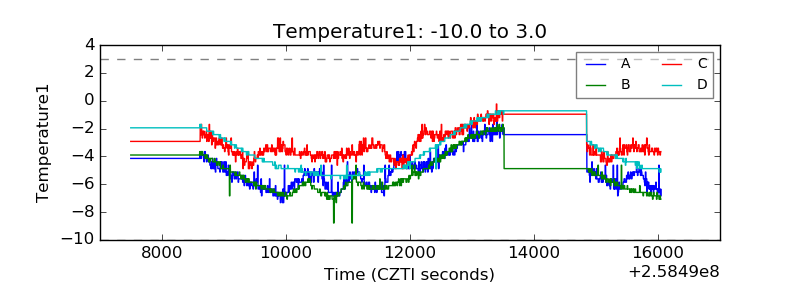 |
| Veto HV Monitor | 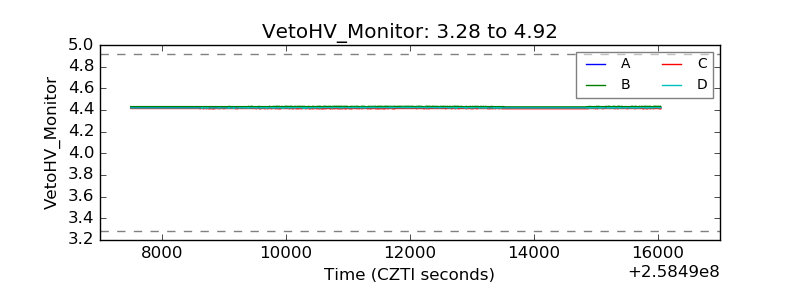 |
| Veto LLD | 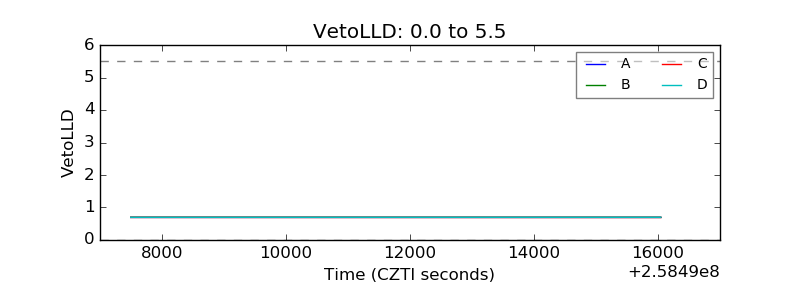 |
| Alpha Counter | 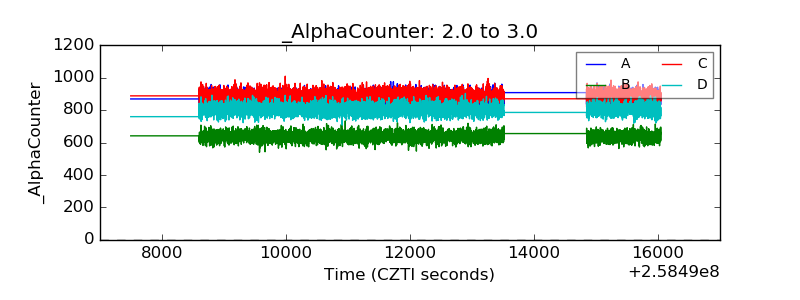 |
| _CPM_Rate | 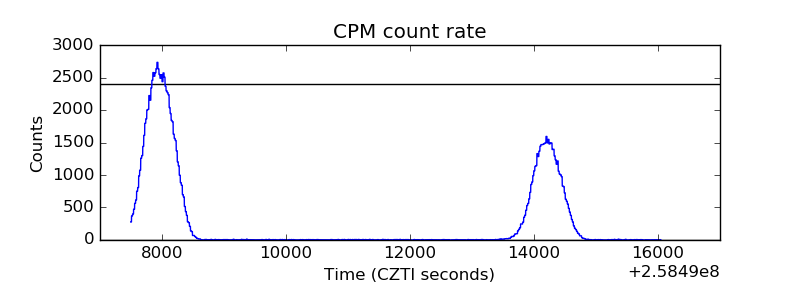 |
| CZT Counter | 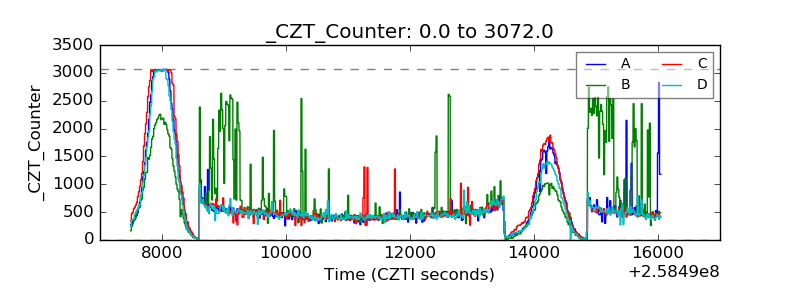 |
| +2.5 Volts monitor |  |
| +5 Volts monitor |  |
| _ROLL_ROT | 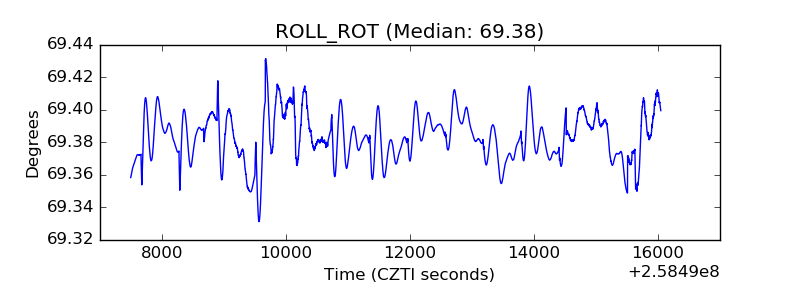 |
| _Roll_DEC | 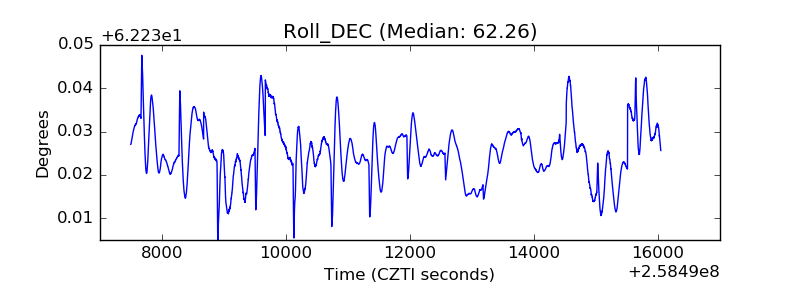 |
| _Roll_RA | 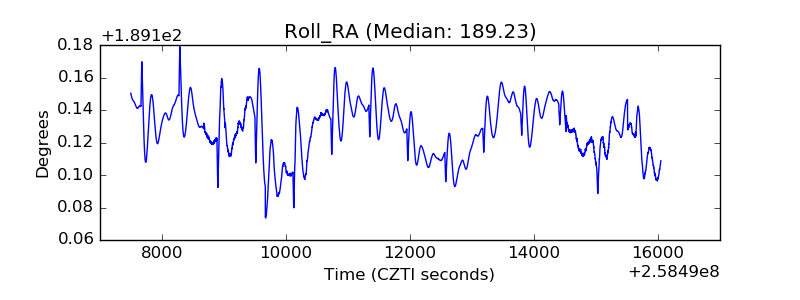 |
| Veto Counter | 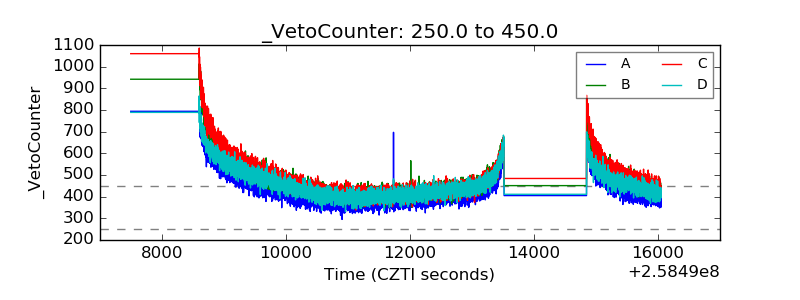 |