| Param | Original file | Final file |
|---|---|---|
| Filename | modeM0/AS1G08_077T01_9000001970_13260cztM0_level2.evt | modeM0/AS1G08_077T01_9000001970_13260cztM0_level2_quad_clean.evt |
| Size (bytes) | 504,982,080 | 93,340,800 |
| Size | 481.6 MB | 89.0 MB |
| Events in quadrant A | 3,777,131 | 599,975 |
| Events in quadrant B | 5,124,434 | 554,280 |
| Events in quadrant C | 2,967,330 | 631,749 |
| Events in quadrant D | 2,991,336 | 595,549 |
| Mode M9 | |||
|---|---|---|---|
| Quadrant | BADHDUFLAG | Total packets | Discarded packets |
| A | 0 | 17 | 0 |
| B | 0 | 17 | 0 |
| C | 0 | 17 | 0 |
| D | 0 | 18 | 0 |
| Mode SS | |||
|---|---|---|---|
| Quadrant | BADHDUFLAG | Total packets | Discarded packets |
| A | 0 | 130 | 0 |
| B | 0 | 130 | 0 |
| C | 0 | 130 | 0 |
| D | 0 | 130 | 0 |
| Mode M0 | |||
|---|---|---|---|
| Quadrant | BADHDUFLAG | Total packets | Discarded packets |
| A | 0 | 15702 | 3 |
| B | 0 | 19604 | 2 |
| C | 0 | 13205 | 2 |
| D | 0 | 13415 | 2 |
| Quadrant | Total seconds | Saturated seconds | Saturation percentage |
|---|---|---|---|
| A | 6375 | 158 | 2.478431% |
| B | 6375 | 1008 | 15.811765% |
| C | 6375 | 35 | 0.549020% |
| D | 6375 | 13 | 0.203922% |
Noise dominated data is calculated using 1-second bins in cleaned event files. If a bin has >2000 counts, and if more than 50% of those come from <1% of pixels, then it is considered to be noise-dominated and hence unusable.
| Quadrant | # 1 sec bins | Bins with >0 counts | Bins with >2000 counts | High rate bins dominated by noise | Noise dominated (total time) | Noise dominated (detector-on time) | Marked lightcurve |
|---|---|---|---|---|---|---|---|
| A | 7491 | 6377 | 106 | 106 | 1.42% | 1.66% | 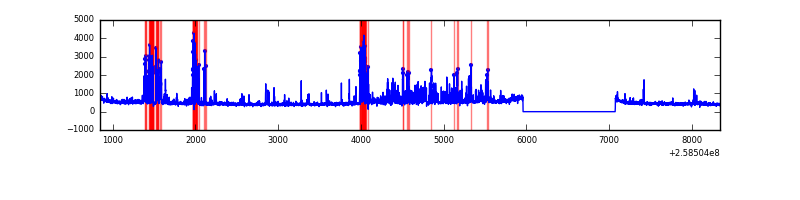 |
| B | 7491 | 6377 | 667 | 667 | 8.90% | 10.46% | 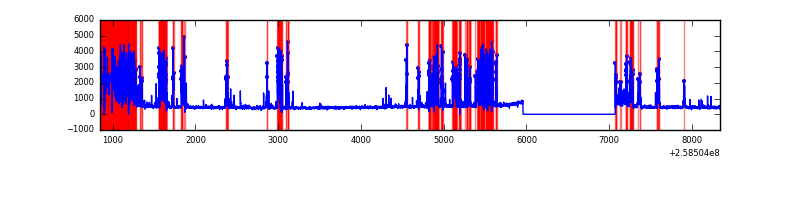 |
| C | 7491 | 6377 | 8 | 8 | 0.11% | 0.13% |  |
| D | 7491 | 6377 | 3 | 3 | 0.04% | 0.05% | 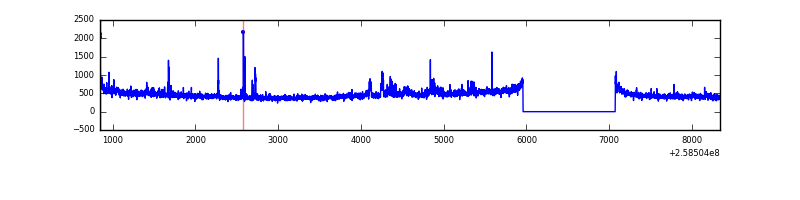 |
Top three noisy pixels from each quadrant. If the there are fewer than three noisy pixels in the level2.evt file, extra rows are filled as -1
| Pixel properties | Quadrant properties | ||||||
|---|---|---|---|---|---|---|---|
| Quadrant | DetID | PixID | Counts | Sigma | Mean | Median | Sigma |
| A | 15 | 239 | 887466 | 5888.78 | 743 | 727 | 150.6 |
| A | 12 | 96 | 15209 | 96.17 | 743 | 727 | 150.6 |
| A | 1 | 162 | 12709 | 79.57 | 743 | 727 | 150.6 |
| B | 4 | 239 | 2409658 | 18794.96 | 679 | 662 | 128.2 |
| B | 0 | 214 | 20918 | 158.04 | 679 | 662 | 128.2 |
| B | 0 | 230 | 16969 | 127.23 | 679 | 662 | 128.2 |
| C | 15 | 208 | 49278 | 284.71 | 745 | 750 | 170.4 |
| C | 3 | 233 | 8453 | 45.19 | 745 | 750 | 170.4 |
| C | 13 | 61 | 5282 | 26.59 | 745 | 750 | 170.4 |
| D | 13 | 122 | 108404 | 621.04 | 729 | 707 | 173.4 |
| D | 8 | 195 | 60919 | 347.21 | 729 | 707 | 173.4 |
| D | 5 | 222 | 29427 | 165.61 | 729 | 707 | 173.4 |
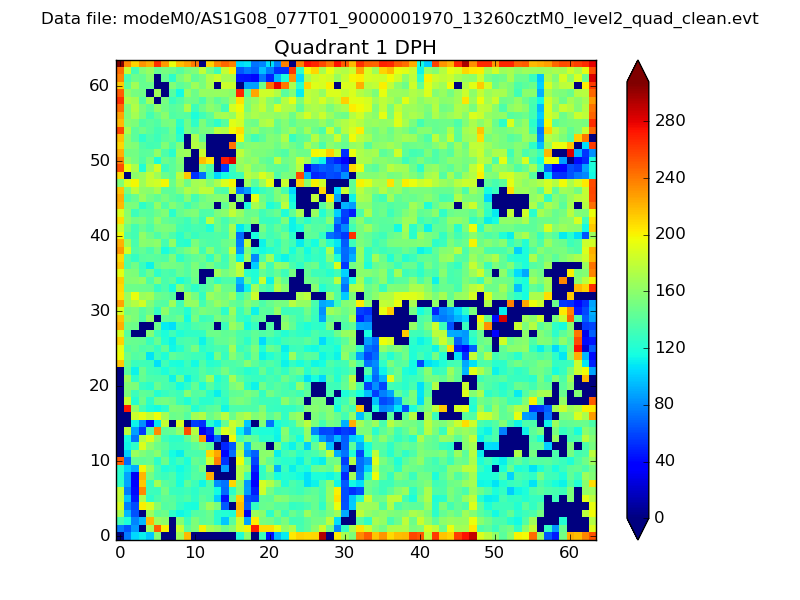
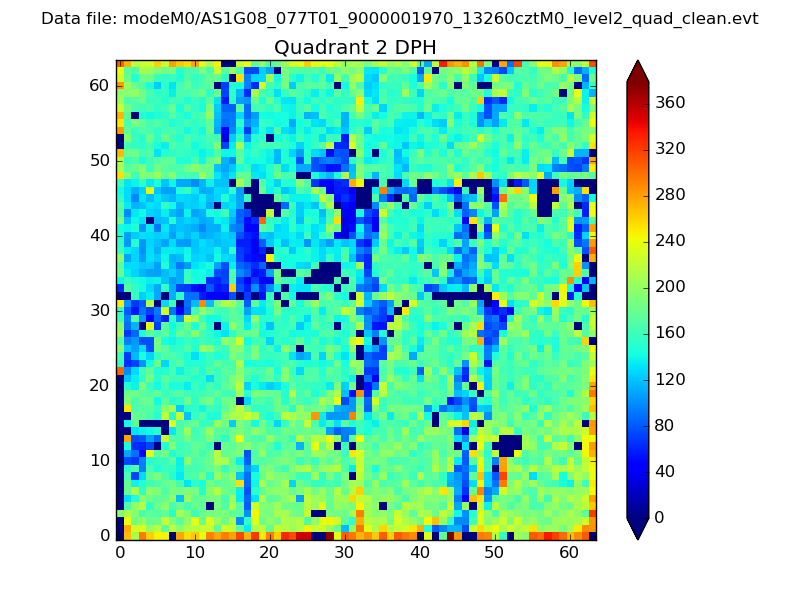
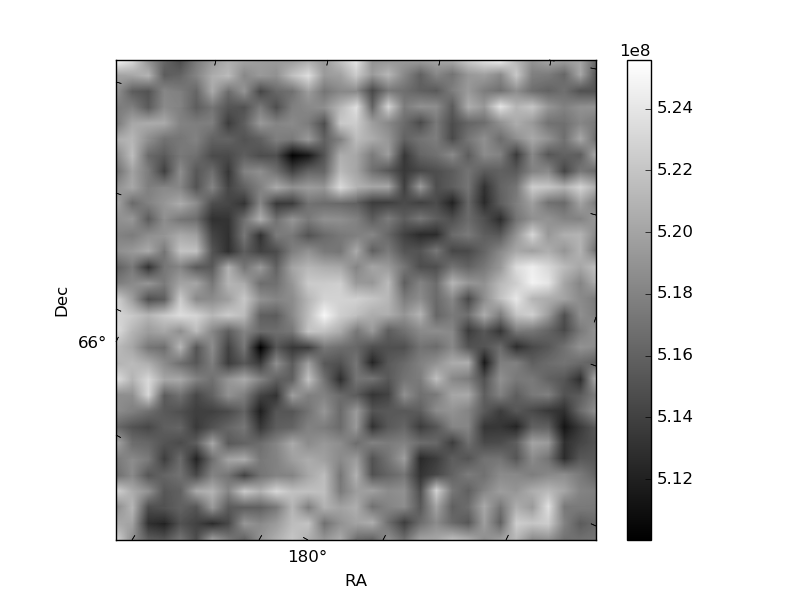
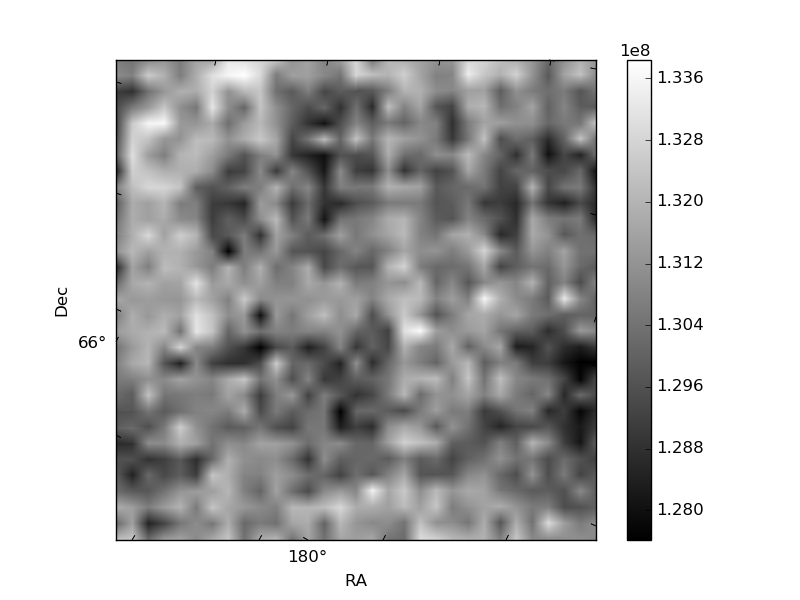
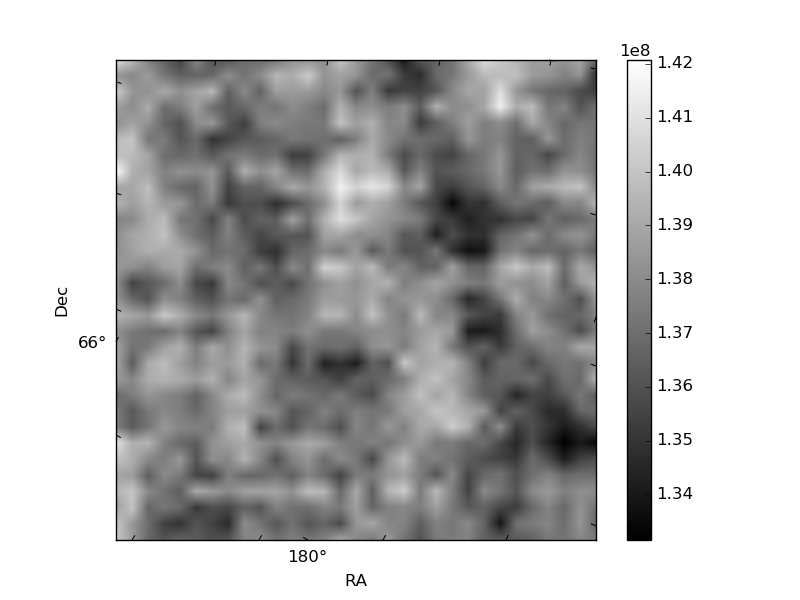
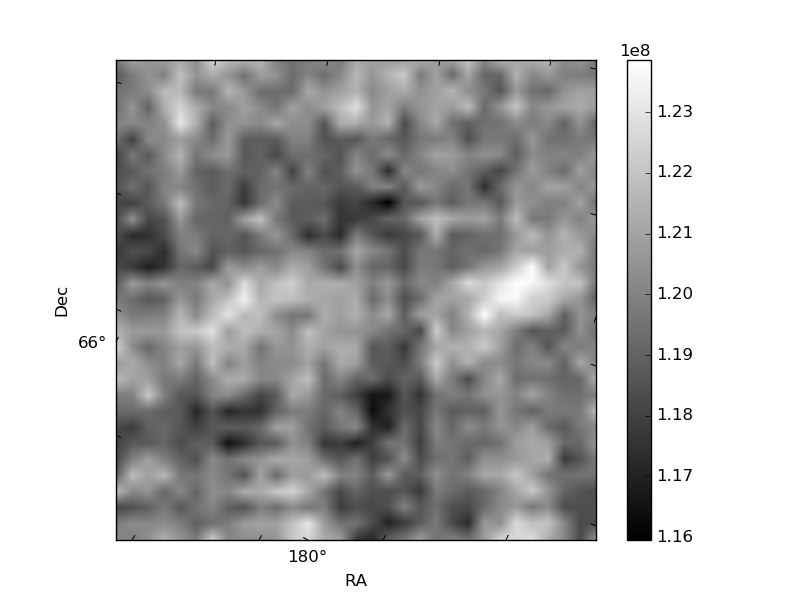
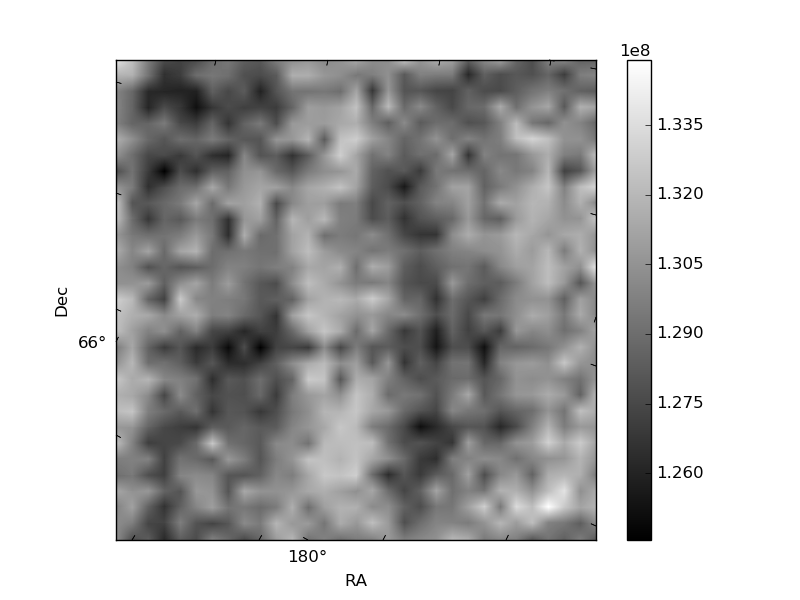
Histogram calculated using DETX and DETY for each event in the final _common_clean file
| Quadrant A | 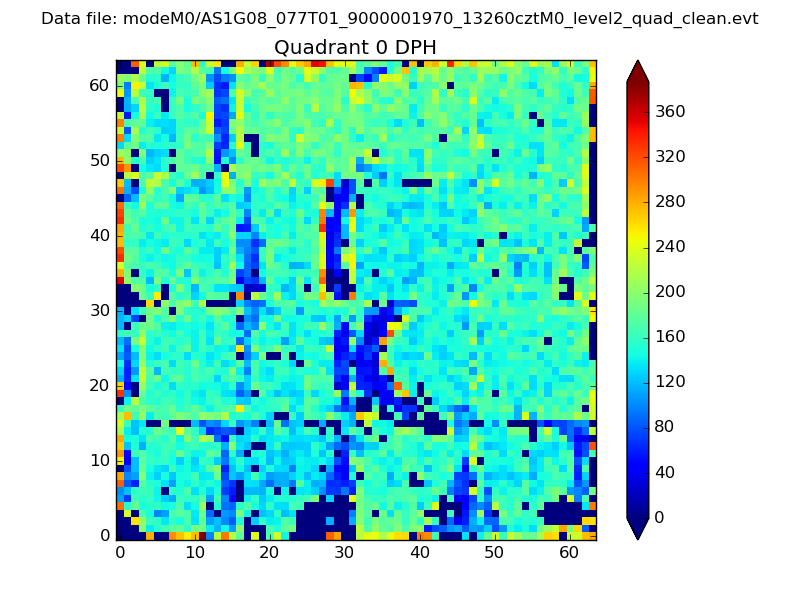 |
 |
Quadrant B |
|---|---|---|---|
| Quadrant D | 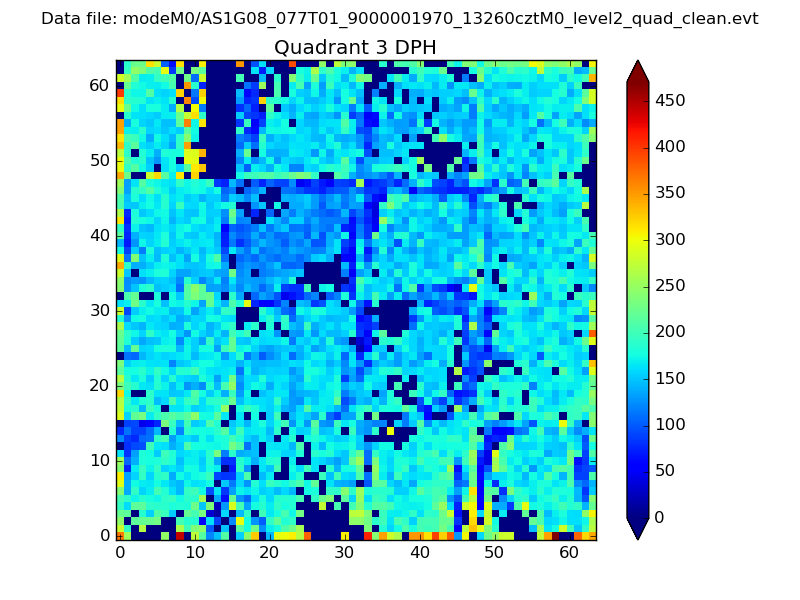 |
 |
Quadrant C |
| Plot type | Count rate plots | Images |
|---|---|---|
| Comparison with Poisson distribution Blue bars denote a histogram of data divided into 1 sec bins. Red curve is a Poisson curve with rate = median count rate of data. |
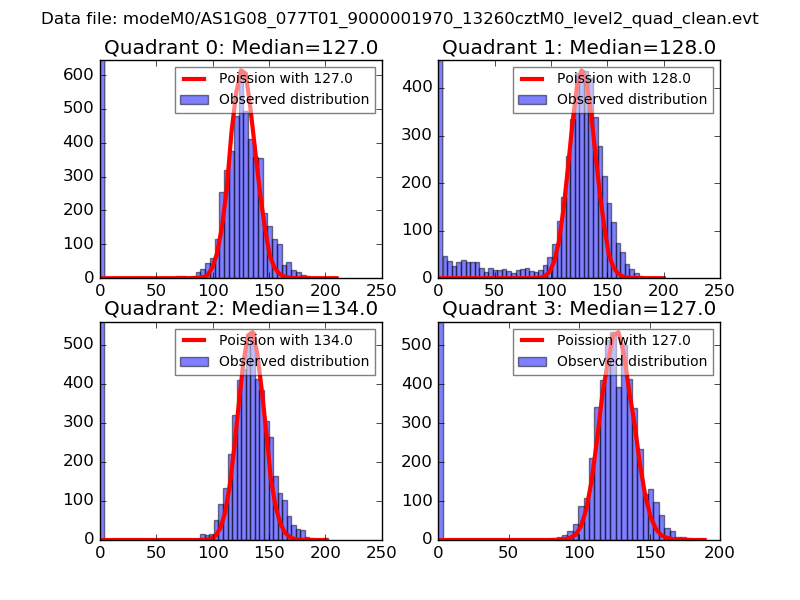 |
 |
| Quadrant-wise count rates Data is divided into 100 sec bins |
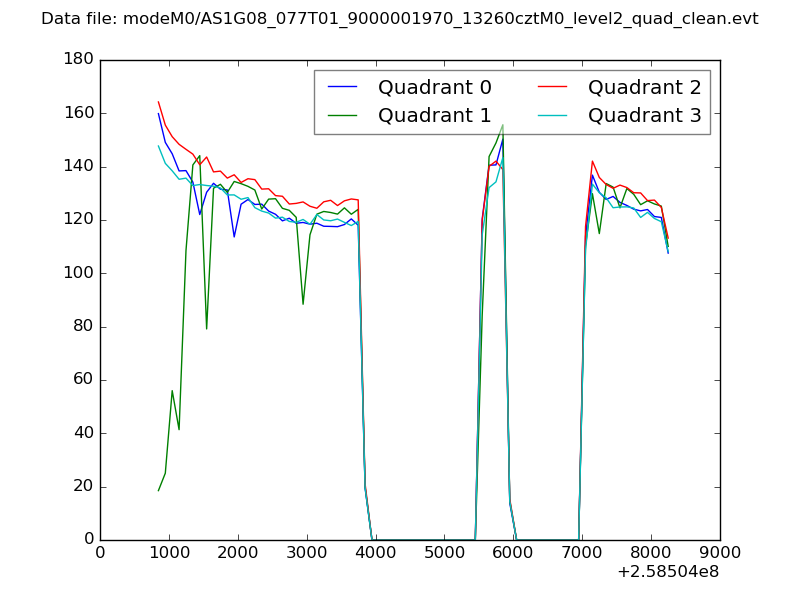 |
|
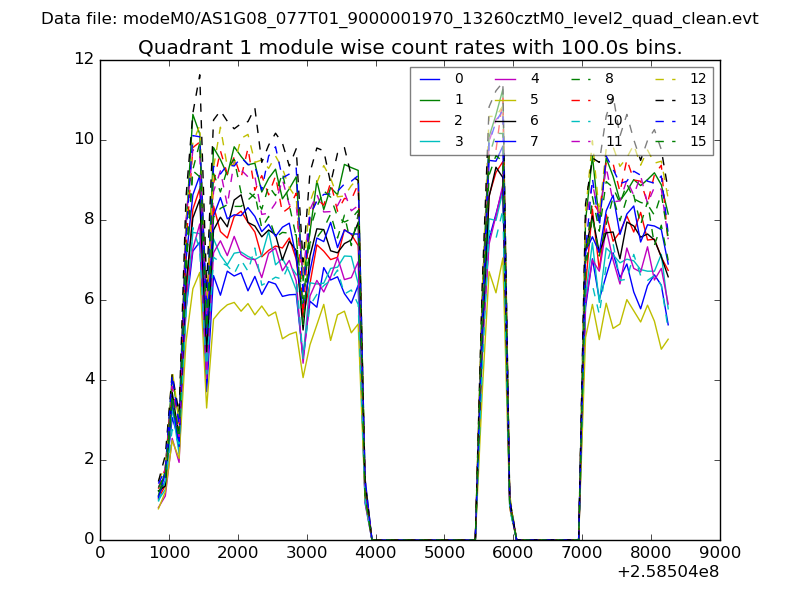
| Module-wise count rates for Quadrant A Data is divided into 100 sec bins |
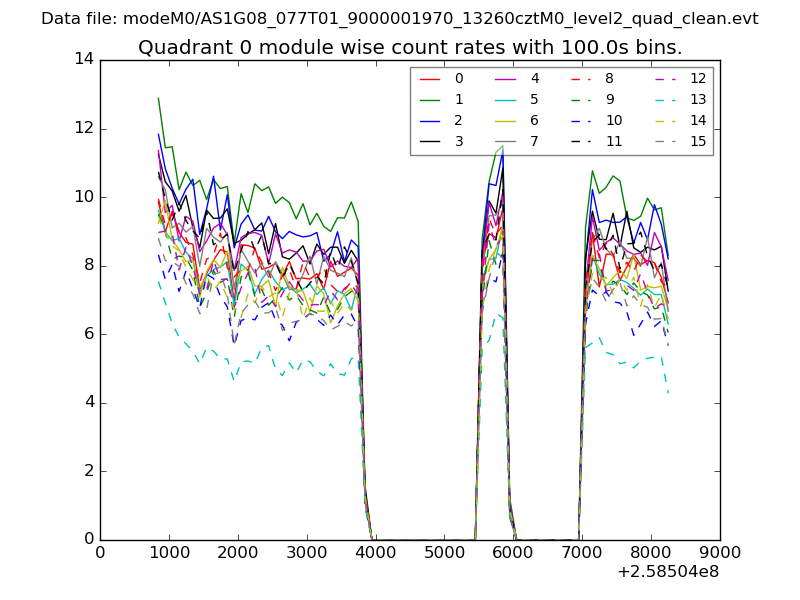 |
 |
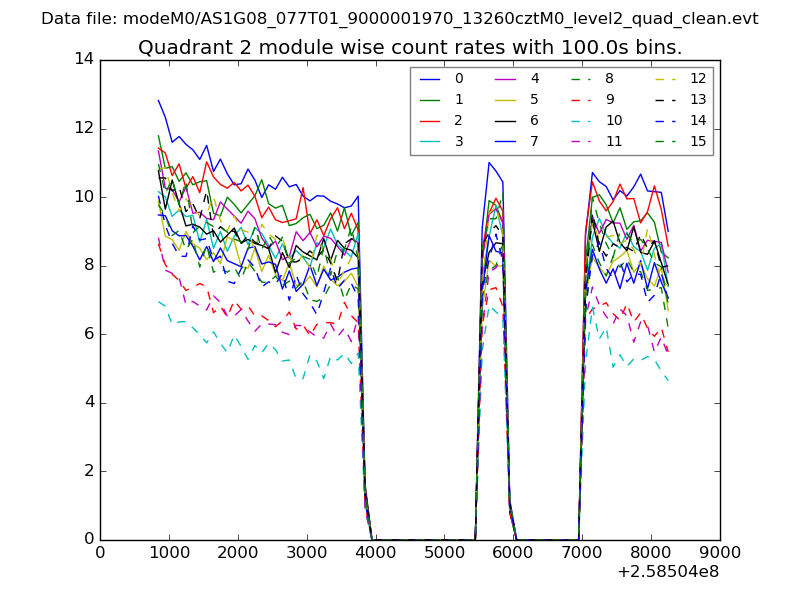
| Module-wise count rates for Quadrant B Data is divided into 100 sec bins |
 |
 |
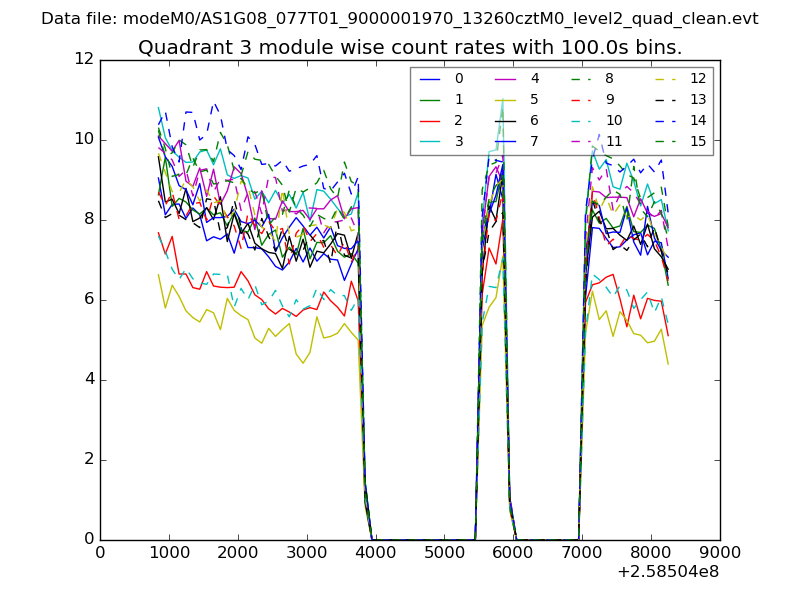
| Module-wise count rates for Quadrant C Data is divided into 100 sec bins |
 |
 |
| Module-wise count rates for Quadrant D Data is divided into 100 sec bins |
 |
 |
| Parameter | Plot |
|---|---|
| CZT HV Monitor | 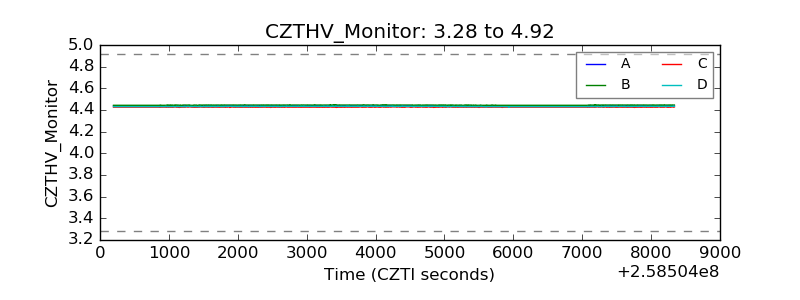 |
| D_VDD | 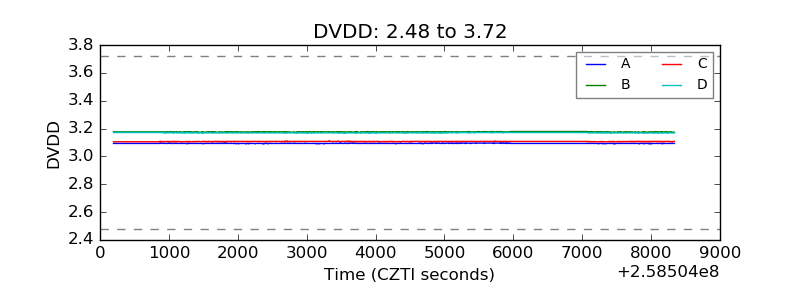 |
| Temperature 1 |  |
| Veto HV Monitor |  |
| Veto LLD | 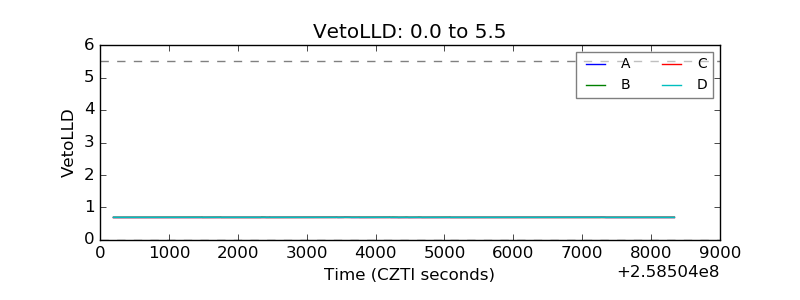 |
| Alpha Counter | 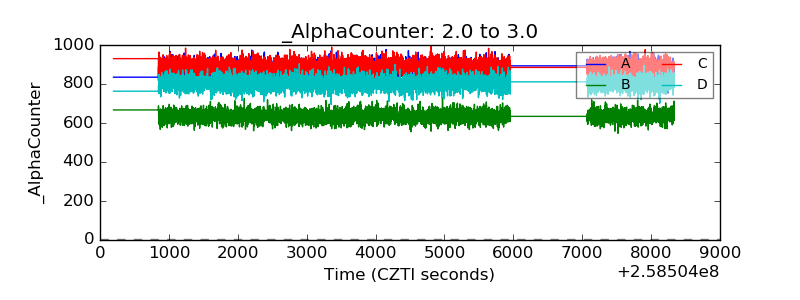 |
| _CPM_Rate | 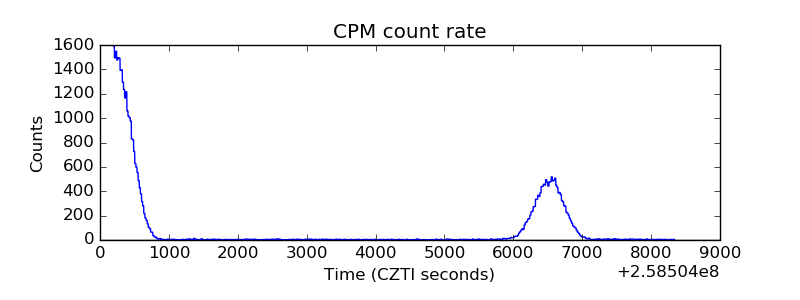 |
| CZT Counter | 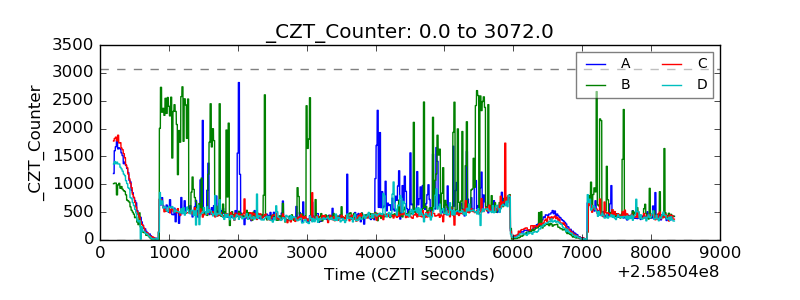 |
| +2.5 Volts monitor |  |
| +5 Volts monitor |  |
| _ROLL_ROT | 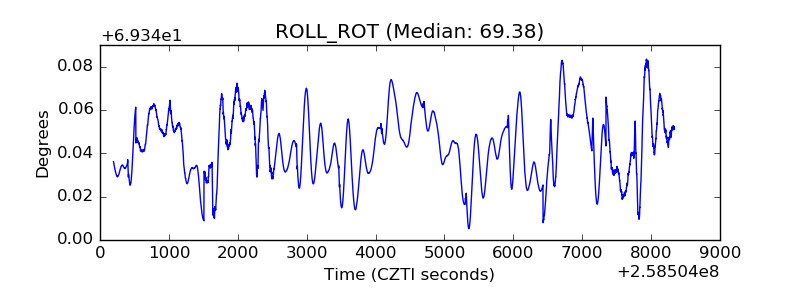 |
| _Roll_DEC | 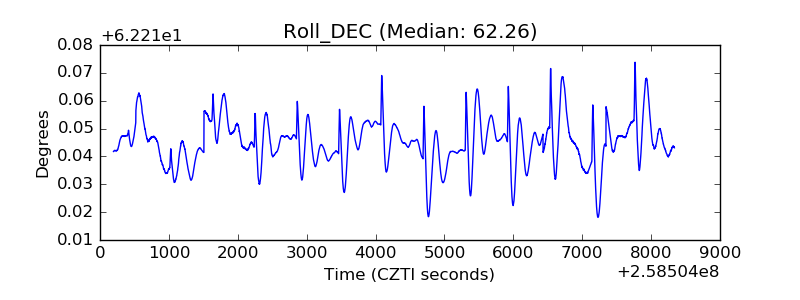 |
| _Roll_RA | 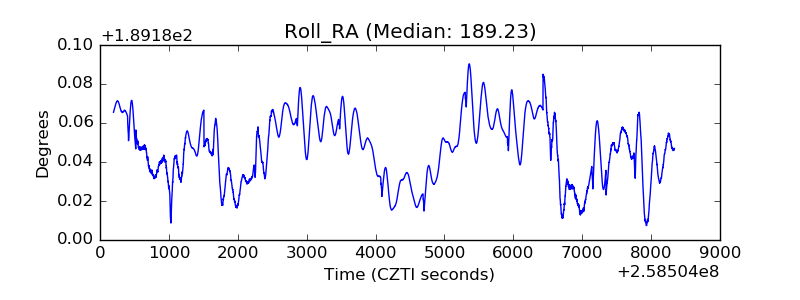 |
| Veto Counter | 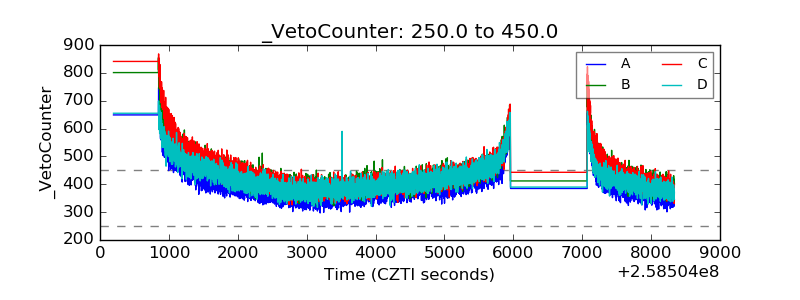 |