| Param | Original file | Final file |
|---|---|---|
| Filename | modeM0/AS1G08_077T01_9000001970_13261cztM0_level2.evt | modeM0/AS1G08_077T01_9000001970_13261cztM0_level2_quad_clean.evt |
| Size (bytes) | 488,370,240 | 101,154,240 |
| Size | 465.7 MB | 96.5 MB |
| Events in quadrant A | 3,196,363 | 643,558 |
| Events in quadrant B | 4,938,259 | 631,302 |
| Events in quadrant C | 3,148,463 | 667,231 |
| Events in quadrant D | 3,036,023 | 638,230 |
| Mode M9 | |||
|---|---|---|---|
| Quadrant | BADHDUFLAG | Total packets | Discarded packets |
| A | 0 | 12 | 0 |
| B | 0 | 12 | 0 |
| C | 0 | 12 | 0 |
| D | 0 | 13 | 0 |
| Mode SS | |||
|---|---|---|---|
| Quadrant | BADHDUFLAG | Total packets | Discarded packets |
| A | 0 | 142 | 0 |
| B | 0 | 142 | 0 |
| C | 0 | 142 | 0 |
| D | 0 | 142 | 0 |
| Mode M0 | |||
|---|---|---|---|
| Quadrant | BADHDUFLAG | Total packets | Discarded packets |
| A | 0 | 14393 | 3 |
| B | 0 | 19529 | 2 |
| C | 0 | 14173 | 2 |
| D | 0 | 14212 | 2 |
| Quadrant | Total seconds | Saturated seconds | Saturation percentage |
|---|---|---|---|
| A | 6927 | 29 | 0.418652% |
| B | 6927 | 797 | 11.505702% |
| C | 6927 | 15 | 0.216544% |
| D | 6927 | 12 | 0.173235% |
Noise dominated data is calculated using 1-second bins in cleaned event files. If a bin has >2000 counts, and if more than 50% of those come from <1% of pixels, then it is considered to be noise-dominated and hence unusable.
| Quadrant | # 1 sec bins | Bins with >0 counts | Bins with >2000 counts | High rate bins dominated by noise | Noise dominated (total time) | Noise dominated (detector-on time) | Marked lightcurve |
|---|---|---|---|---|---|---|---|
| A | 7683 | 6930 | 8 | 8 | 0.10% | 0.12% | 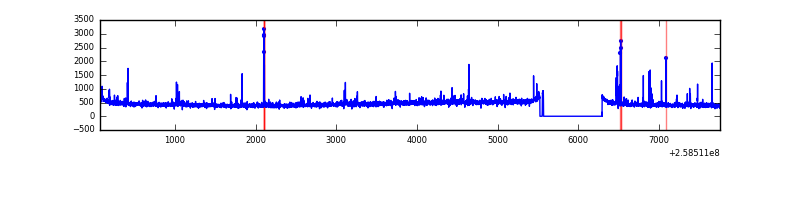 |
| B | 7683 | 6929 | 526 | 526 | 6.85% | 7.59% | 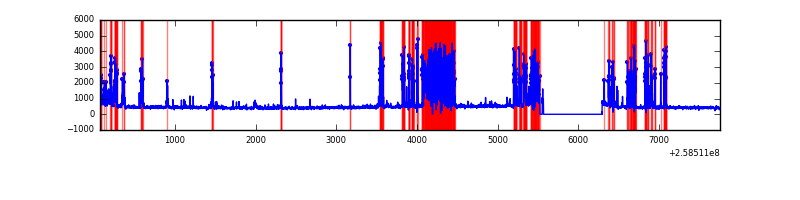 |
| C | 7683 | 6929 | 0 | 0 | 0.00% | 0.00% | 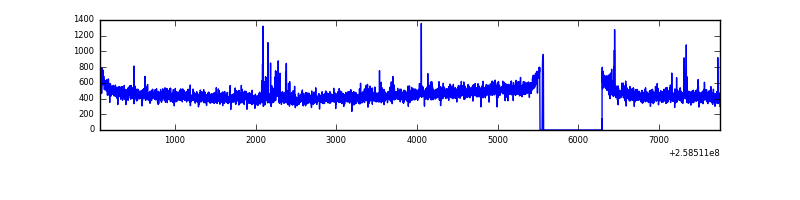 |
| D | 7683 | 6930 | 1 | 1 | 0.01% | 0.01% | 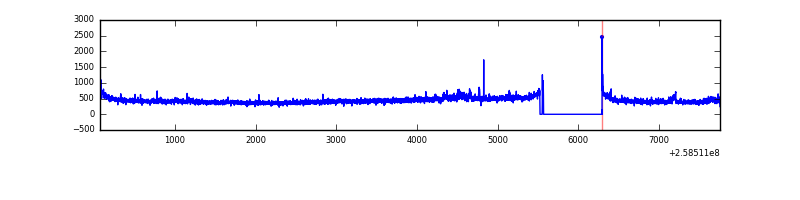 |
Top three noisy pixels from each quadrant. If the there are fewer than three noisy pixels in the level2.evt file, extra rows are filled as -1
| Pixel properties | Quadrant properties | ||||||
|---|---|---|---|---|---|---|---|
| Quadrant | DetID | PixID | Counts | Sigma | Mean | Median | Sigma |
| A | 15 | 239 | 93398 | 579.04 | 788 | 770 | 160.0 |
| A | 12 | 96 | 31013 | 189.05 | 788 | 770 | 160.0 |
| A | 13 | 248 | 17696 | 105.81 | 788 | 770 | 160.0 |
| B | 4 | 239 | 2000585 | 14142.6 | 745 | 724 | 141.4 |
| B | 12 | 111 | 16375 | 110.68 | 745 | 724 | 141.4 |
| B | 0 | 230 | 15427 | 103.98 | 745 | 724 | 141.4 |
| C | 3 | 233 | 75155 | 413.18 | 783 | 786 | 180.0 |
| C | 14 | 234 | 7760 | 38.75 | 783 | 786 | 180.0 |
| C | 15 | 208 | 6002 | 28.98 | 783 | 786 | 180.0 |
| D | 8 | 195 | 77340 | 413.11 | 769 | 745 | 185.4 |
| D | 13 | 122 | 29525 | 155.22 | 769 | 745 | 185.4 |
| D | 2 | 234 | 23285 | 121.57 | 769 | 745 | 185.4 |
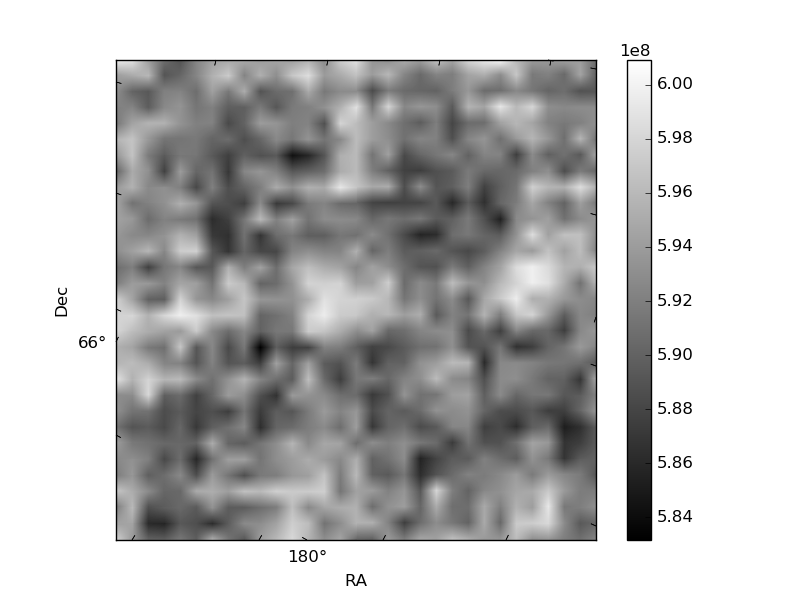
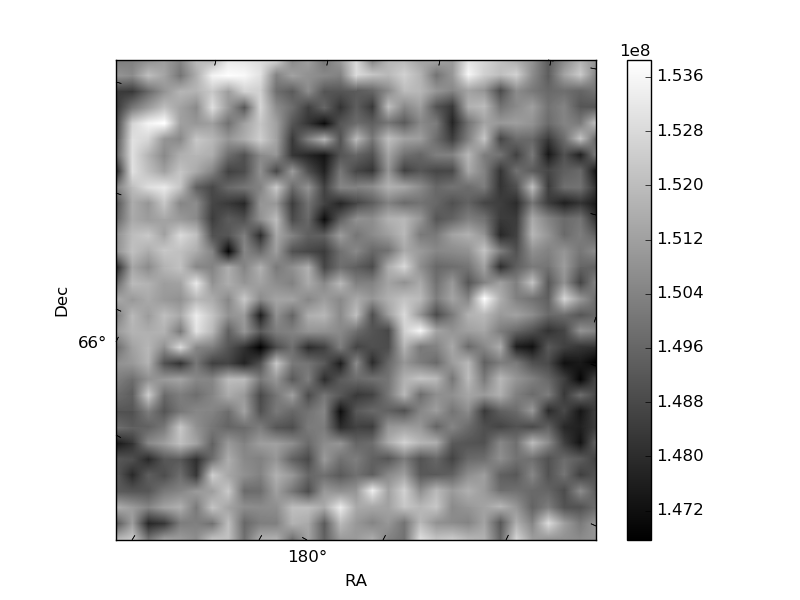
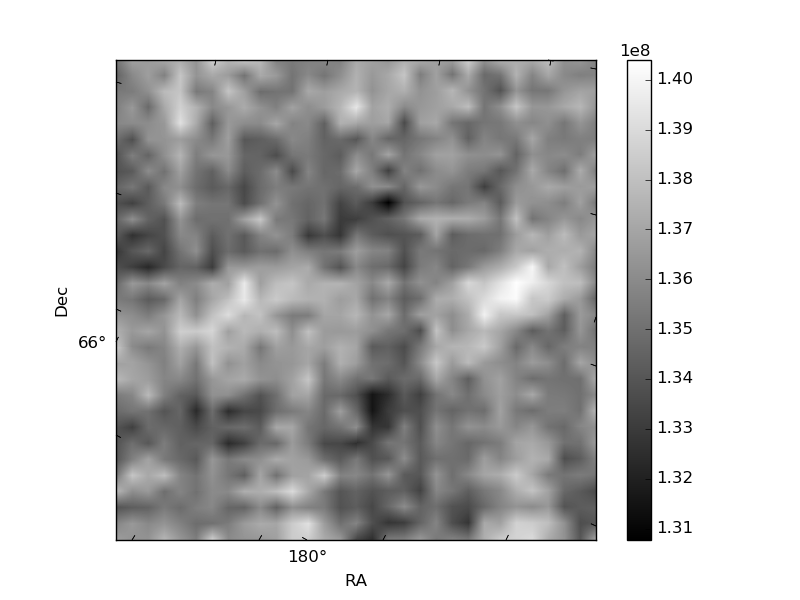
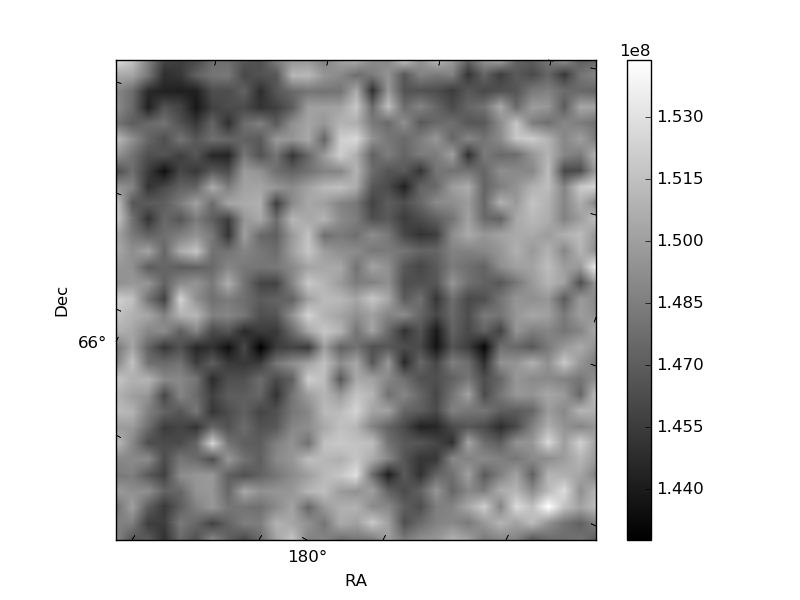
Histogram calculated using DETX and DETY for each event in the final _common_clean file
| Quadrant A | 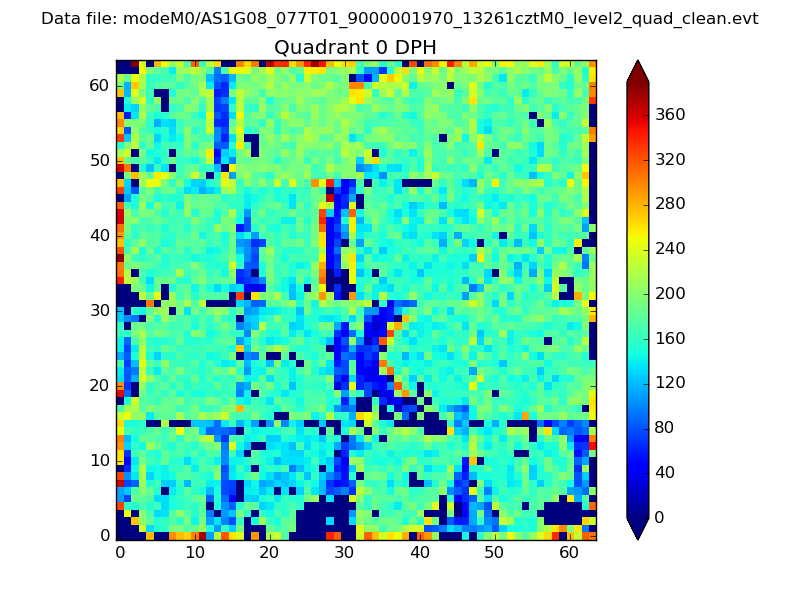 |
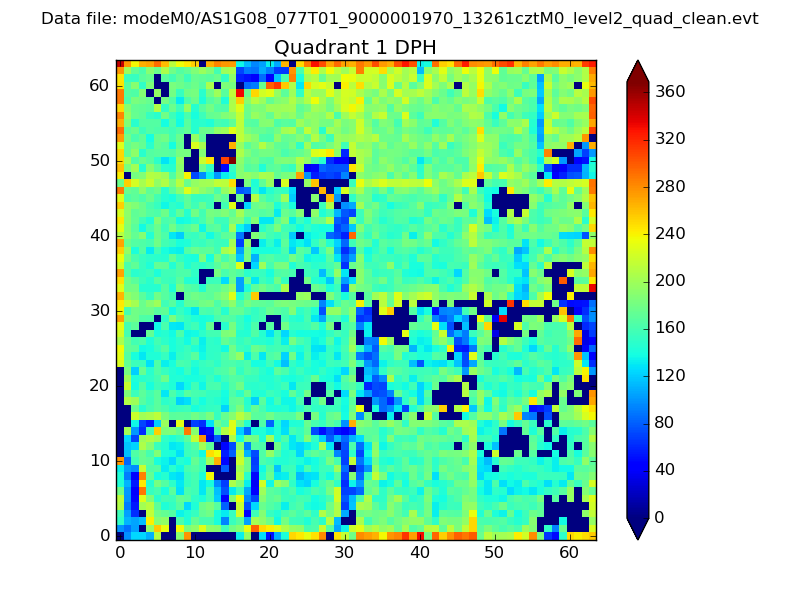 |
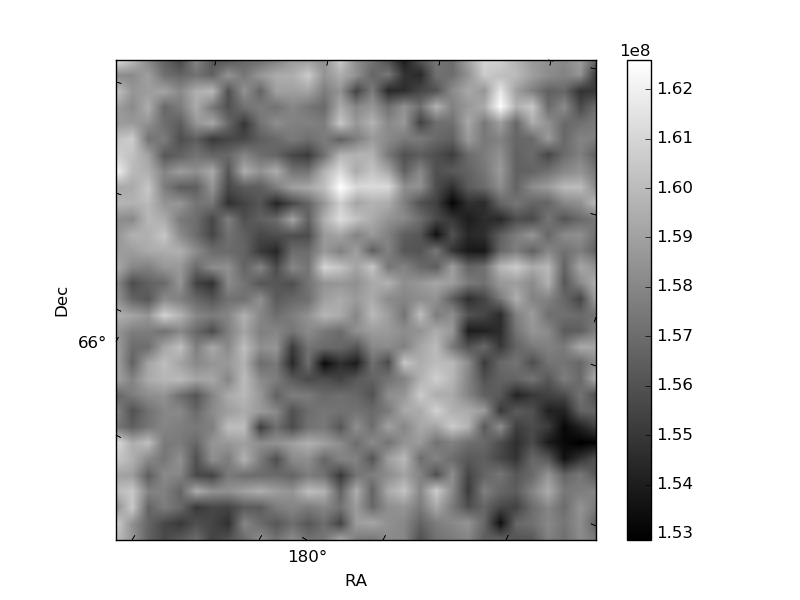
Quadrant B |
|---|---|---|---|
| Quadrant D | 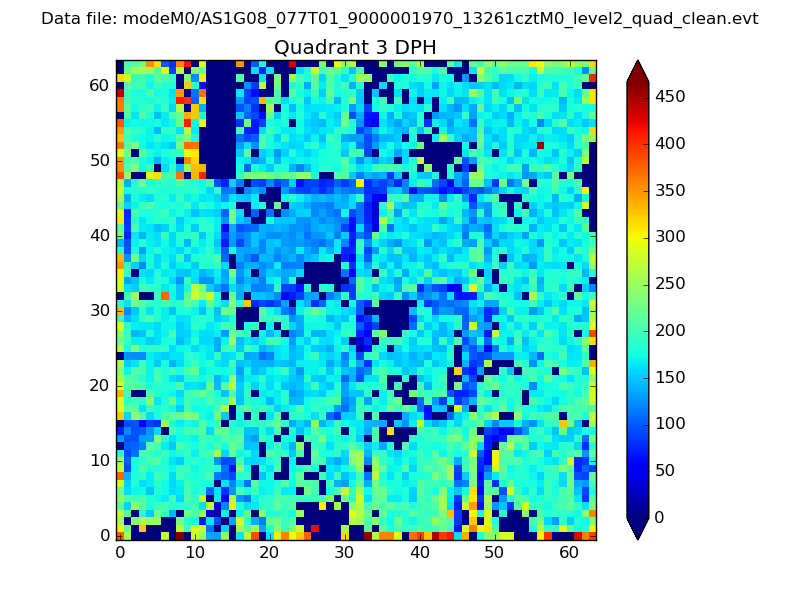 |
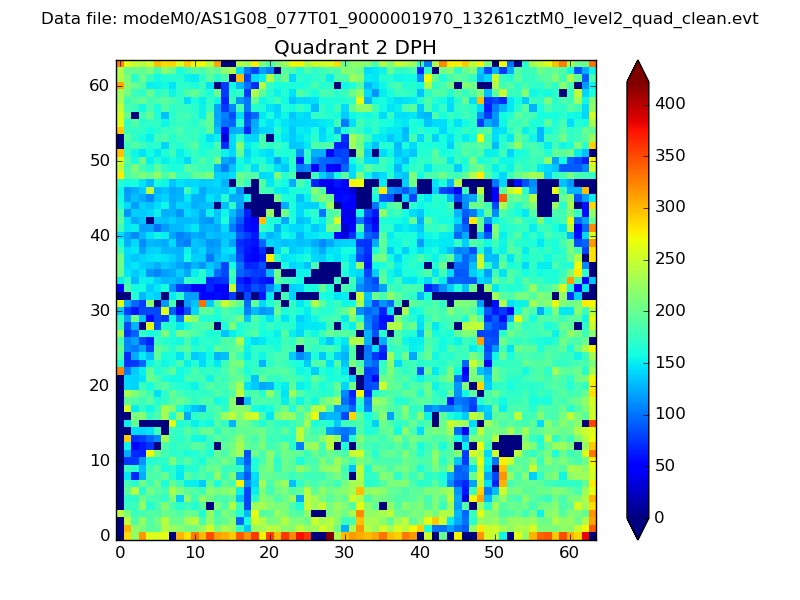 |
Quadrant C |
| Plot type | Count rate plots | Images |
|---|---|---|
| Comparison with Poisson distribution Blue bars denote a histogram of data divided into 1 sec bins. Red curve is a Poisson curve with rate = median count rate of data. |
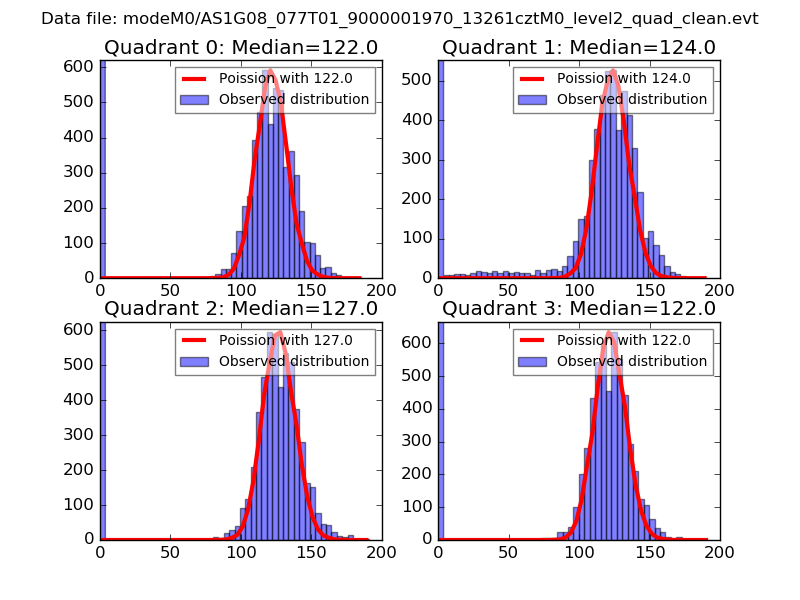 |
 |
| Quadrant-wise count rates Data is divided into 100 sec bins |
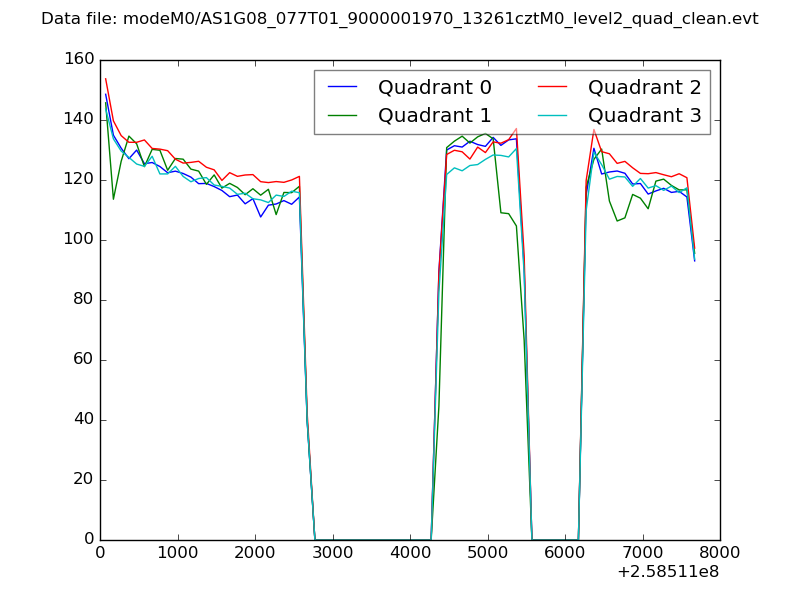 |
|
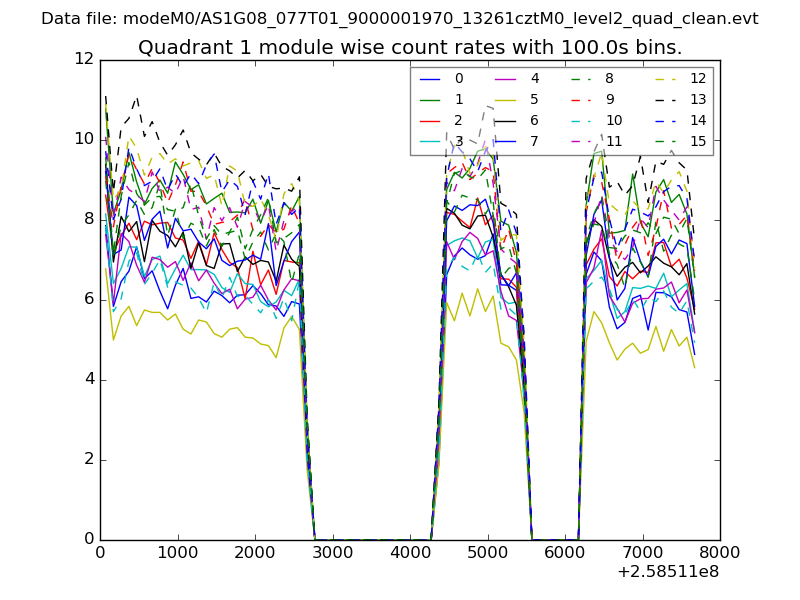
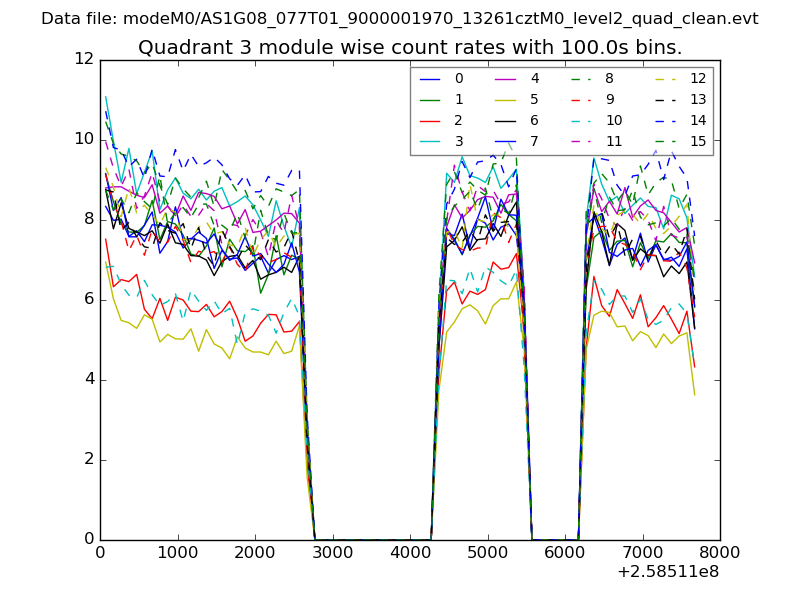
| Module-wise count rates for Quadrant A Data is divided into 100 sec bins |
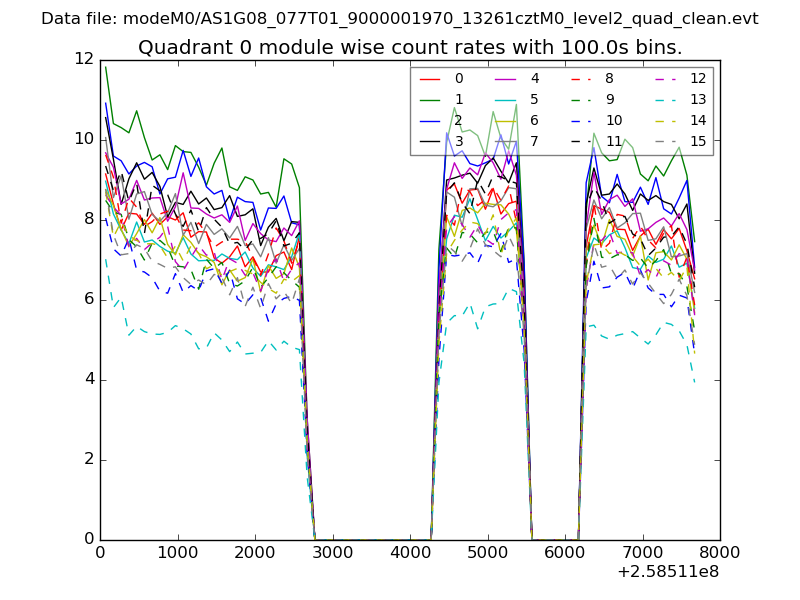 |
 |
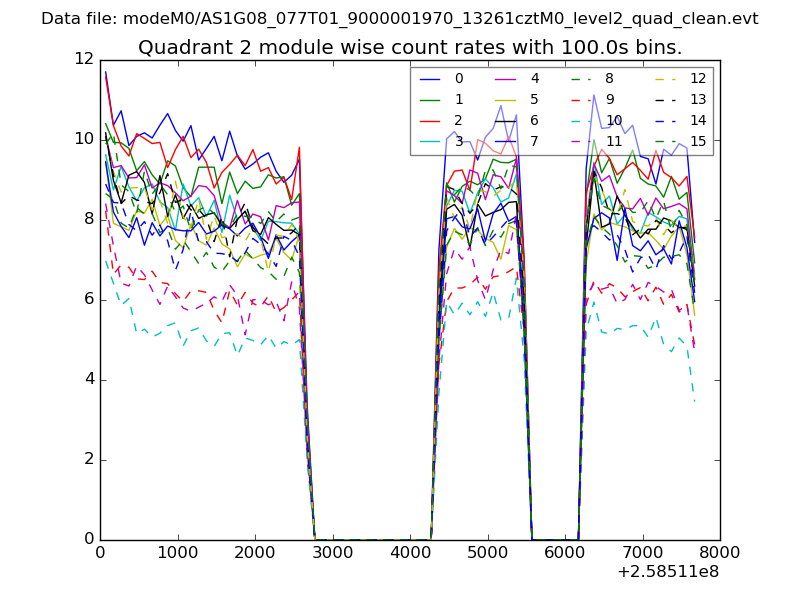
| Module-wise count rates for Quadrant B Data is divided into 100 sec bins |
 |
 |
| Module-wise count rates for Quadrant C Data is divided into 100 sec bins |
 |
 |
| Module-wise count rates for Quadrant D Data is divided into 100 sec bins |
 |
 |
| Parameter | Plot |
|---|---|
| CZT HV Monitor | 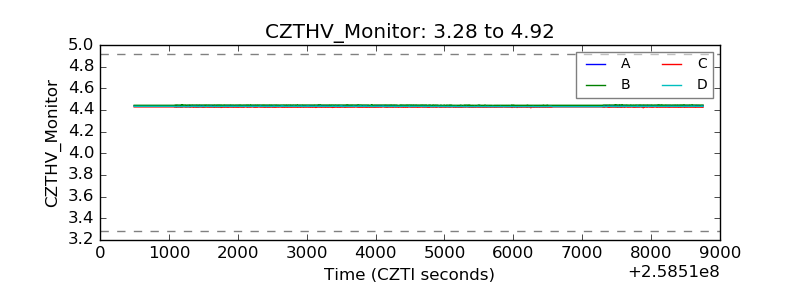 |
| D_VDD | 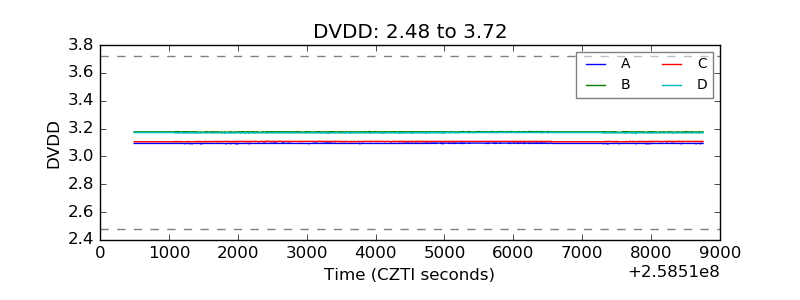 |
| Temperature 1 | 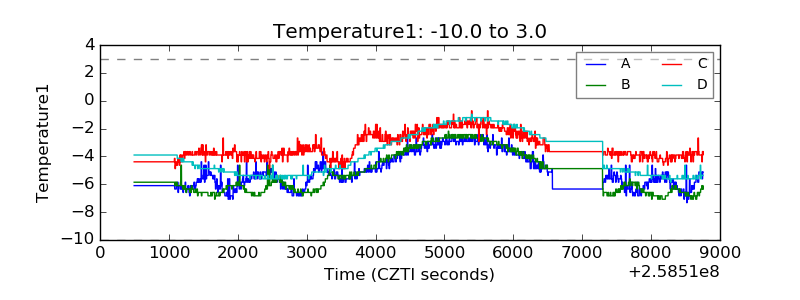 |
| Veto HV Monitor | 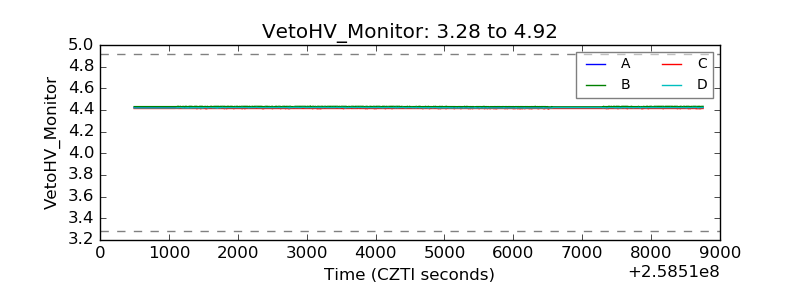 |
| Veto LLD | 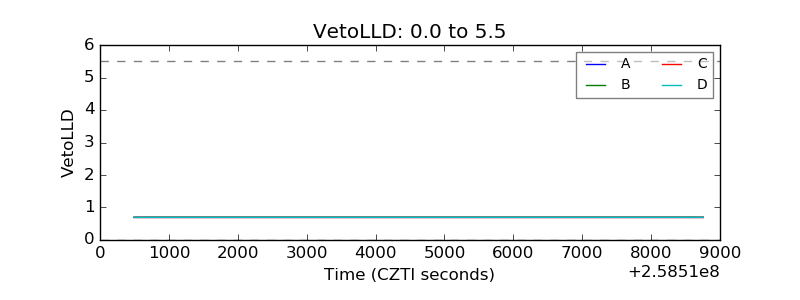 |
| Alpha Counter | 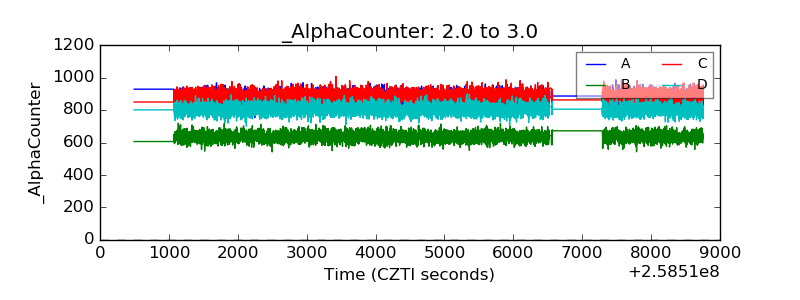 |
| _CPM_Rate | 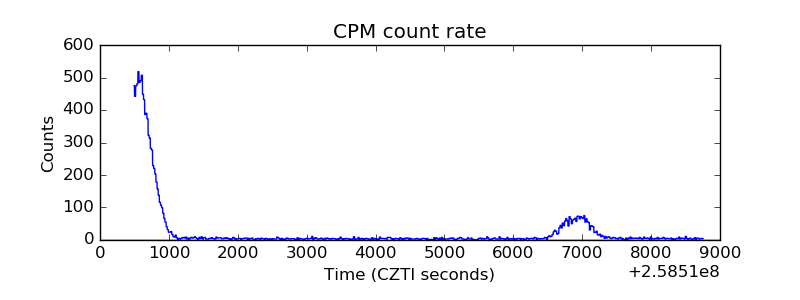 |
| CZT Counter | 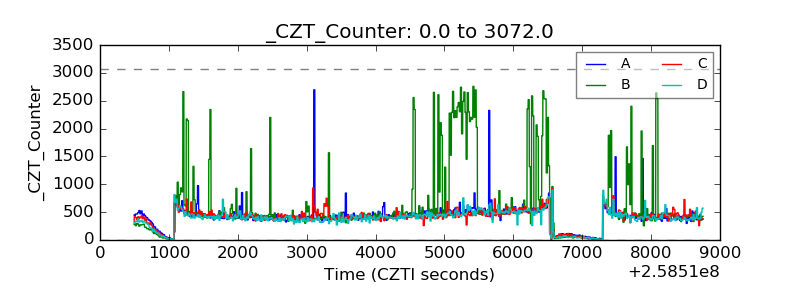 |
| +2.5 Volts monitor |  |
| +5 Volts monitor |  |
| _ROLL_ROT | 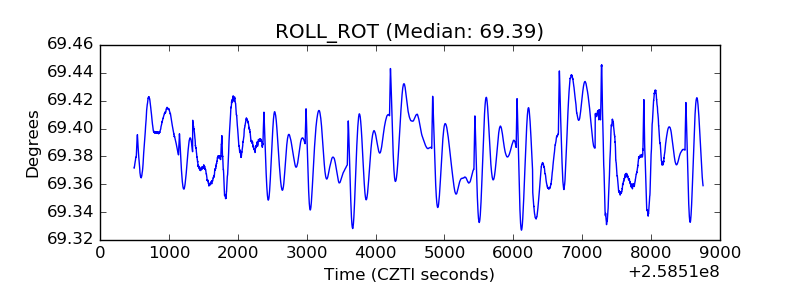 |
| _Roll_DEC | 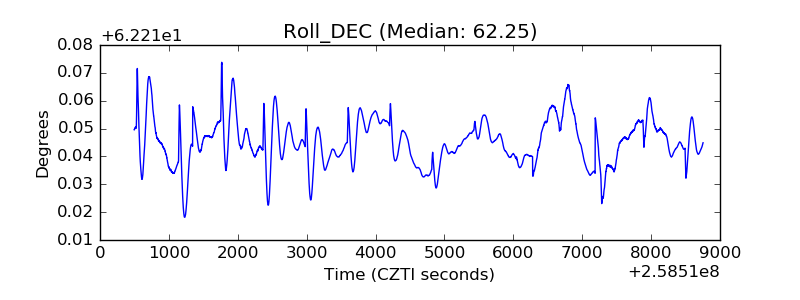 |
| _Roll_RA | 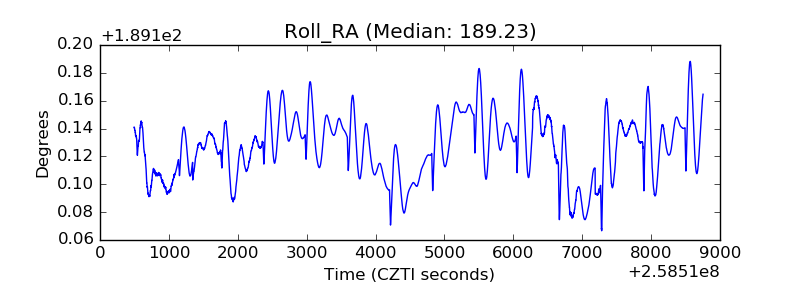 |
| Veto Counter | 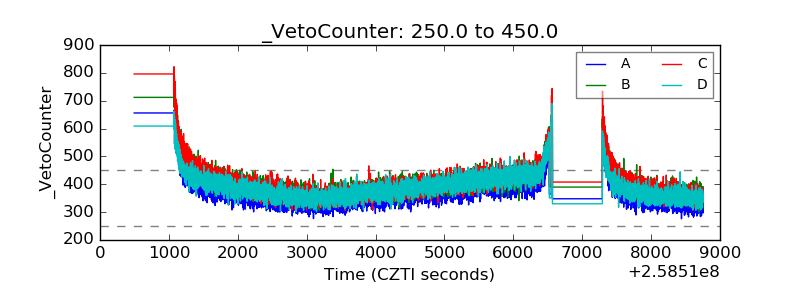 |