| Param | Original file | Final file |
|---|---|---|
| Filename | modeM0/AS1G08_077T01_9000001970_13263cztM0_level2.evt | modeM0/AS1G08_077T01_9000001970_13263cztM0_level2_quad_clean.evt |
| Size (bytes) | 793,393,920 | 96,059,520 |
| Size | 756.6 MB | 91.6 MB |
| Events in quadrant A | 10,999,034 | 400,060 |
| Events in quadrant B | 5,670,209 | 607,718 |
| Events in quadrant C | 3,430,854 | 702,253 |
| Events in quadrant D | 3,419,053 | 674,532 |
| Mode SS | |||
|---|---|---|---|
| Quadrant | BADHDUFLAG | Total packets | Discarded packets |
| A | 0 | 150 | 0 |
| B | 0 | 150 | 0 |
| C | 0 | 150 | 0 |
| D | 0 | 150 | 0 |
| Mode M0 | |||
|---|---|---|---|
| Quadrant | BADHDUFLAG | Total packets | Discarded packets |
| A | 0 | 37816 | 2 |
| B | 0 | 22109 | 1 |
| C | 0 | 15541 | 1 |
| D | 0 | 15832 | 1 |
| Quadrant | Total seconds | Saturated seconds | Saturation percentage |
|---|---|---|---|
| A | 7511 | 3351 | 44.614565% |
| B | 7511 | 1292 | 17.201438% |
| C | 7511 | 74 | 0.985222% |
| D | 7511 | 107 | 1.424577% |
Noise dominated data is calculated using 1-second bins in cleaned event files. If a bin has >2000 counts, and if more than 50% of those come from <1% of pixels, then it is considered to be noise-dominated and hence unusable.
| Quadrant | # 1 sec bins | Bins with >0 counts | Bins with >2000 counts | High rate bins dominated by noise | Noise dominated (total time) | Noise dominated (detector-on time) | Marked lightcurve |
|---|---|---|---|---|---|---|---|
| A | 7541 | 7511 | 3059 | 3059 | 40.56% | 40.73% | 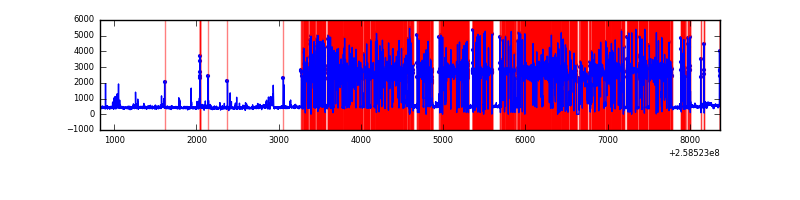 |
| B | 7542 | 7512 | 634 | 634 | 8.41% | 8.44% | 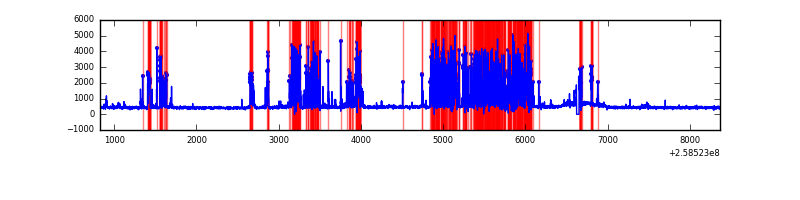 |
| C | 7542 | 7513 | 4 | 4 | 0.05% | 0.05% | 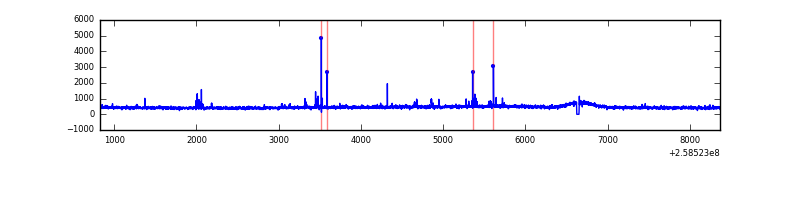 |
| D | 7542 | 7513 | 40 | 40 | 0.53% | 0.53% | 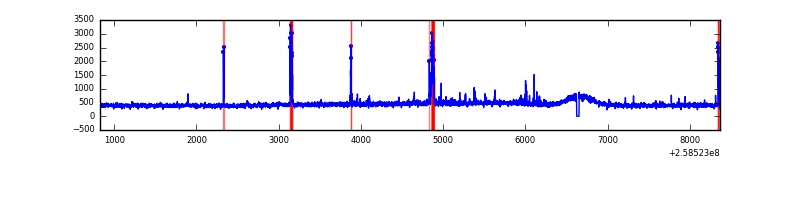 |
Top three noisy pixels from each quadrant. If the there are fewer than three noisy pixels in the level2.evt file, extra rows are filled as -1
| Pixel properties | Quadrant properties | ||||||
|---|---|---|---|---|---|---|---|
| Quadrant | DetID | PixID | Counts | Sigma | Mean | Median | Sigma |
| A | 15 | 239 | 8767374 | 75800.83 | 569 | 557 | 115.7 |
| A | 1 | 162 | 16020 | 133.7 | 569 | 557 | 115.7 |
| A | 8 | 15 | 7429 | 59.42 | 569 | 557 | 115.7 |
| B | 4 | 239 | 2616549 | 17700.18 | 770 | 750 | 147.8 |
| B | 12 | 111 | 17263 | 111.74 | 770 | 750 | 147.8 |
| B | 11 | 111 | 14540 | 93.31 | 770 | 750 | 147.8 |
| C | 3 | 233 | 59424 | 299.63 | 843 | 846 | 195.5 |
| C | 6 | 96 | 41812 | 209.54 | 843 | 846 | 195.5 |
| C | 15 | 208 | 17616 | 85.78 | 843 | 846 | 195.5 |
| D | 13 | 104 | 78553 | 387.74 | 835 | 807 | 200.5 |
| D | 5 | 222 | 70744 | 348.8 | 835 | 807 | 200.5 |
| D | 8 | 195 | 41384 | 202.37 | 835 | 807 | 200.5 |
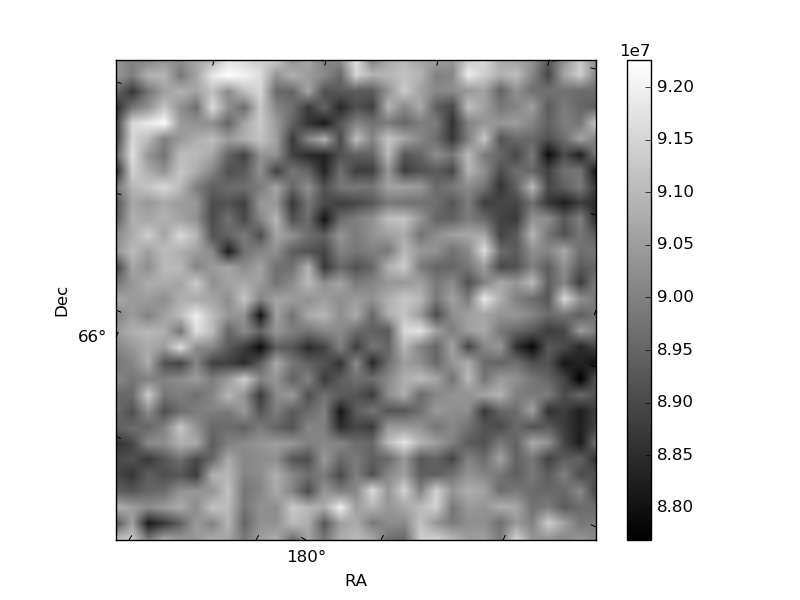
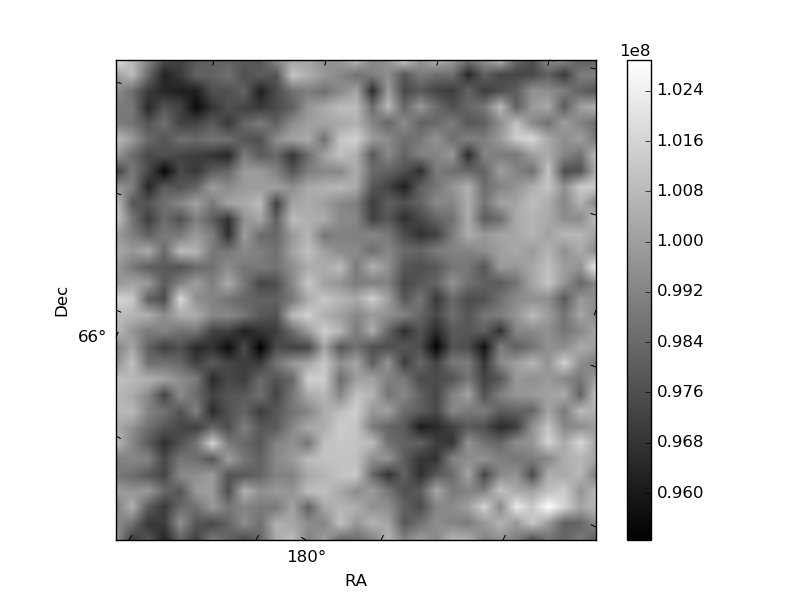
Histogram calculated using DETX and DETY for each event in the final _common_clean file
| Quadrant A | 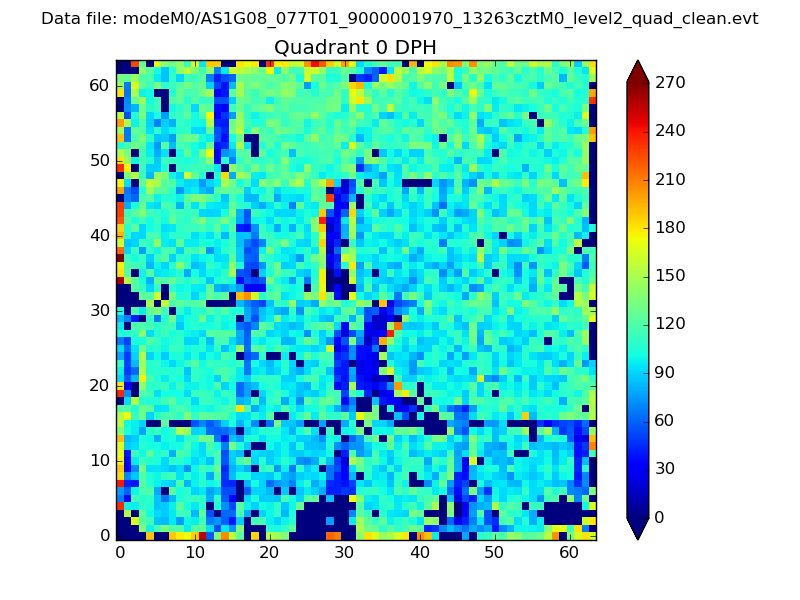 |
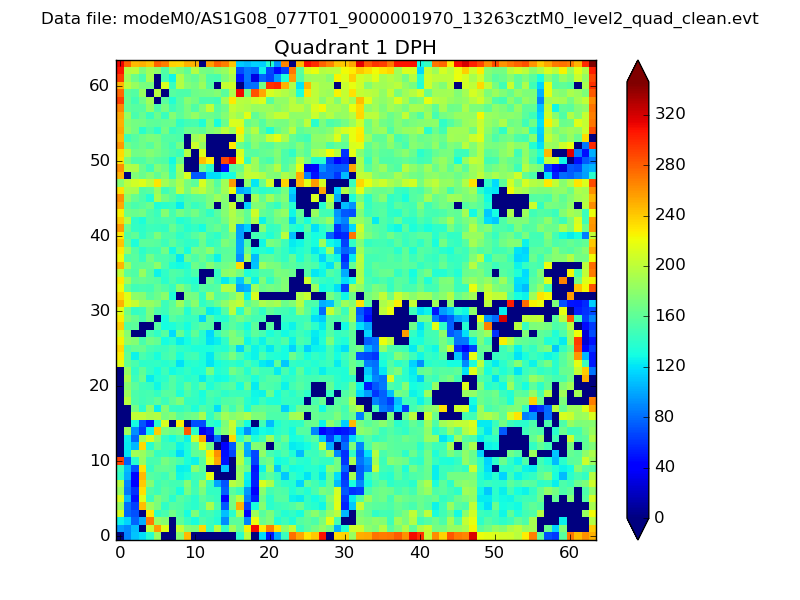 |
Quadrant B |
|---|---|---|---|
| Quadrant D | 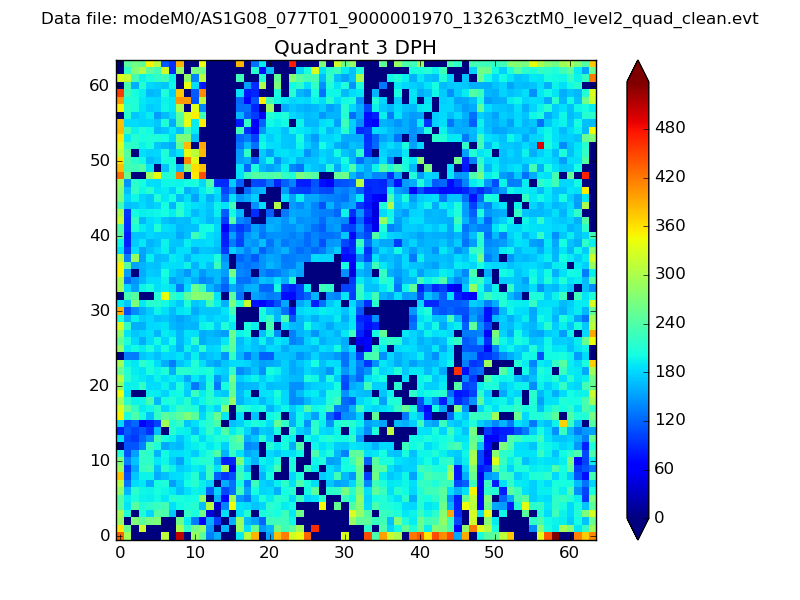 |
 |
Quadrant C |
| Plot type | Count rate plots | Images |
|---|---|---|
| Comparison with Poisson distribution Blue bars denote a histogram of data divided into 1 sec bins. Red curve is a Poisson curve with rate = median count rate of data. |
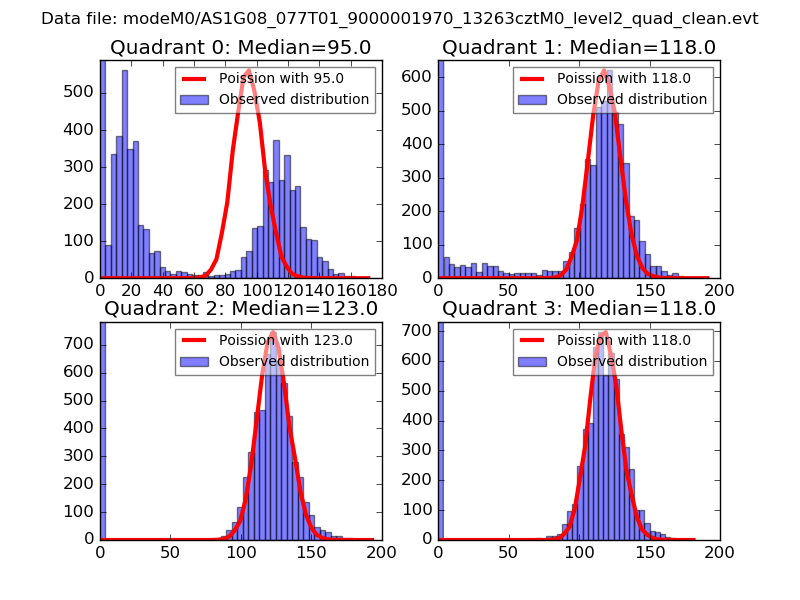 |
 |
| Quadrant-wise count rates Data is divided into 100 sec bins |
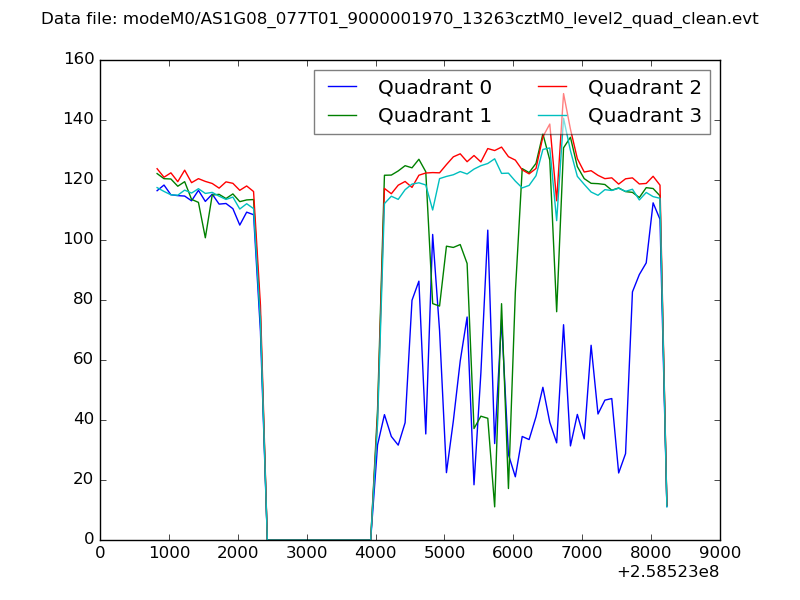 |
|
| Module-wise count rates for Quadrant A Data is divided into 100 sec bins |
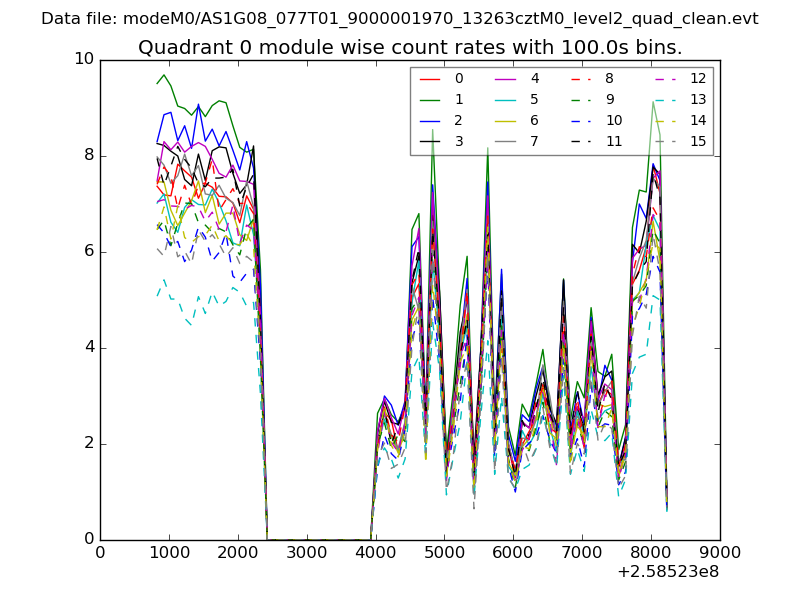 |
 |
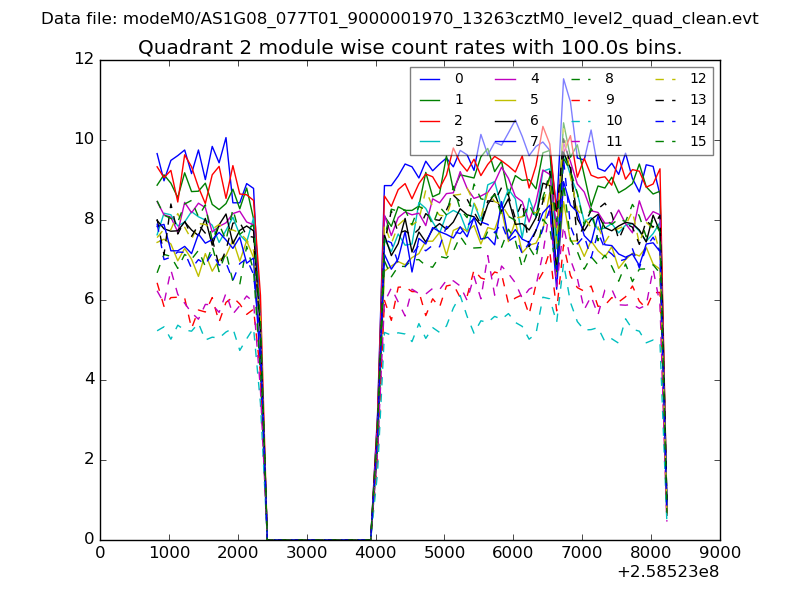
| Module-wise count rates for Quadrant B Data is divided into 100 sec bins |
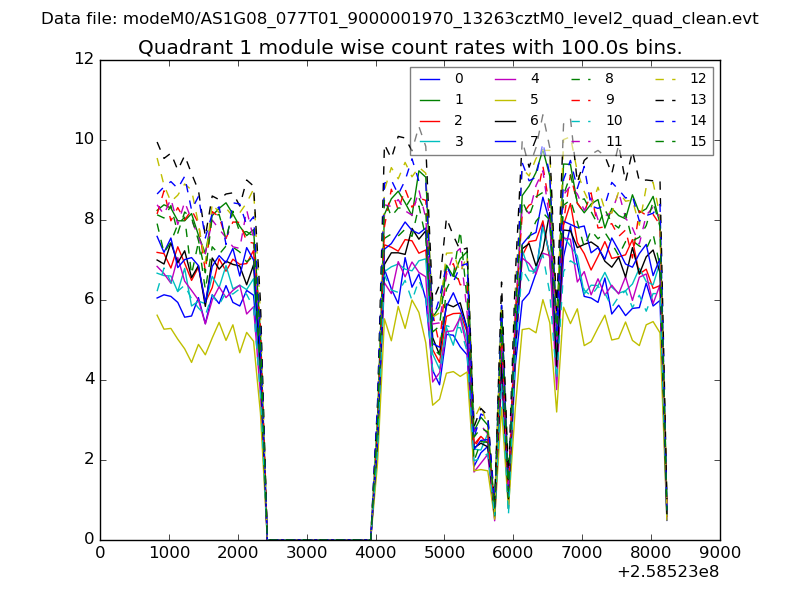 |
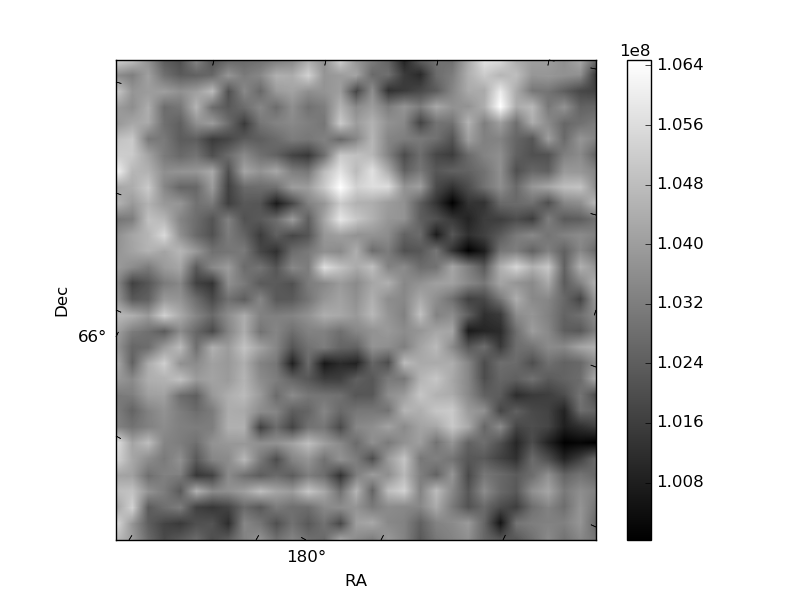 |
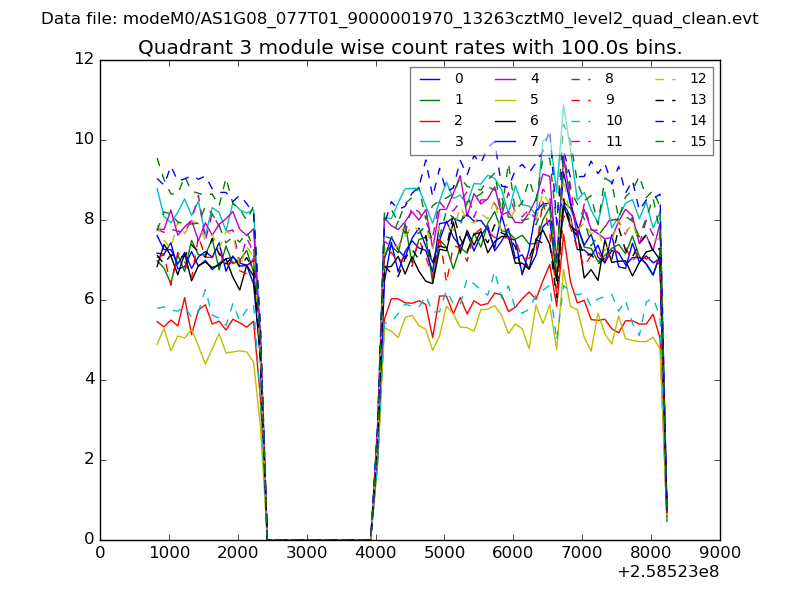
| Module-wise count rates for Quadrant C Data is divided into 100 sec bins |
 |
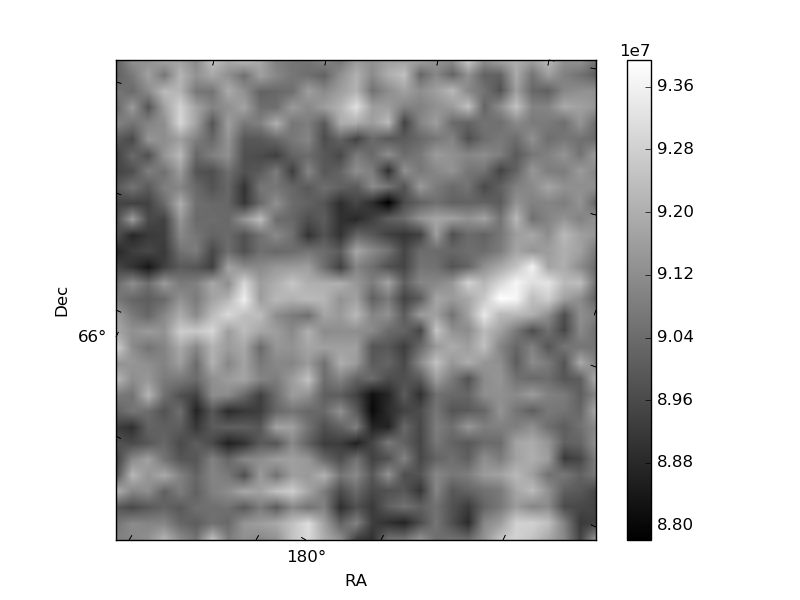 |
| Module-wise count rates for Quadrant D Data is divided into 100 sec bins |
 |
 |
| Parameter | Plot |
|---|---|
| CZT HV Monitor | 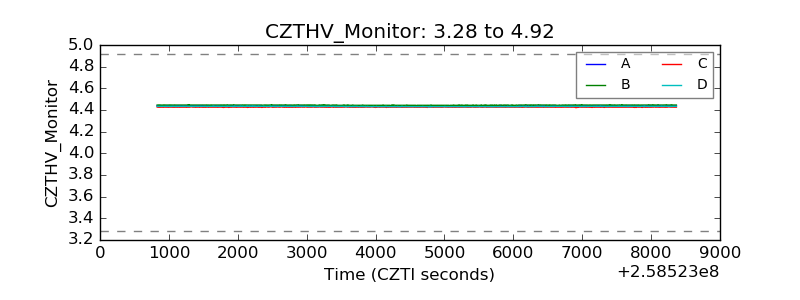 |
| D_VDD | 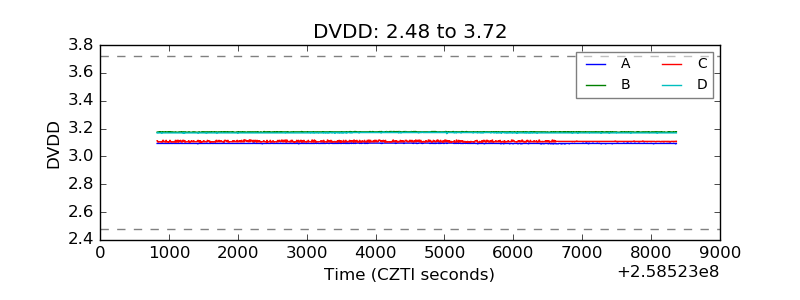 |
| Temperature 1 | 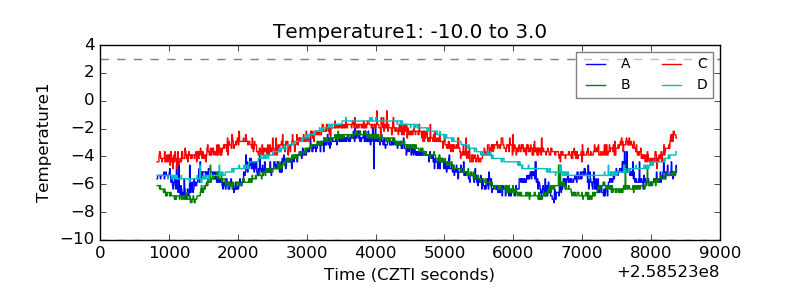 |
| Veto HV Monitor | 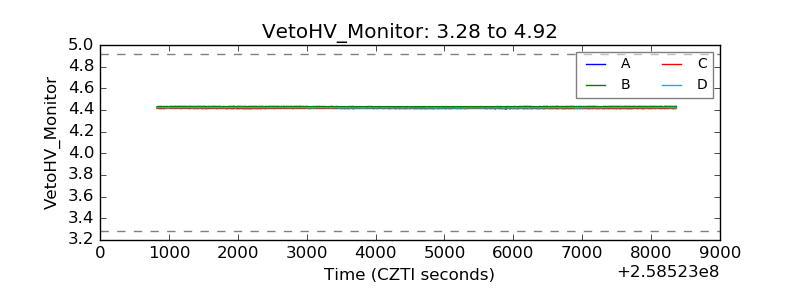 |
| Veto LLD | 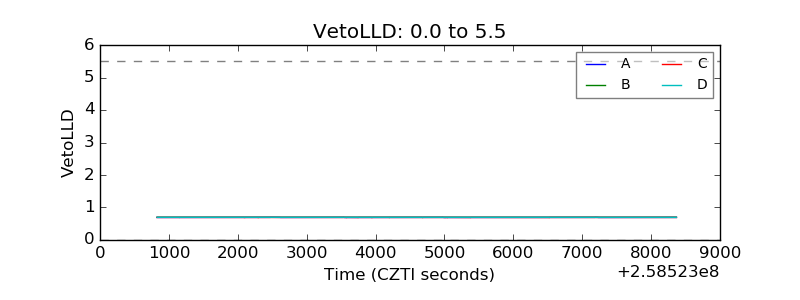 |
| Alpha Counter |  |
| _CPM_Rate | 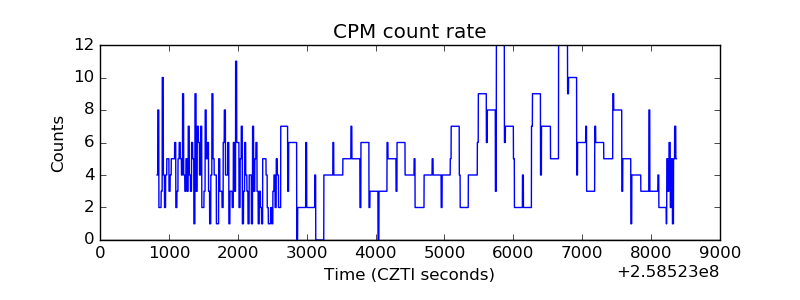 |
| CZT Counter |  |
| +2.5 Volts monitor |  |
| +5 Volts monitor |  |
| _ROLL_ROT | 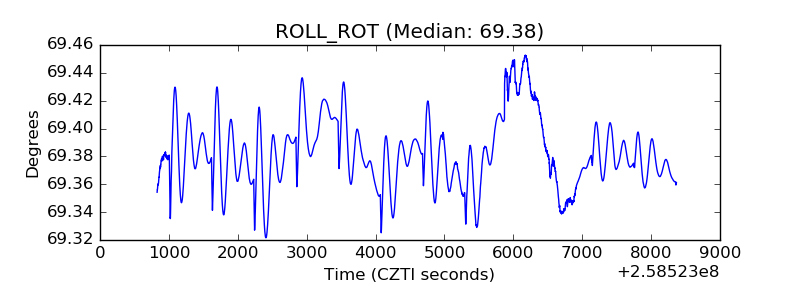 |
| _Roll_DEC | 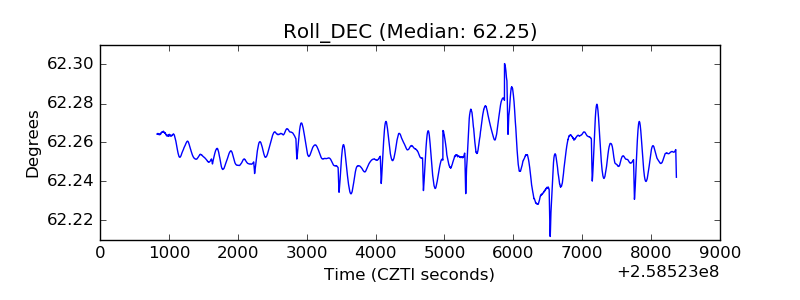 |
| _Roll_RA |  |
| Veto Counter | 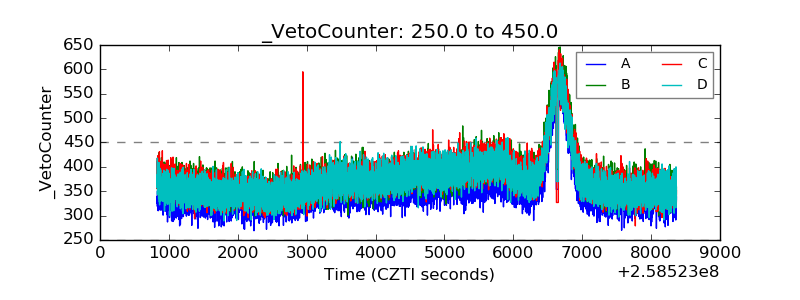 |