| Param | Original file | Final file |
|---|---|---|
| Filename | modeM0/AS1G08_077T01_9000001970_13266cztM0_level2.evt | modeM0/AS1G08_077T01_9000001970_13266cztM0_level2_quad_clean.evt |
| Size (bytes) | 944,524,800 | 102,360,960 |
| Size | 900.8 MB | 97.6 MB |
| Events in quadrant A | 8,839,514 | 666,939 |
| Events in quadrant B | 10,567,955 | 376,450 |
| Events in quadrant C | 4,143,906 | 718,253 |
| Events in quadrant D | 4,420,045 | 686,869 |
| Mode M9 | |||
|---|---|---|---|
| Quadrant | BADHDUFLAG | Total packets | Discarded packets |
| A | 0 | 5 | 0 |
| B | 0 | 5 | 0 |
| C | 0 | 5 | 0 |
| D | 0 | 6 | 0 |
| Mode SS | |||
|---|---|---|---|
| Quadrant | BADHDUFLAG | Total packets | Discarded packets |
| A | 0 | 188 | 0 |
| B | 0 | 188 | 0 |
| C | 0 | 188 | 0 |
| D | 0 | 188 | 0 |
| Mode M0 | |||
|---|---|---|---|
| Quadrant | BADHDUFLAG | Total packets | Discarded packets |
| A | 0 | 32565 | 2 |
| B | 0 | 37623 | 2 |
| C | 0 | 19037 | 2 |
| D | 0 | 19952 | 2 |
| Quadrant | Total seconds | Saturated seconds | Saturation percentage |
|---|---|---|---|
| A | 9365 | 1014 | 10.827549% |
| B | 9365 | 3772 | 40.277629% |
| C | 9365 | 69 | 0.736786% |
| D | 9365 | 126 | 1.345435% |
Noise dominated data is calculated using 1-second bins in cleaned event files. If a bin has >2000 counts, and if more than 50% of those come from <1% of pixels, then it is considered to be noise-dominated and hence unusable.
| Quadrant | # 1 sec bins | Bins with >0 counts | Bins with >2000 counts | High rate bins dominated by noise | Noise dominated (total time) | Noise dominated (detector-on time) | Marked lightcurve |
|---|---|---|---|---|---|---|---|
| A | 9881 | 9367 | 678 | 678 | 6.86% | 7.24% | 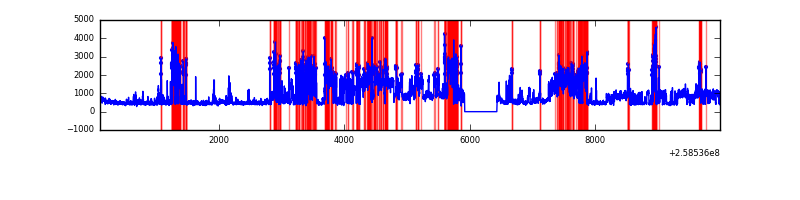 |
| B | 9881 | 9365 | 2061 | 2061 | 20.86% | 22.01% | 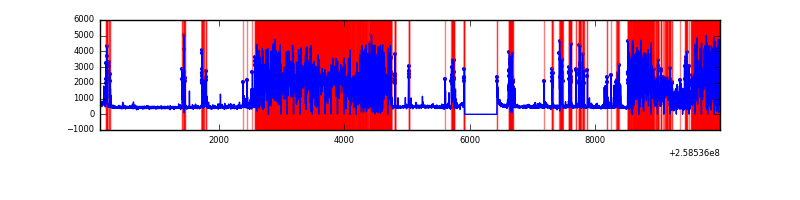 |
| C | 9881 | 9367 | 3 | 3 | 0.03% | 0.03% | 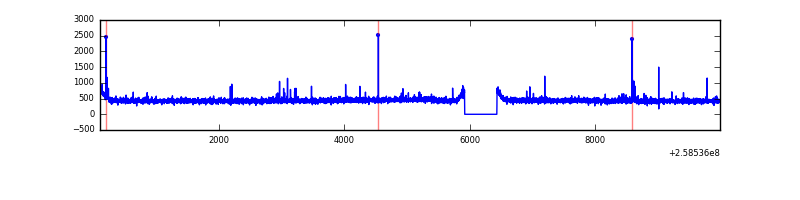 |
| D | 9881 | 9367 | 59 | 59 | 0.60% | 0.63% | 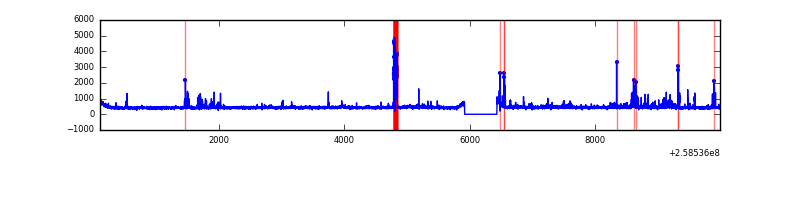 |
Top three noisy pixels from each quadrant. If the there are fewer than three noisy pixels in the level2.evt file, extra rows are filled as -1
| Pixel properties | Quadrant properties | ||||||
|---|---|---|---|---|---|---|---|
| Quadrant | DetID | PixID | Counts | Sigma | Mean | Median | Sigma |
| A | 15 | 239 | 4749009 | 22473.88 | 1039 | 1015 | 211.3 |
| A | 1 | 162 | 35009 | 160.91 | 1039 | 1015 | 211.3 |
| A | 8 | 15 | 29226 | 133.53 | 1039 | 1015 | 211.3 |
| B | 4 | 239 | 7539047 | 51836.93 | 749 | 729 | 145.4 |
| B | 0 | 214 | 39517 | 266.72 | 749 | 729 | 145.4 |
| B | 4 | 142 | 28030 | 187.73 | 749 | 729 | 145.4 |
| C | 15 | 208 | 31815 | 127.35 | 1046 | 1050 | 241.6 |
| C | 6 | 96 | 13009 | 49.5 | 1046 | 1050 | 241.6 |
| C | 8 | 128 | 9075 | 33.22 | 1046 | 1050 | 241.6 |
| D | 1 | 52 | 389858 | 1553.31 | 1038 | 1008 | 250.3 |
| D | 5 | 222 | 61834 | 242.98 | 1038 | 1008 | 250.3 |
| D | 2 | 234 | 37312 | 145.02 | 1038 | 1008 | 250.3 |
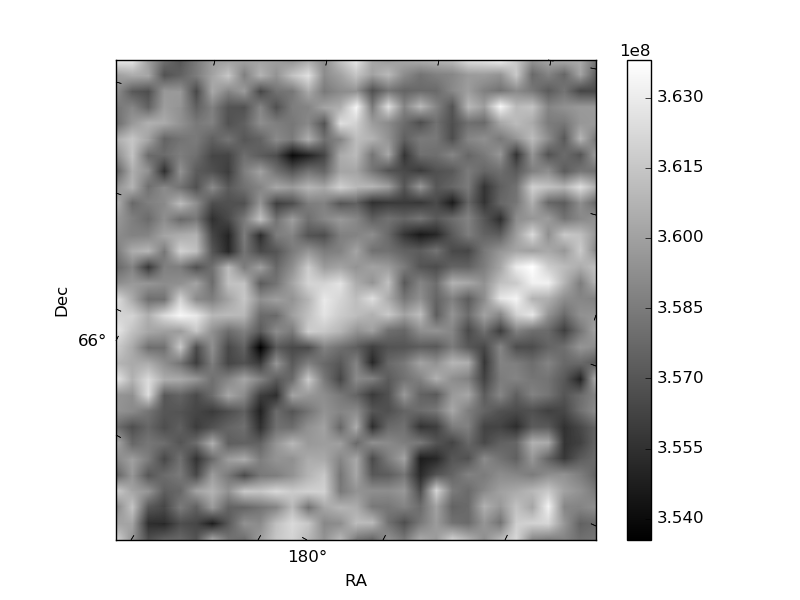
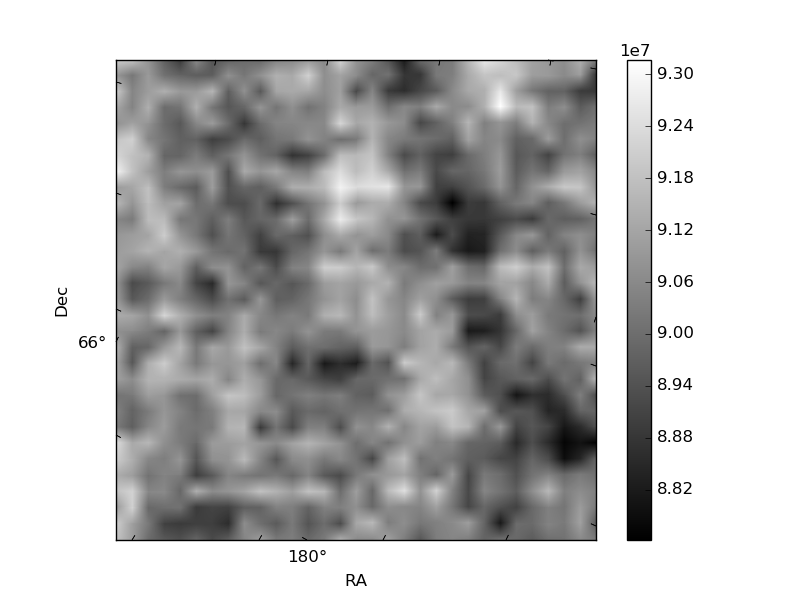
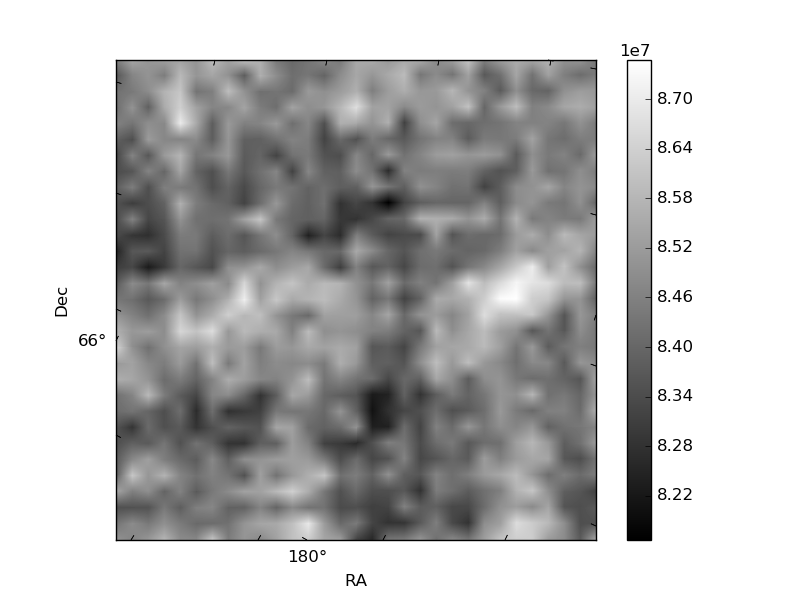
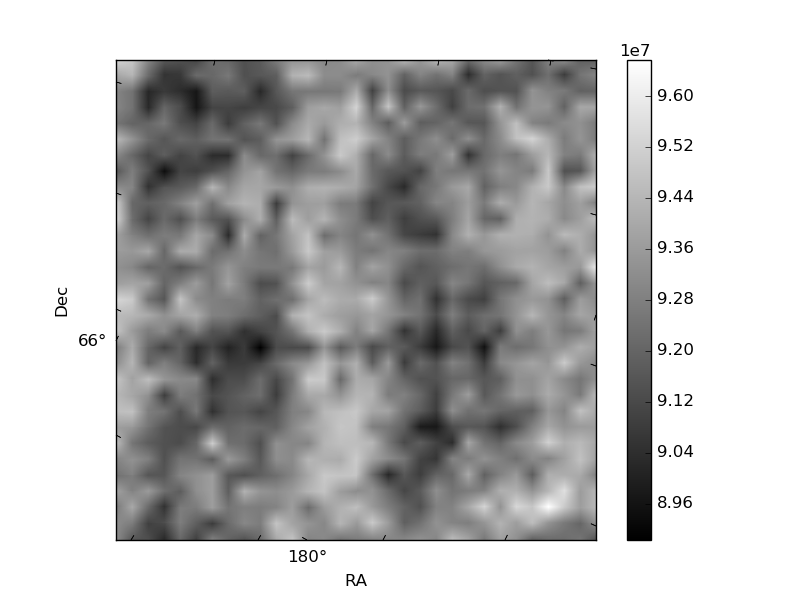
Histogram calculated using DETX and DETY for each event in the final _common_clean file
| Quadrant A | 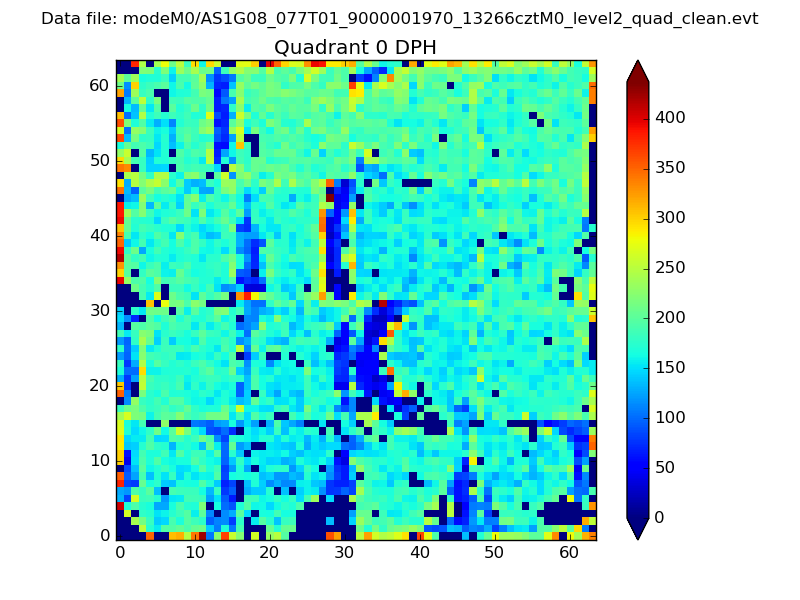 |
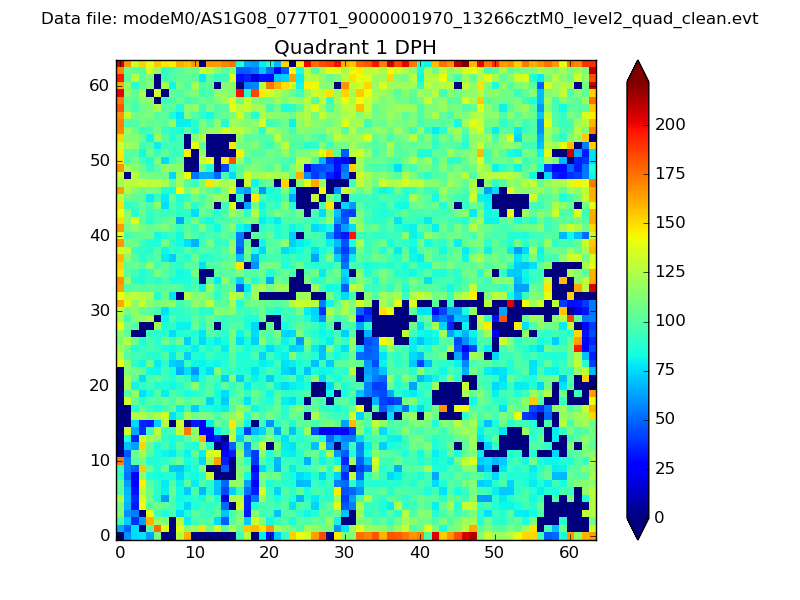 |
Quadrant B |
|---|---|---|---|
| Quadrant D | 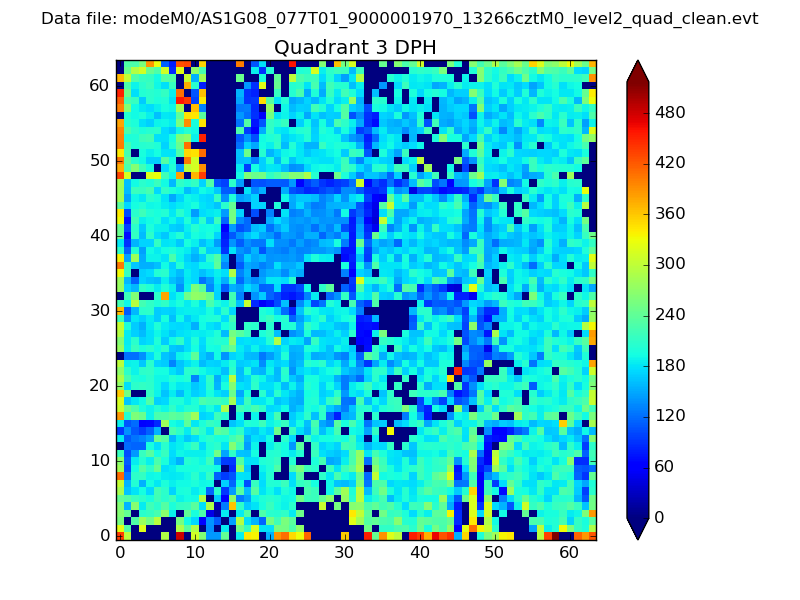 |
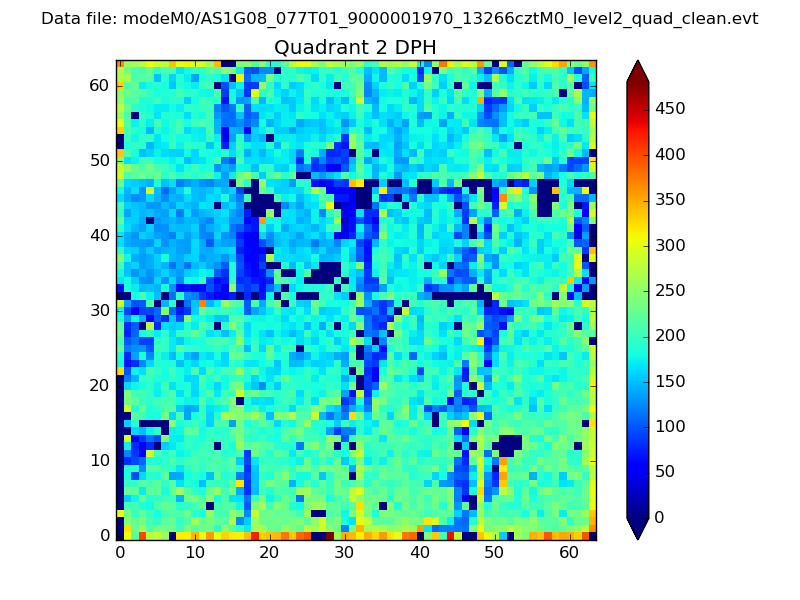 |
Quadrant C |
| Plot type | Count rate plots | Images |
|---|---|---|
| Comparison with Poisson distribution Blue bars denote a histogram of data divided into 1 sec bins. Red curve is a Poisson curve with rate = median count rate of data. |
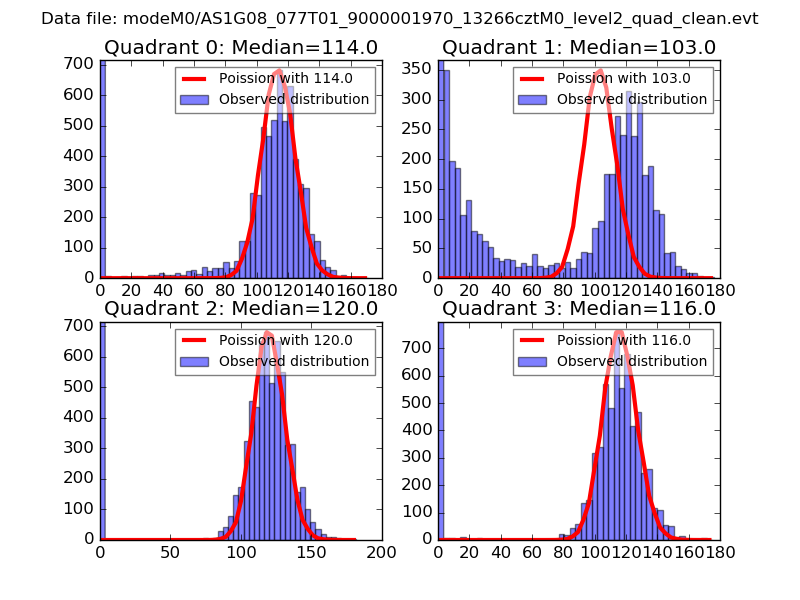 |
 |
| Quadrant-wise count rates Data is divided into 100 sec bins |
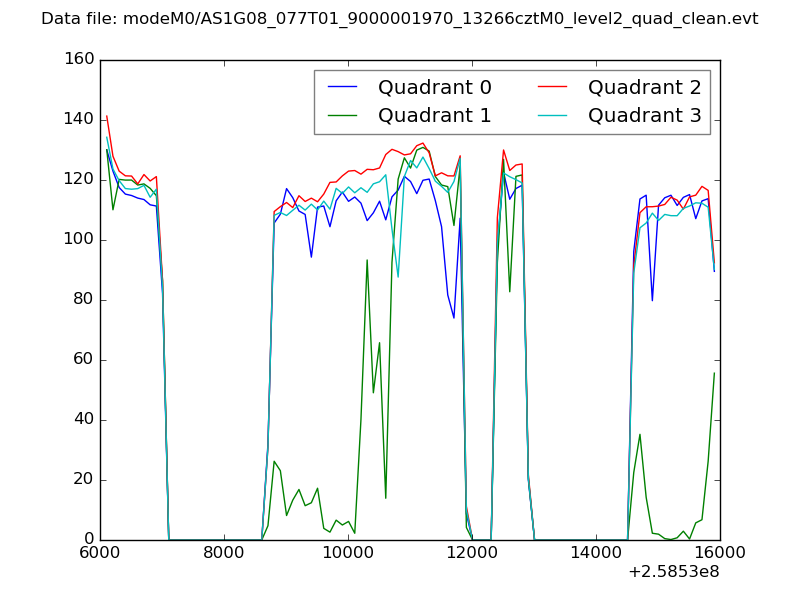 |
|
| Module-wise count rates for Quadrant A Data is divided into 100 sec bins |
 |
 |
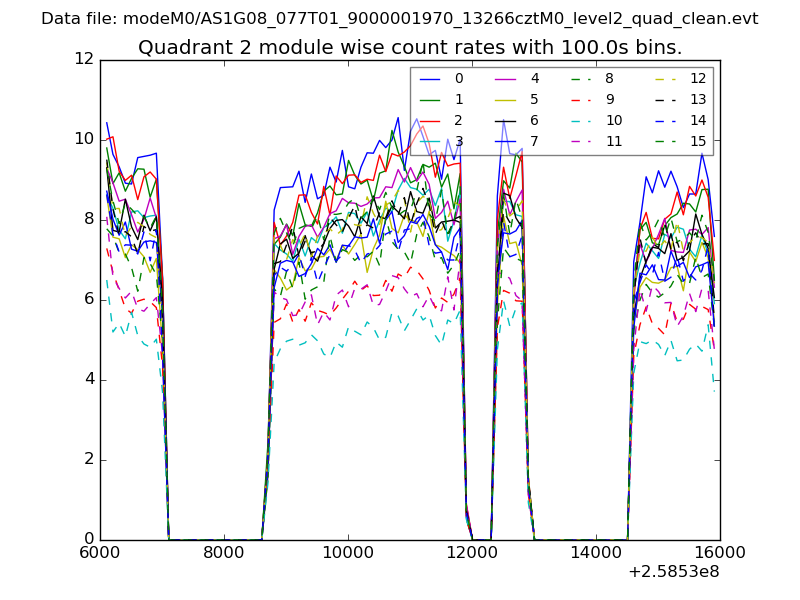
| Module-wise count rates for Quadrant B Data is divided into 100 sec bins |
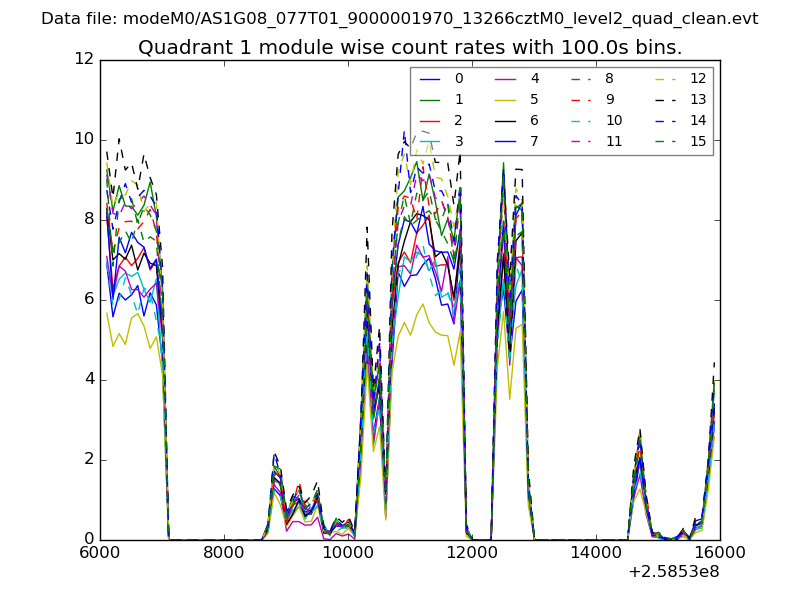 |
 |
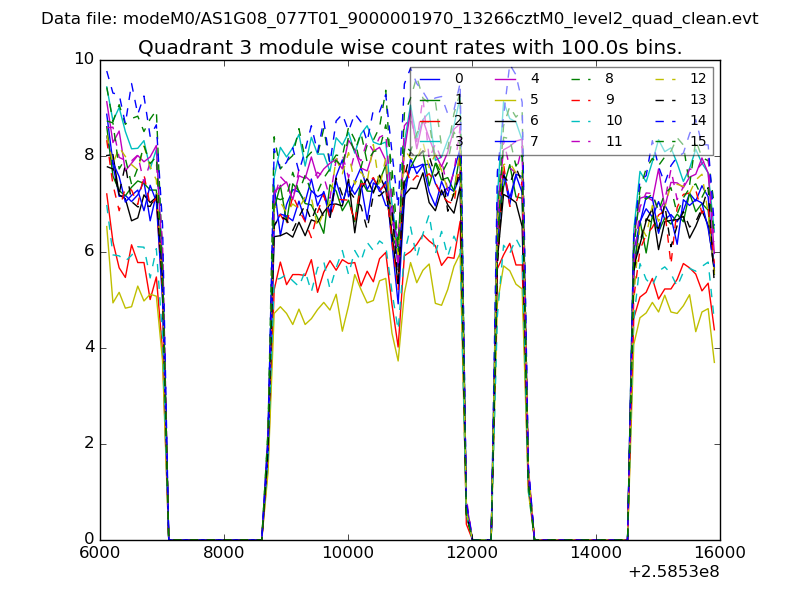
| Module-wise count rates for Quadrant C Data is divided into 100 sec bins |
 |
 |
| Module-wise count rates for Quadrant D Data is divided into 100 sec bins |
 |
 |
| Parameter | Plot |
|---|---|
| CZT HV Monitor | 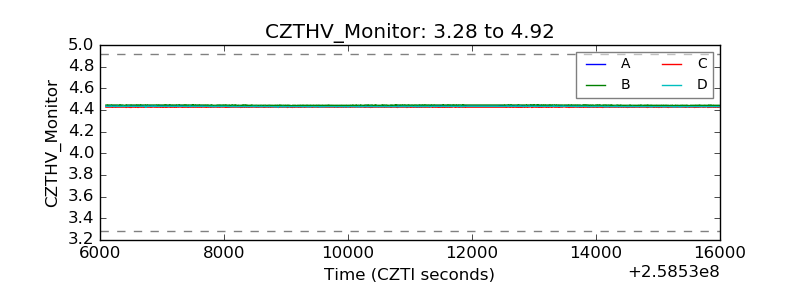 |
| D_VDD |  |
| Temperature 1 | 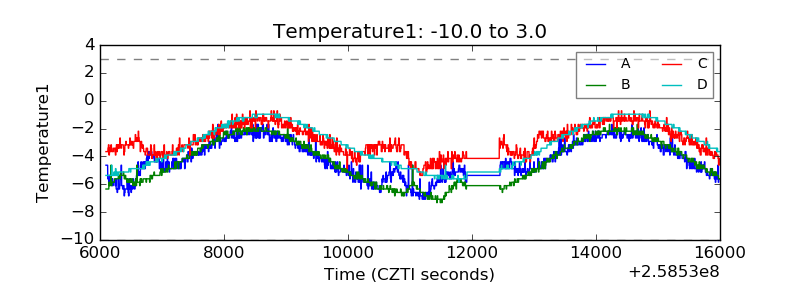 |
| Veto HV Monitor | 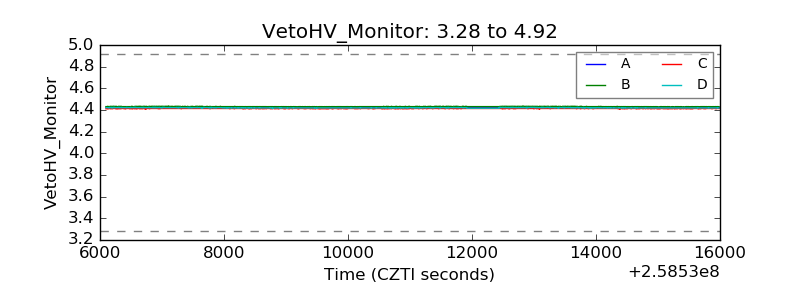 |
| Veto LLD |  |
| Alpha Counter | 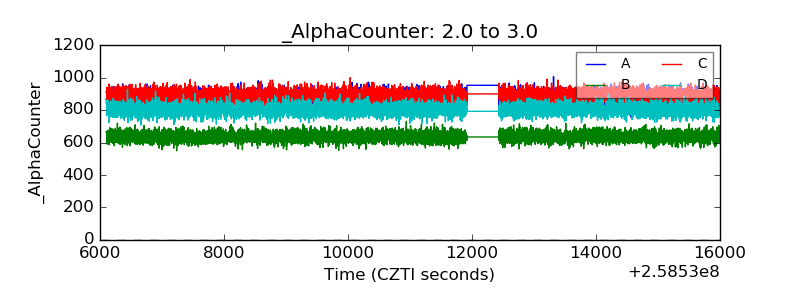 |
| _CPM_Rate | 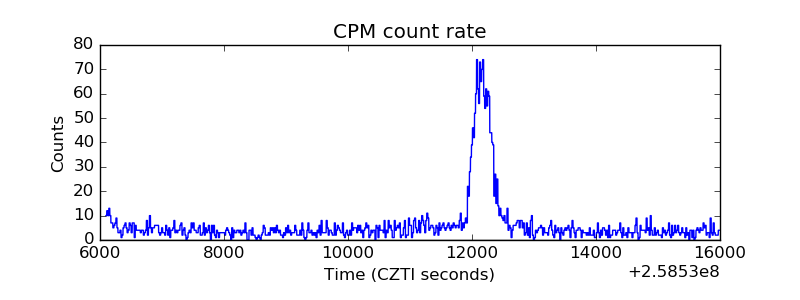 |
| CZT Counter | 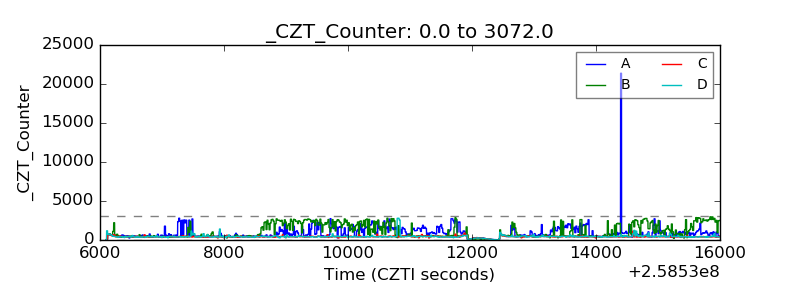 |
| +2.5 Volts monitor | 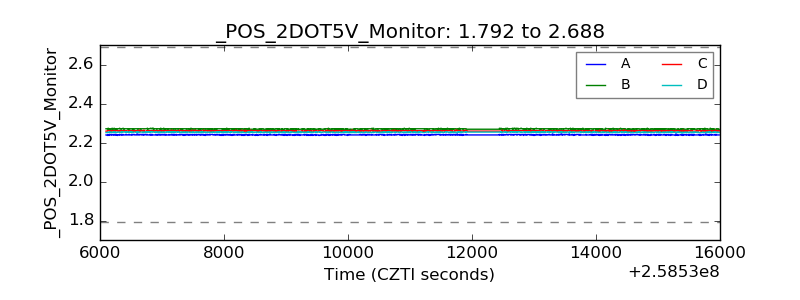 |
| +5 Volts monitor |  |
| _ROLL_ROT | 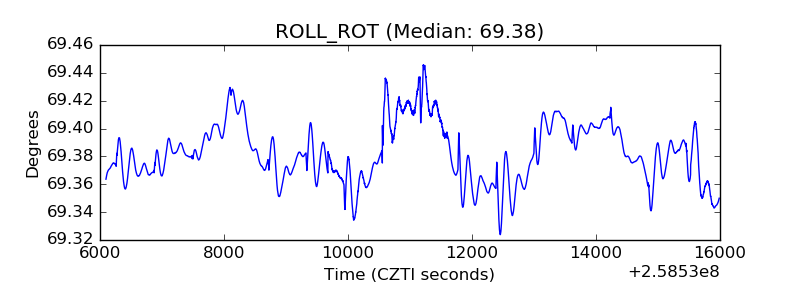 |
| _Roll_DEC | 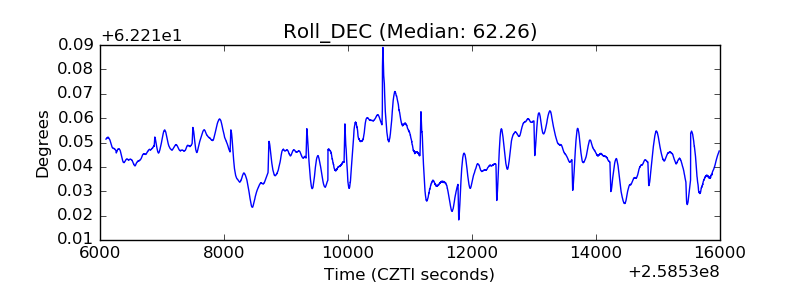 |
| _Roll_RA | 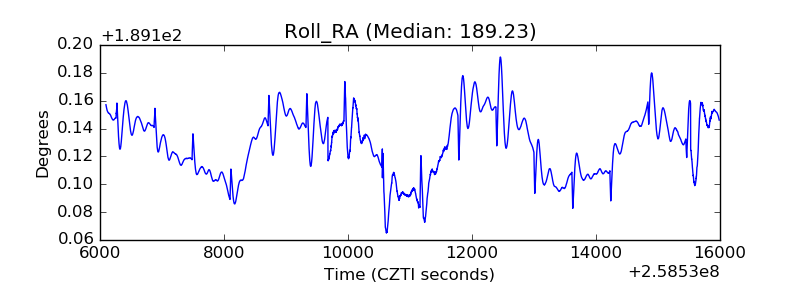 |
| Veto Counter | 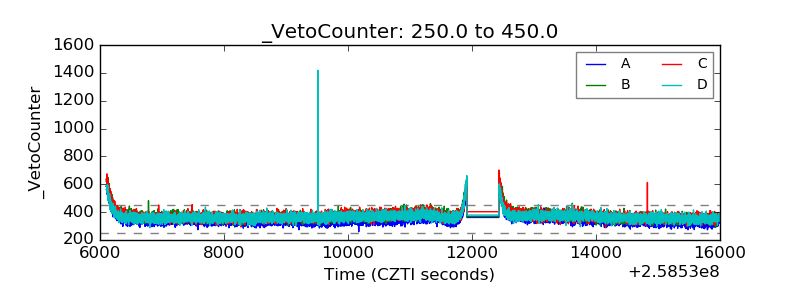 |