| Param | Original file | Final file |
|---|---|---|
| Filename | modeM0/AS1A04_167T02_9000001974_13272cztM0_level2.evt | modeM0/AS1A04_167T02_9000001974_13272cztM0_level2_quad_clean.evt |
| Size (bytes) | 342,679,680 | 63,455,040 |
| Size | 326.8 MB | 60.5 MB |
| Events in quadrant A | 3,338,101 | 404,495 |
| Events in quadrant B | 2,424,489 | 421,083 |
| Events in quadrant C | 1,951,976 | 425,886 |
| Events in quadrant D | 2,402,783 | 399,657 |
| Mode SS | |||
|---|---|---|---|
| Quadrant | BADHDUFLAG | Total packets | Discarded packets |
| A | 0 | 78 | 0 |
| B | 0 | 78 | 0 |
| C | 0 | 78 | 0 |
| D | 0 | 78 | 0 |
| Mode M0 | |||
|---|---|---|---|
| Quadrant | BADHDUFLAG | Total packets | Discarded packets |
| A | 0 | 12694 | 2 |
| B | 0 | 9770 | 1 |
| C | 0 | 8292 | 1 |
| D | 0 | 9596 | 1 |
| Mode M9 | |||
|---|---|---|---|
| Quadrant | BADHDUFLAG | Total packets | Discarded packets |
| A | 0 | 14 | 0 |
| B | 0 | 14 | 0 |
| C | 0 | 14 | 0 |
| D | 0 | 14 | 0 |
| Quadrant | Total seconds | Saturated seconds | Saturation percentage |
|---|---|---|---|
| A | 3829 | 216 | 5.641160% |
| B | 3829 | 159 | 4.152520% |
| C | 3829 | 45 | 1.175242% |
| D | 3829 | 169 | 4.413685% |
Noise dominated data is calculated using 1-second bins in cleaned event files. If a bin has >2000 counts, and if more than 50% of those come from <1% of pixels, then it is considered to be noise-dominated and hence unusable.
| Quadrant | # 1 sec bins | Bins with >0 counts | Bins with >2000 counts | High rate bins dominated by noise | Noise dominated (total time) | Noise dominated (detector-on time) | Marked lightcurve |
|---|---|---|---|---|---|---|---|
| A | 5195 | 3831 | 155 | 155 | 2.98% | 4.05% | 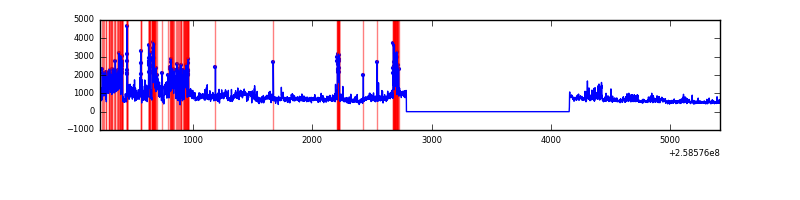 |
| B | 5195 | 3831 | 61 | 61 | 1.17% | 1.59% | 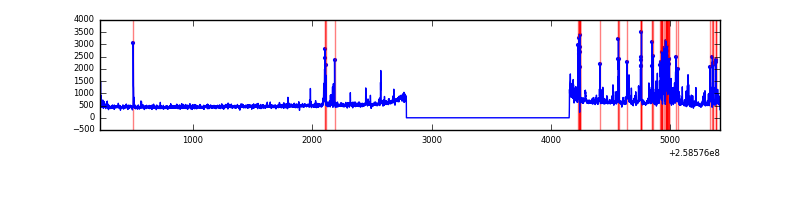 |
| C | 5195 | 3831 | 1 | 1 | 0.02% | 0.03% | 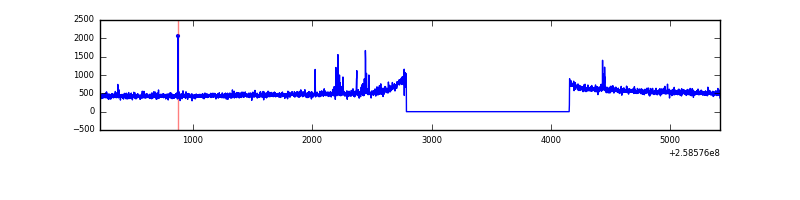 |
| D | 5195 | 3831 | 142 | 142 | 2.73% | 3.71% | 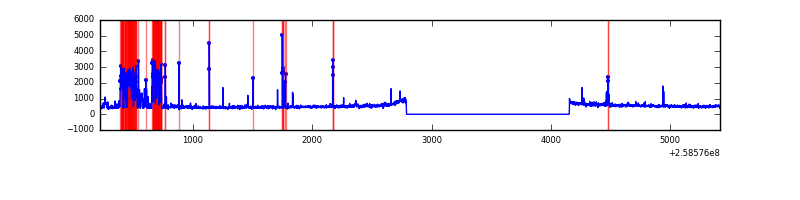 |
Top three noisy pixels from each quadrant. If the there are fewer than three noisy pixels in the level2.evt file, extra rows are filled as -1
| Pixel properties | Quadrant properties | ||||||
|---|---|---|---|---|---|---|---|
| Quadrant | DetID | PixID | Counts | Sigma | Mean | Median | Sigma |
| A | 15 | 239 | 1303981 | 13129.29 | 490 | 481 | 99.3 |
| A | 8 | 15 | 129819 | 1302.74 | 490 | 481 | 99.3 |
| A | 1 | 162 | 13532 | 131.45 | 490 | 481 | 99.3 |
| B | 4 | 239 | 394141 | 4166.56 | 498 | 487 | 94.5 |
| B | 3 | 64 | 44106 | 461.68 | 498 | 487 | 94.5 |
| B | 0 | 214 | 16186 | 166.16 | 498 | 487 | 94.5 |
| C | 6 | 96 | 32345 | 280.99 | 491 | 494 | 113.4 |
| C | 14 | 234 | 3460 | 26.17 | 491 | 494 | 113.4 |
| C | 13 | 61 | 3373 | 25.4 | 491 | 494 | 113.4 |
| D | 5 | 222 | 409404 | 3489.14 | 484 | 471 | 117.2 |
| D | 1 | 52 | 118143 | 1004.01 | 484 | 471 | 117.2 |
| D | 7 | 223 | 19406 | 161.56 | 484 | 471 | 117.2 |
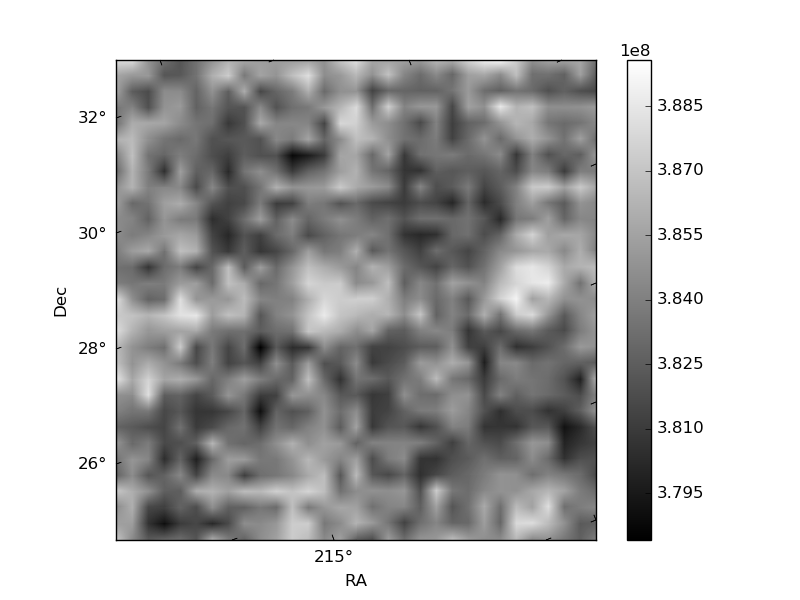
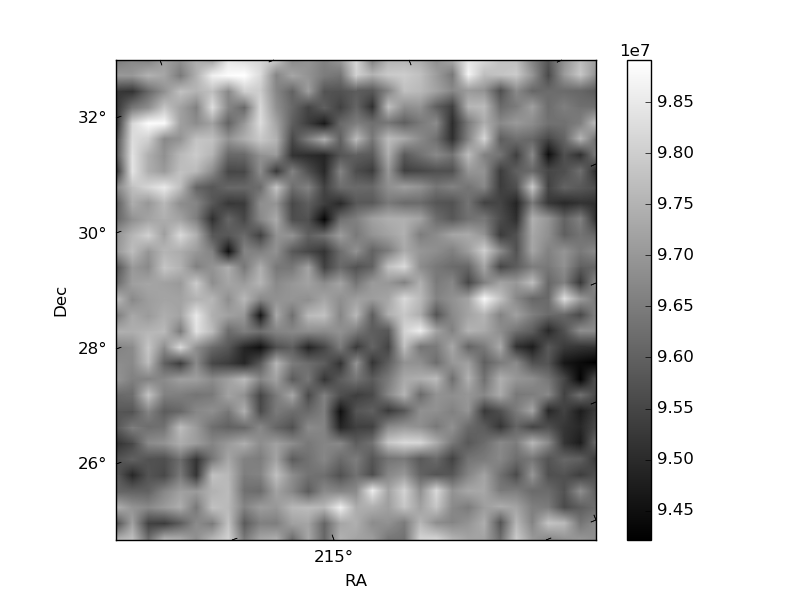
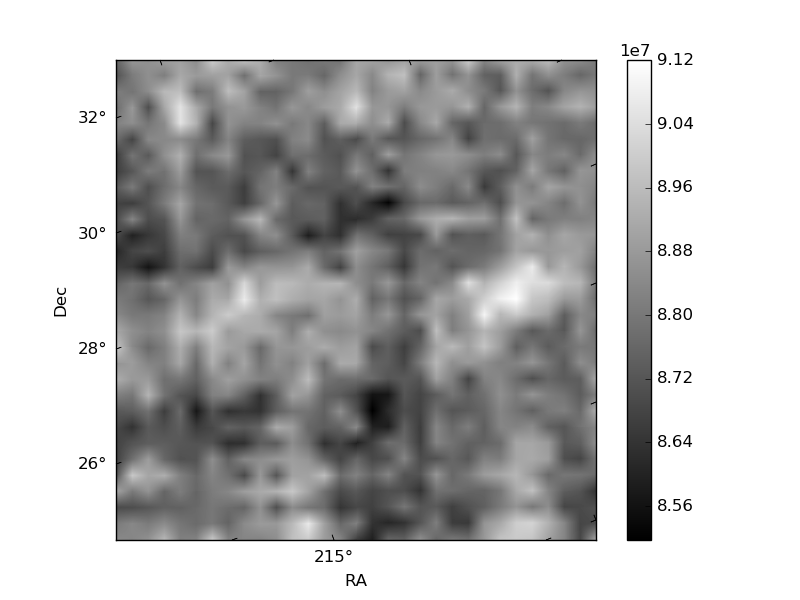
Histogram calculated using DETX and DETY for each event in the final _common_clean file
| Quadrant A | 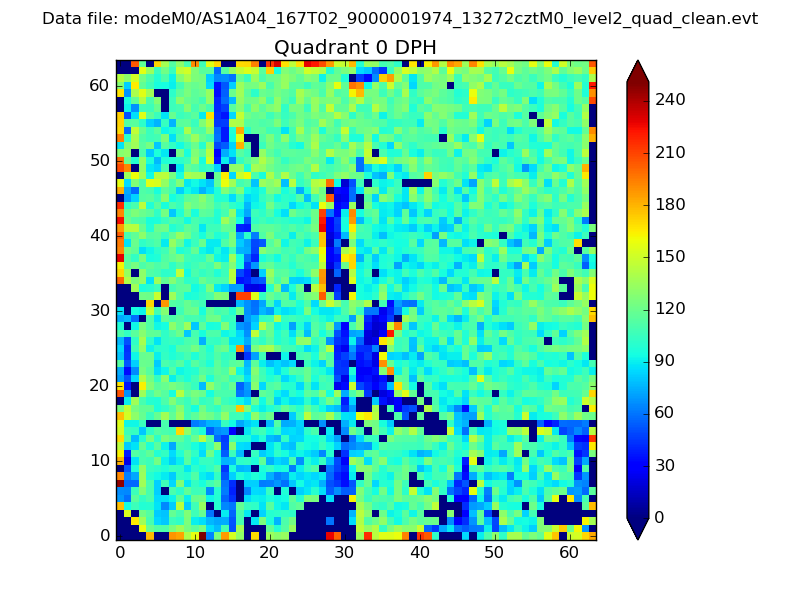 |
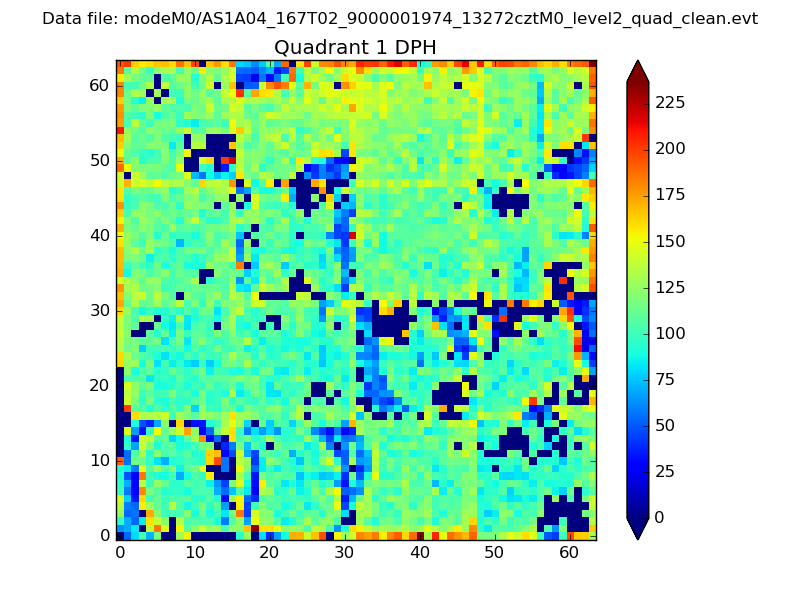 |
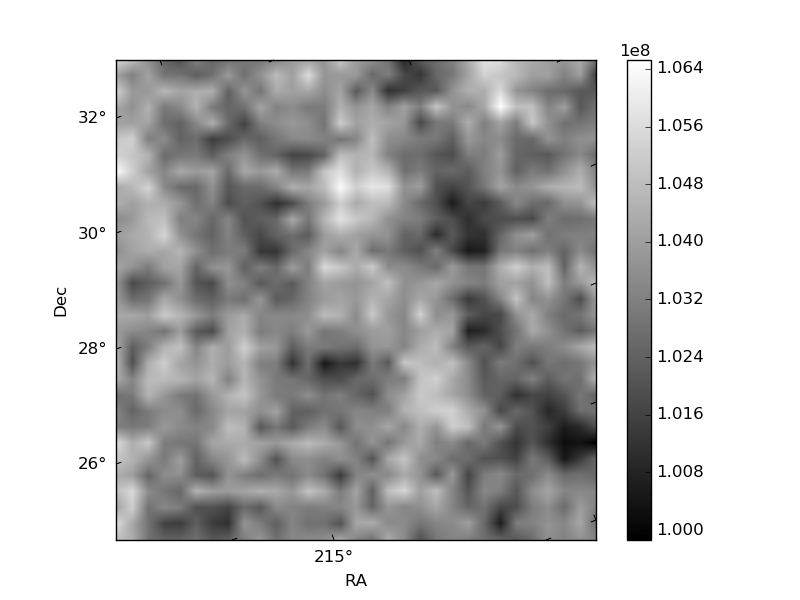
Quadrant B |
|---|---|---|---|
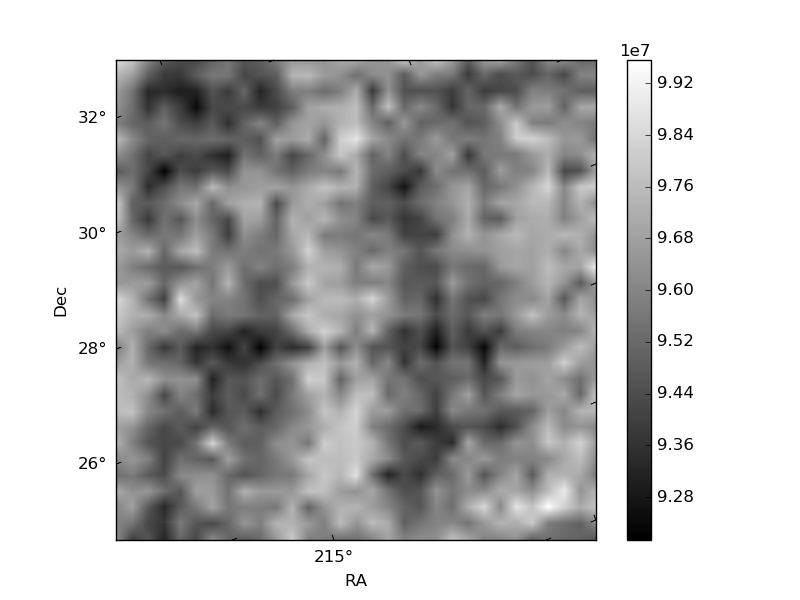
| Quadrant D | 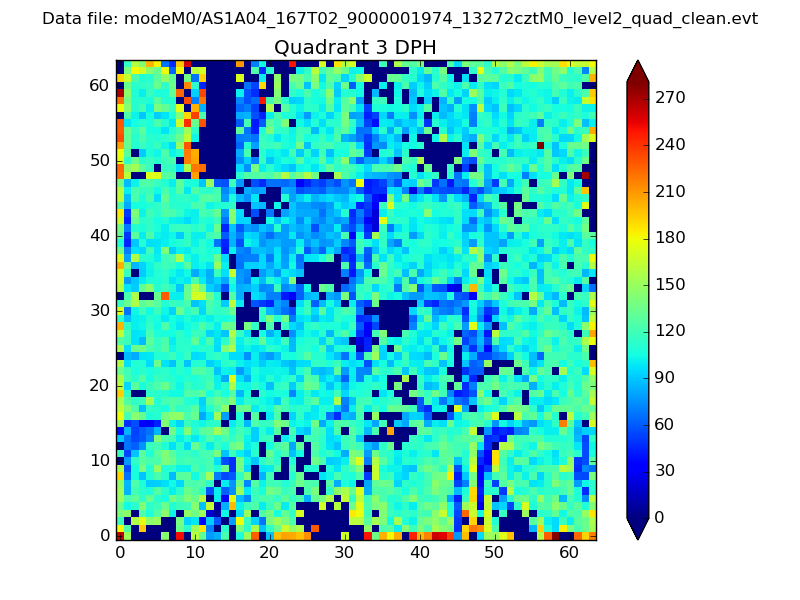 |
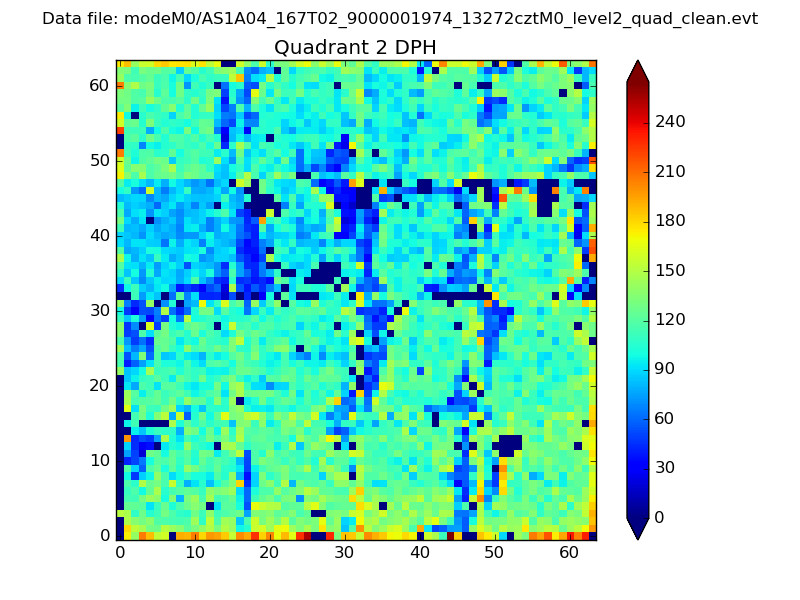 |
Quadrant C |
| Plot type | Count rate plots | Images |
|---|---|---|
| Comparison with Poisson distribution Blue bars denote a histogram of data divided into 1 sec bins. Red curve is a Poisson curve with rate = median count rate of data. |
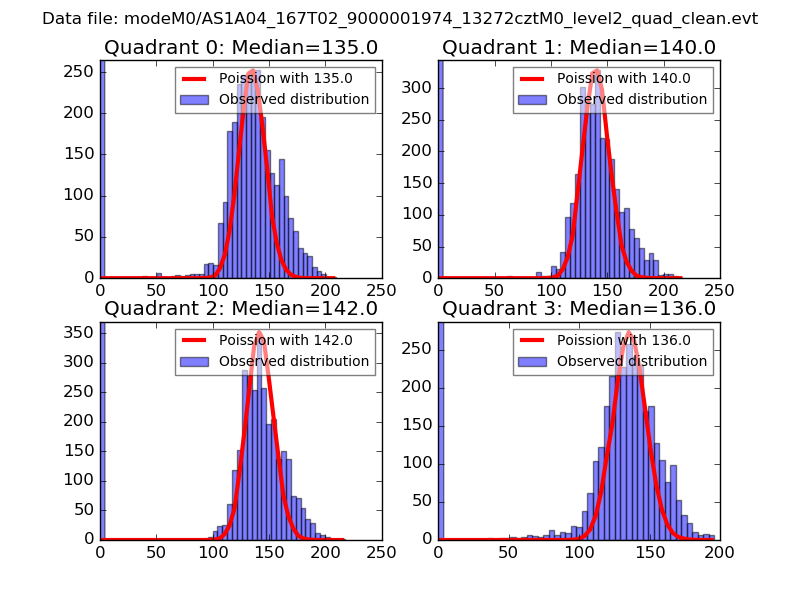 |
 |
| Quadrant-wise count rates Data is divided into 100 sec bins |
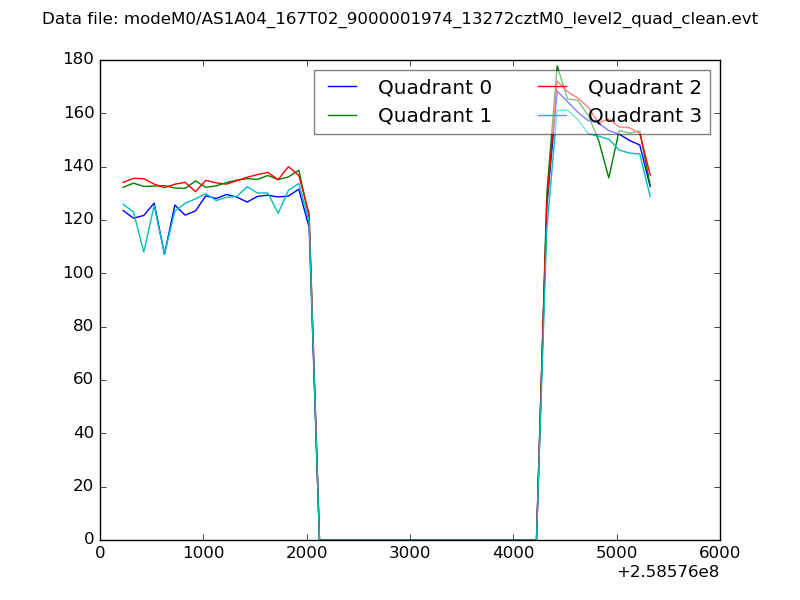 |
|
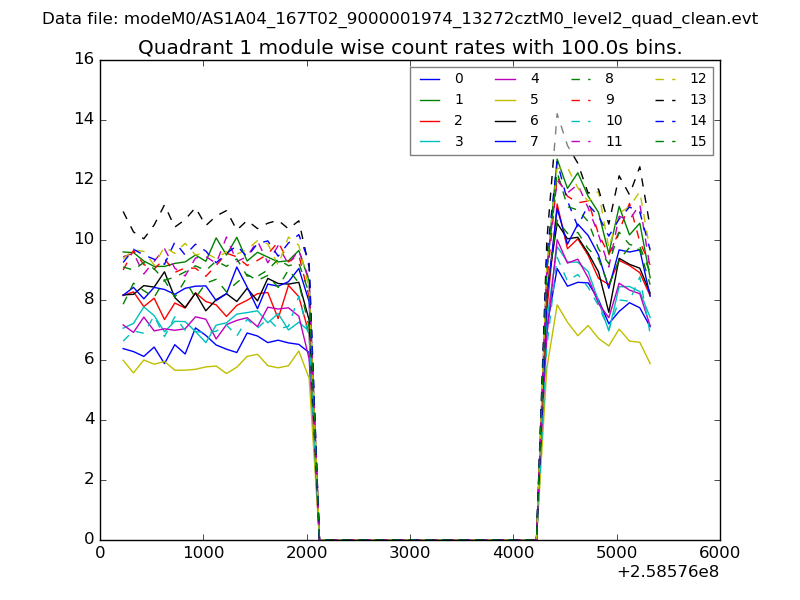
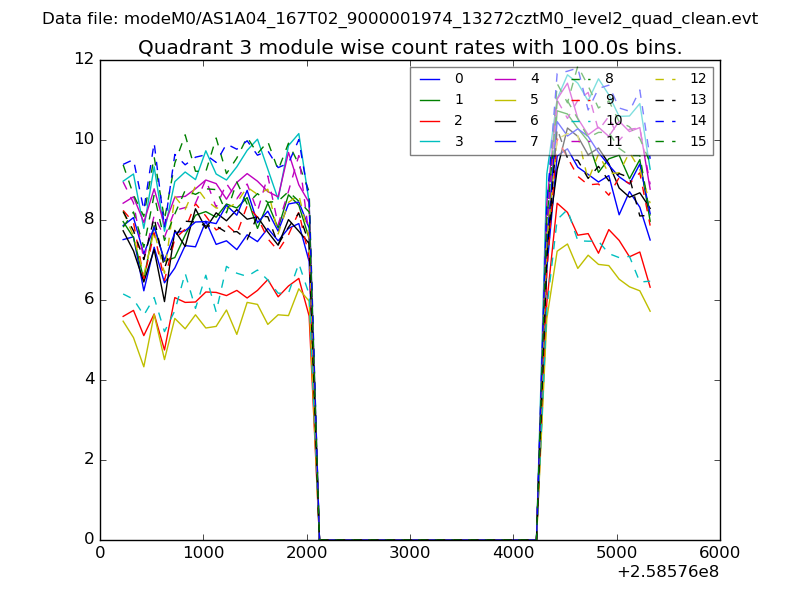
| Module-wise count rates for Quadrant A Data is divided into 100 sec bins |
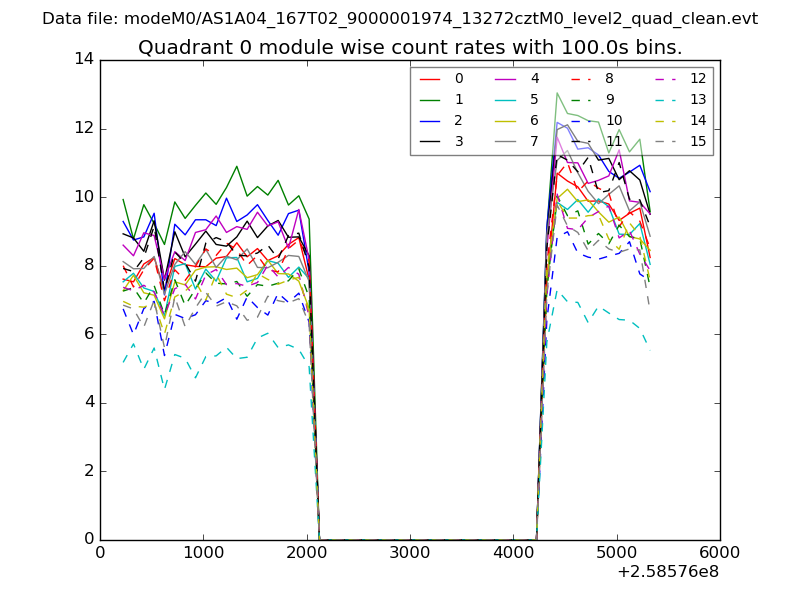 |
 |
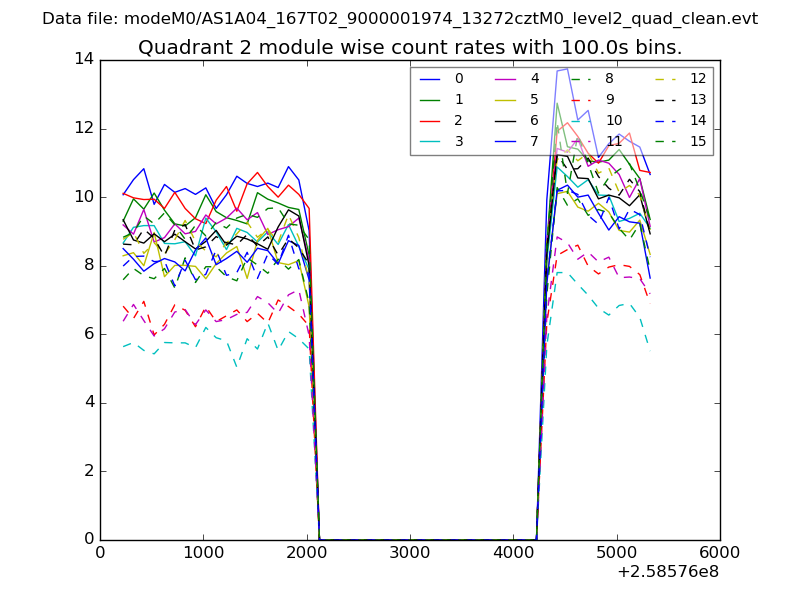
| Module-wise count rates for Quadrant B Data is divided into 100 sec bins |
 |
 |
| Module-wise count rates for Quadrant C Data is divided into 100 sec bins |
 |
 |
| Module-wise count rates for Quadrant D Data is divided into 100 sec bins |
 |
 |
| Parameter | Plot |
|---|---|
| CZT HV Monitor | 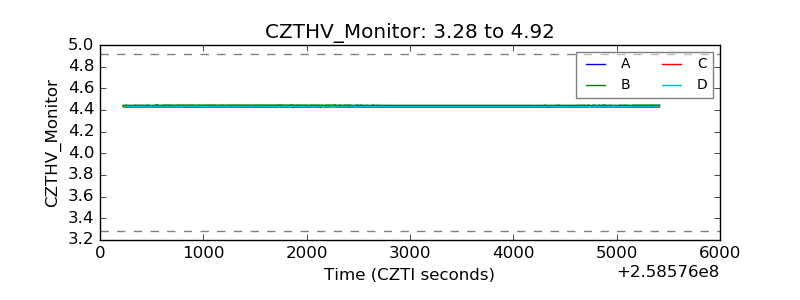 |
| D_VDD | 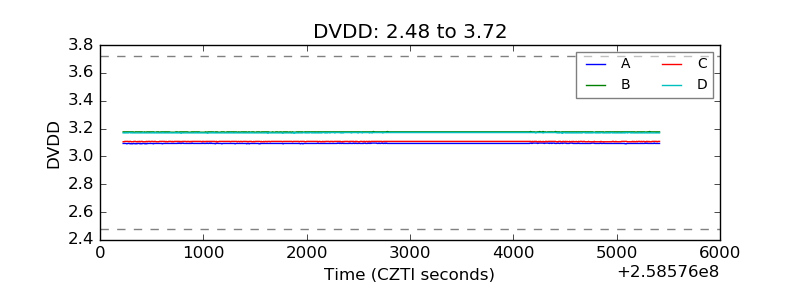 |
| Temperature 1 | 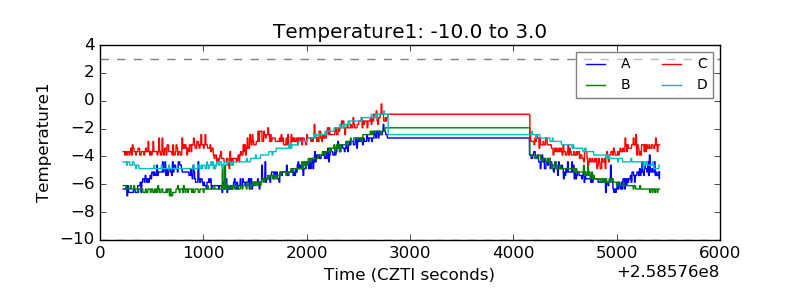 |
| Veto HV Monitor | 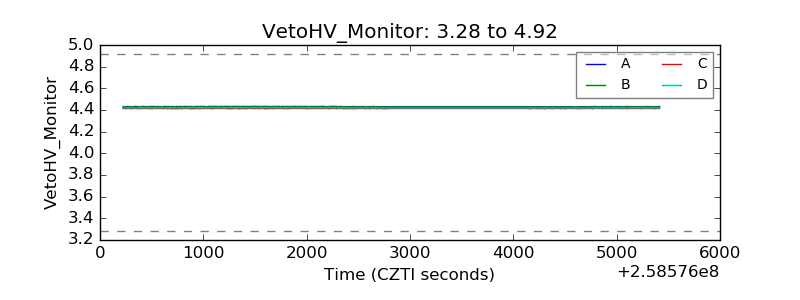 |
| Veto LLD | 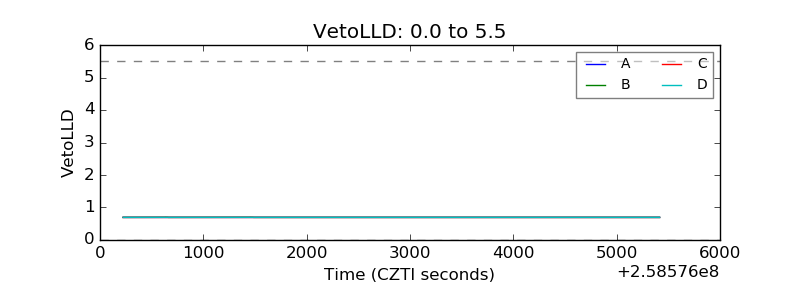 |
| Alpha Counter | 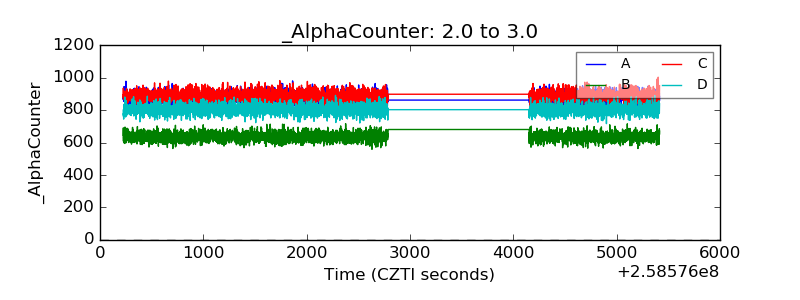 |
| _CPM_Rate | 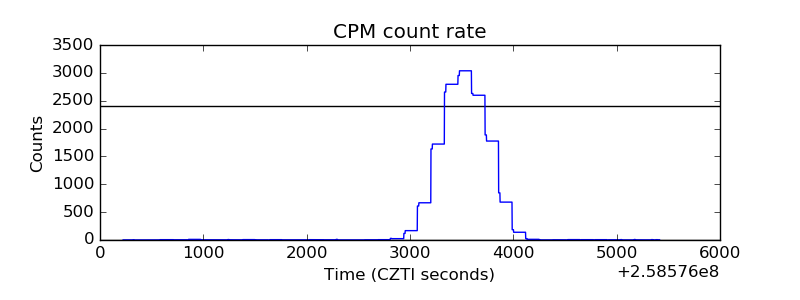 |
| CZT Counter | 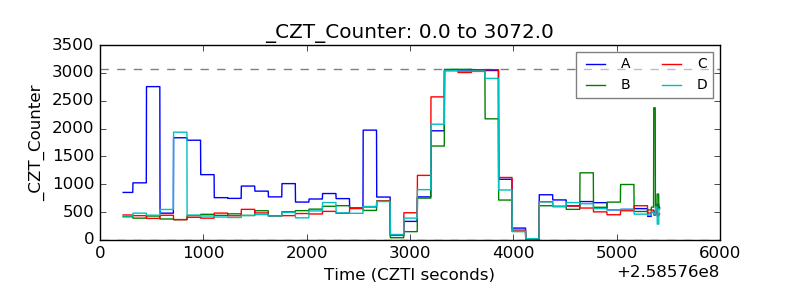 |
| +2.5 Volts monitor |  |
| +5 Volts monitor | 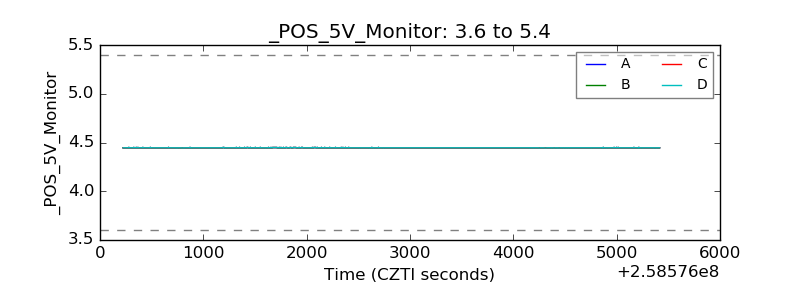 |
| _ROLL_ROT | 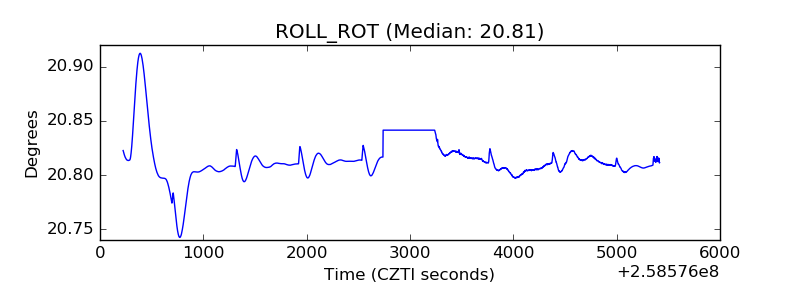 |
| _Roll_DEC | 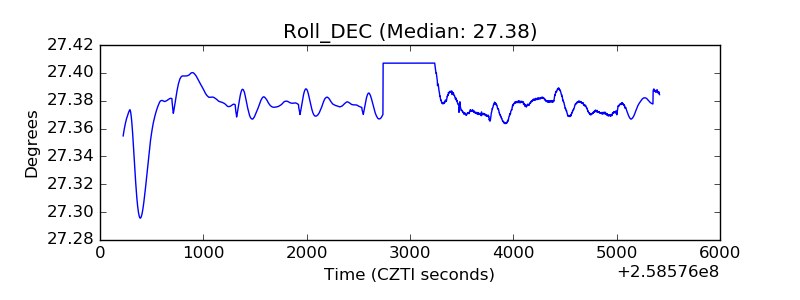 |
| _Roll_RA | 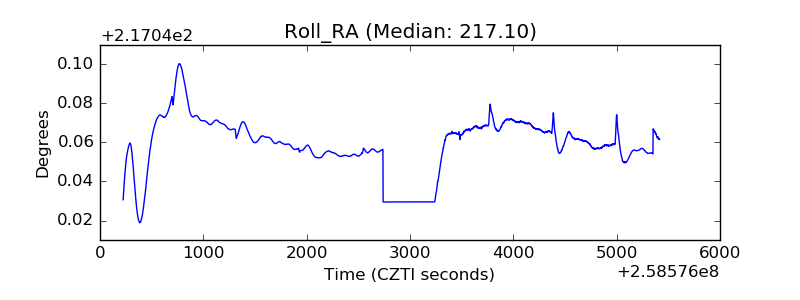 |
| Veto Counter | 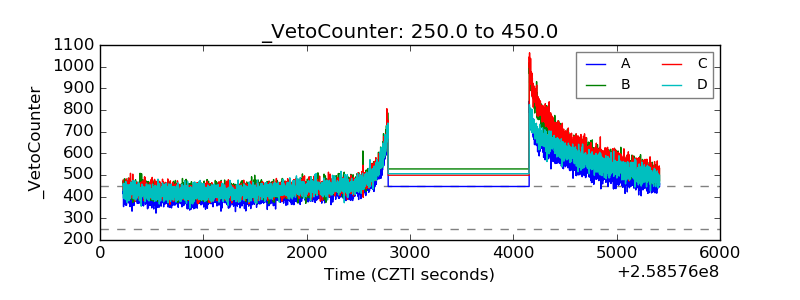 |