| Param | Original file | Final file |
|---|---|---|
| Filename | modeM0/AS1A04_167T02_9000001974_13273cztM0_level2.evt | modeM0/AS1A04_167T02_9000001974_13273cztM0_level2_quad_clean.evt |
| Size (bytes) | 521,023,680 | 106,436,160 |
| Size | 496.9 MB | 101.5 MB |
| Events in quadrant A | 4,338,857 | 683,811 |
| Events in quadrant B | 3,904,149 | 708,819 |
| Events in quadrant C | 3,267,900 | 714,848 |
| Events in quadrant D | 3,836,540 | 671,940 |
| Mode SS | |||
|---|---|---|---|
| Quadrant | BADHDUFLAG | Total packets | Discarded packets |
| A | 0 | 130 | 0 |
| B | 0 | 130 | 0 |
| C | 0 | 130 | 0 |
| D | 0 | 130 | 0 |
| Mode M0 | |||
|---|---|---|---|
| Quadrant | BADHDUFLAG | Total packets | Discarded packets |
| A | 0 | 17211 | 3 |
| B | 0 | 15759 | 2 |
| C | 0 | 13758 | 2 |
| D | 0 | 15760 | 2 |
| Mode M9 | |||
|---|---|---|---|
| Quadrant | BADHDUFLAG | Total packets | Discarded packets |
| A | 0 | 28 | 0 |
| B | 0 | 28 | 0 |
| C | 0 | 28 | 0 |
| D | 0 | 28 | 0 |
| Quadrant | Total seconds | Saturated seconds | Saturation percentage |
|---|---|---|---|
| A | 6370 | 319 | 5.007849% |
| B | 6370 | 221 | 3.469388% |
| C | 6370 | 72 | 1.130298% |
| D | 6370 | 111 | 1.742543% |
Noise dominated data is calculated using 1-second bins in cleaned event files. If a bin has >2000 counts, and if more than 50% of those come from <1% of pixels, then it is considered to be noise-dominated and hence unusable.
| Quadrant | # 1 sec bins | Bins with >0 counts | Bins with >2000 counts | High rate bins dominated by noise | Noise dominated (total time) | Noise dominated (detector-on time) | Marked lightcurve |
|---|---|---|---|---|---|---|---|
| A | 9146 | 6373 | 125 | 125 | 1.37% | 1.96% | 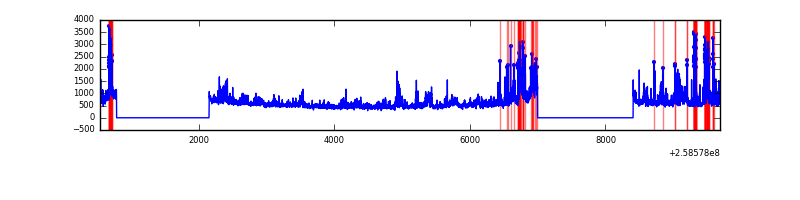 |
| B | 9146 | 6373 | 75 | 75 | 0.82% | 1.18% | 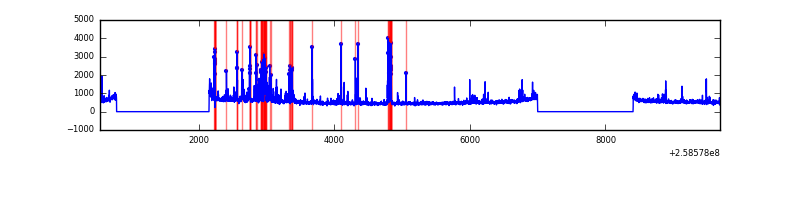 |
| C | 9146 | 6373 | 7 | 7 | 0.08% | 0.11% | 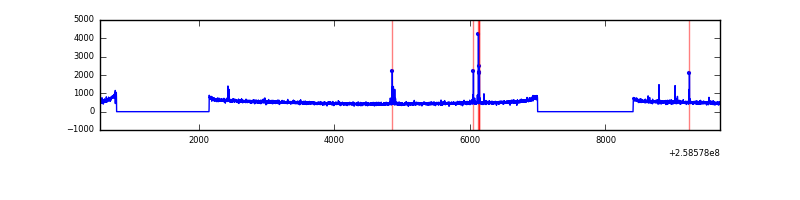 |
| D | 9146 | 6373 | 32 | 32 | 0.35% | 0.50% | 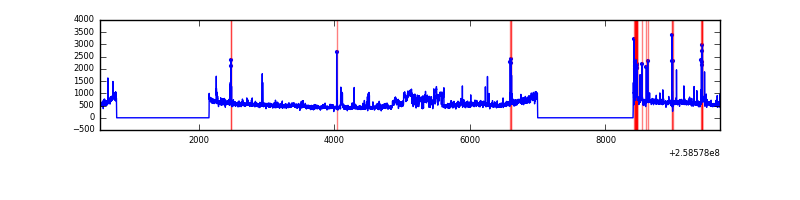 |
Top three noisy pixels from each quadrant. If the there are fewer than three noisy pixels in the level2.evt file, extra rows are filled as -1
| Pixel properties | Quadrant properties | ||||||
|---|---|---|---|---|---|---|---|
| Quadrant | DetID | PixID | Counts | Sigma | Mean | Median | Sigma |
| A | 15 | 239 | 783284 | 4765.09 | 814 | 798 | 164.2 |
| A | 8 | 15 | 335519 | 2038.34 | 814 | 798 | 164.2 |
| A | 1 | 162 | 33405 | 198.57 | 814 | 798 | 164.2 |
| B | 4 | 239 | 487482 | 3139.56 | 831 | 811 | 155.0 |
| B | 3 | 64 | 35328 | 222.67 | 831 | 811 | 155.0 |
| B | 0 | 189 | 27412 | 171.61 | 831 | 811 | 155.0 |
| C | 15 | 208 | 35854 | 186.27 | 823 | 830 | 188.0 |
| C | 6 | 96 | 21728 | 111.14 | 823 | 830 | 188.0 |
| C | 13 | 61 | 5934 | 27.14 | 823 | 830 | 188.0 |
| D | 1 | 52 | 613721 | 3188.69 | 810 | 788 | 192.2 |
| D | 10 | 157 | 48538 | 248.41 | 810 | 788 | 192.2 |
| D | 8 | 195 | 39344 | 200.58 | 810 | 788 | 192.2 |
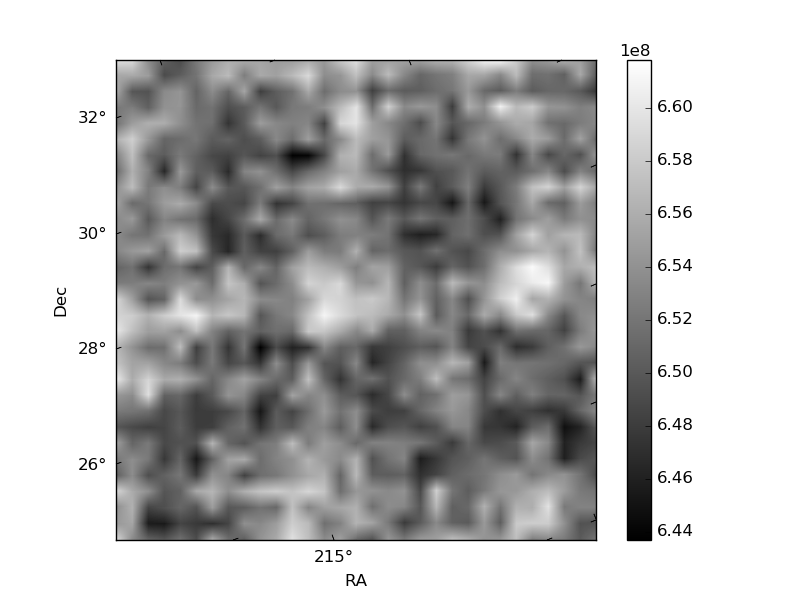
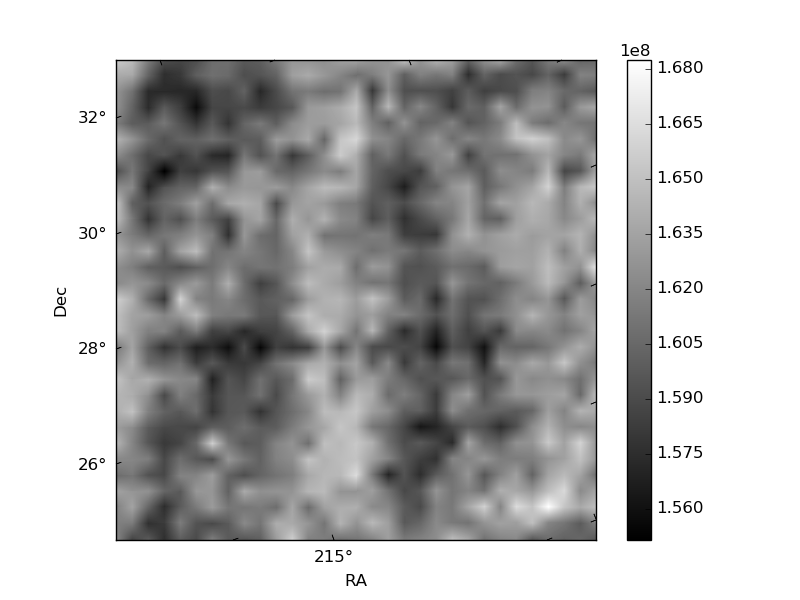
Histogram calculated using DETX and DETY for each event in the final _common_clean file
| Quadrant A | 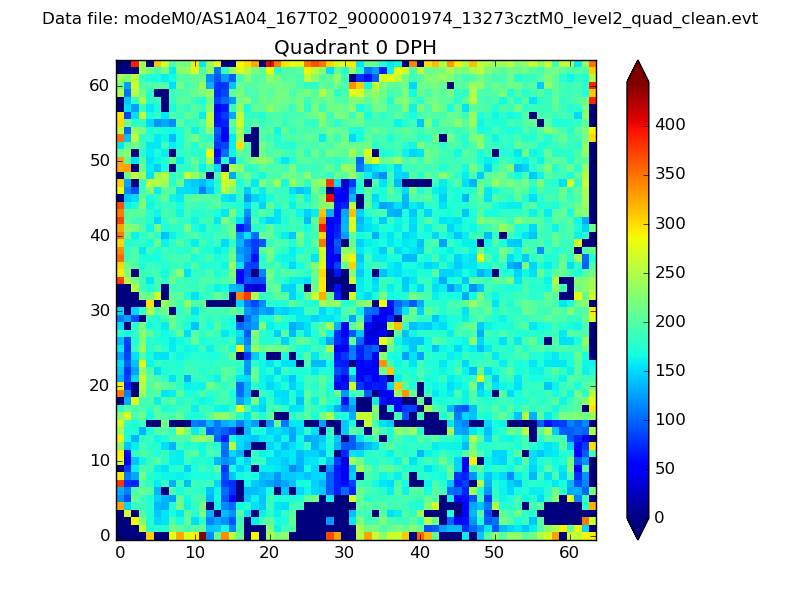 |
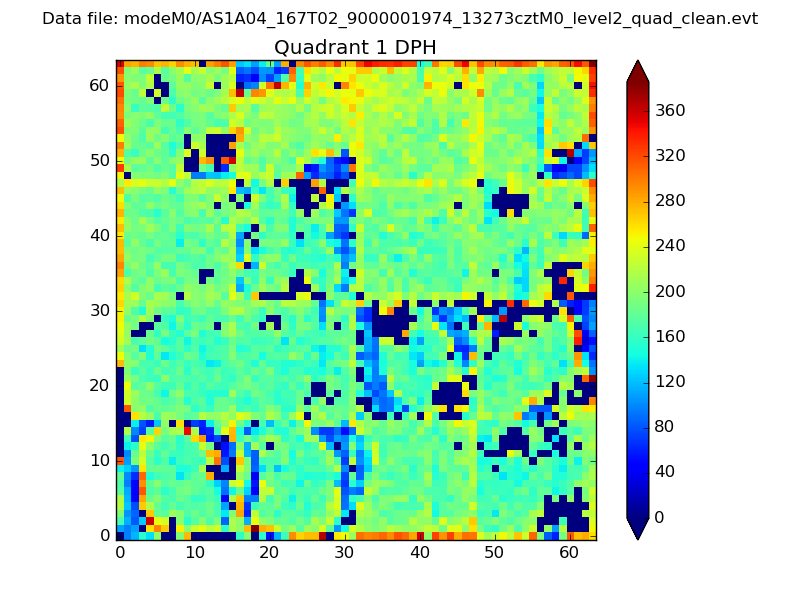 |
Quadrant B |
|---|---|---|---|
| Quadrant D | 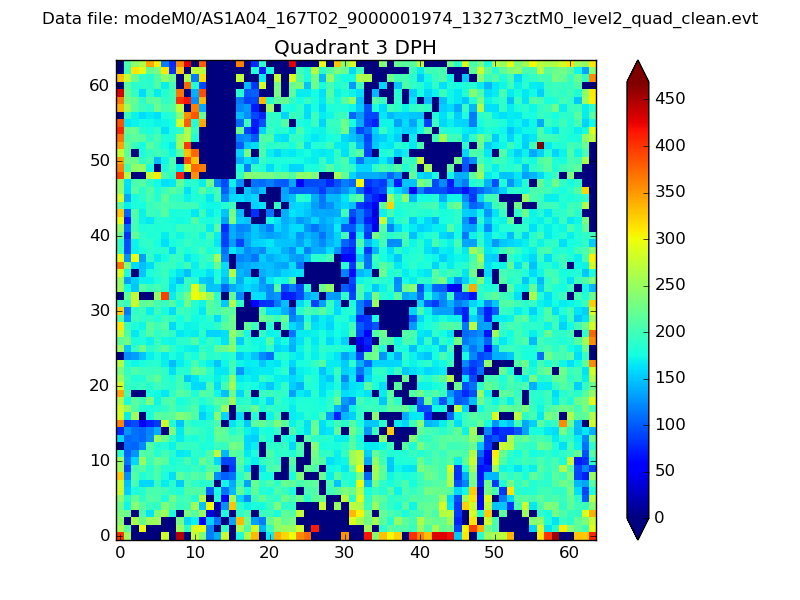 |
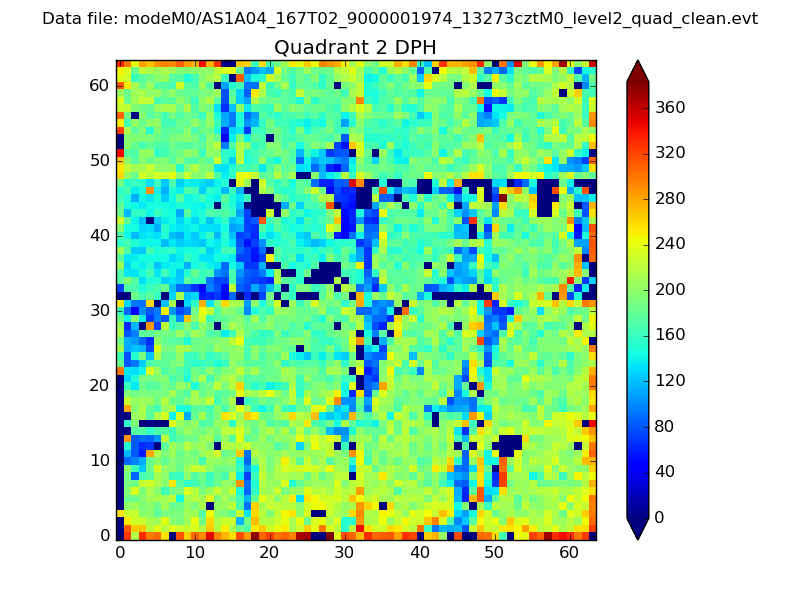 |
Quadrant C |
| Plot type | Count rate plots | Images |
|---|---|---|
| Comparison with Poisson distribution Blue bars denote a histogram of data divided into 1 sec bins. Red curve is a Poisson curve with rate = median count rate of data. |
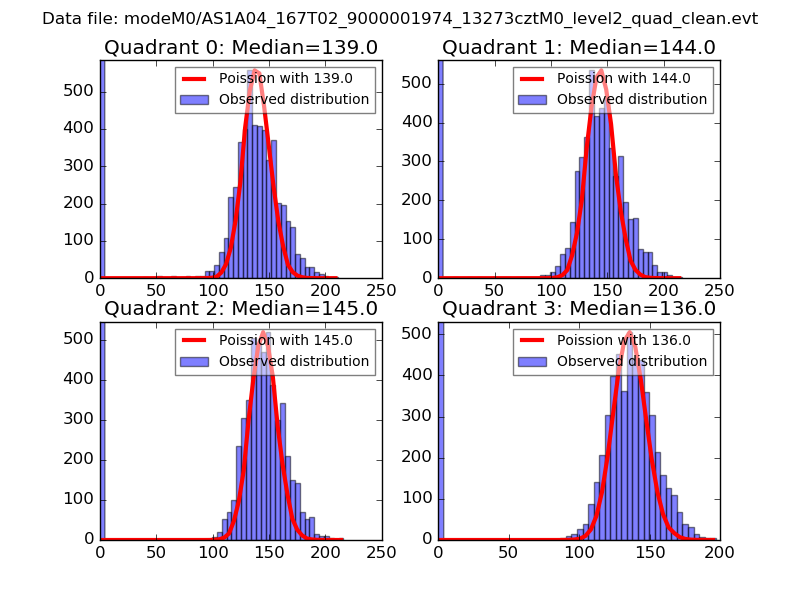 |
 |
| Quadrant-wise count rates Data is divided into 100 sec bins |
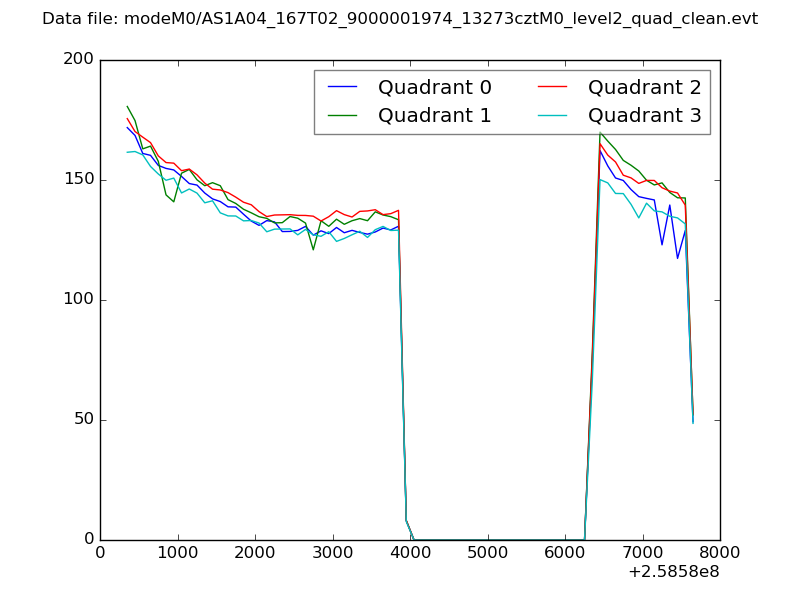 |
|
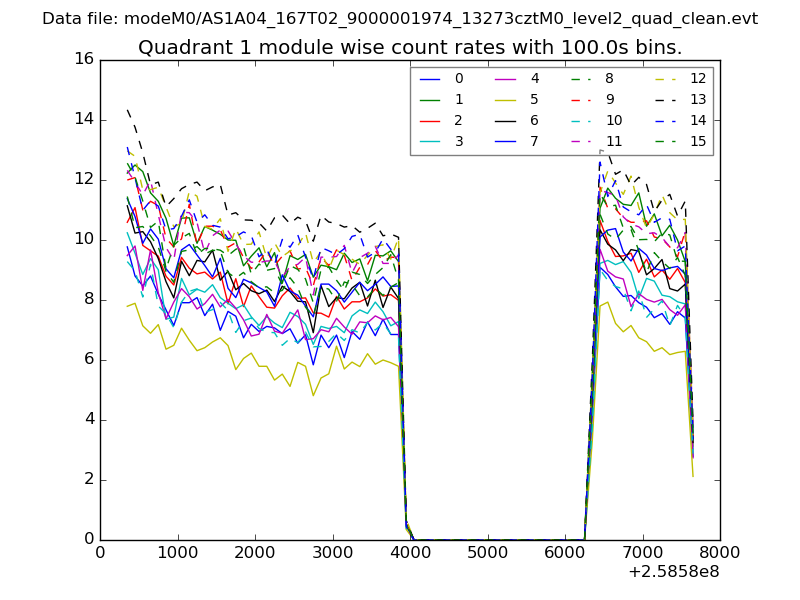
| Module-wise count rates for Quadrant A Data is divided into 100 sec bins |
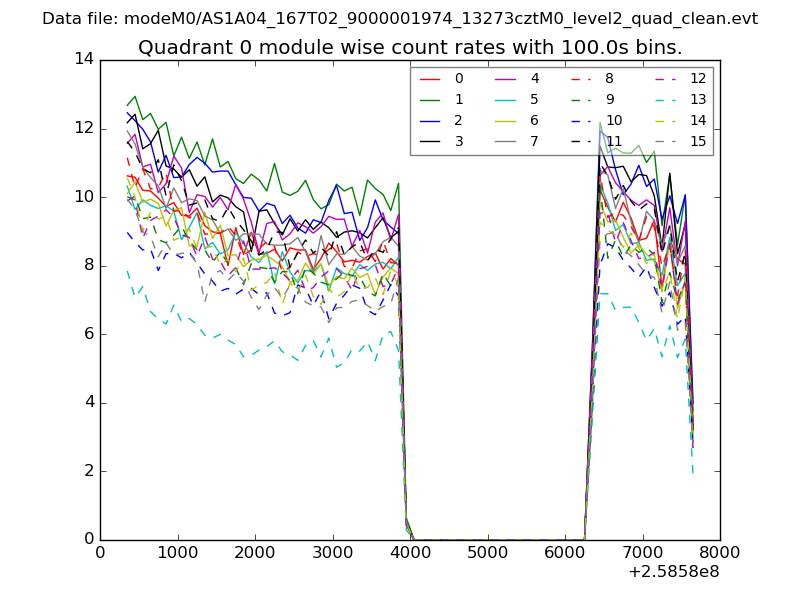 |
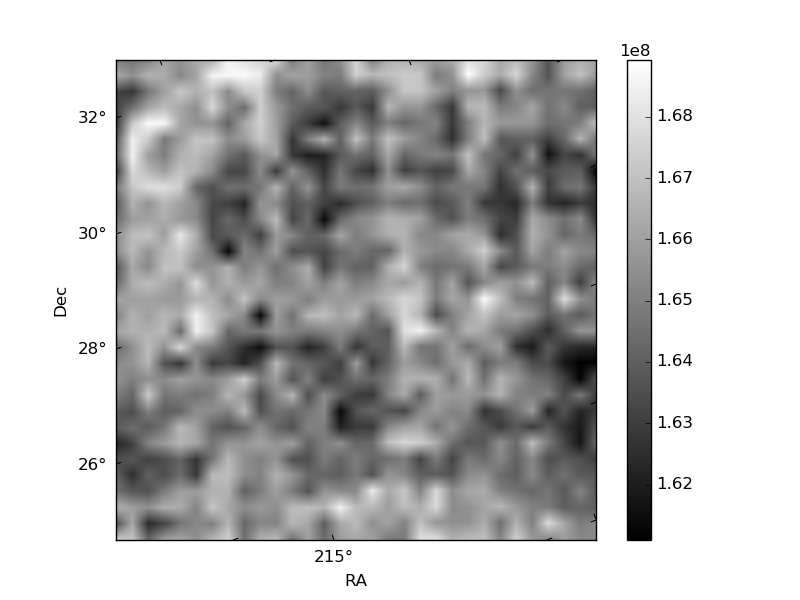 |
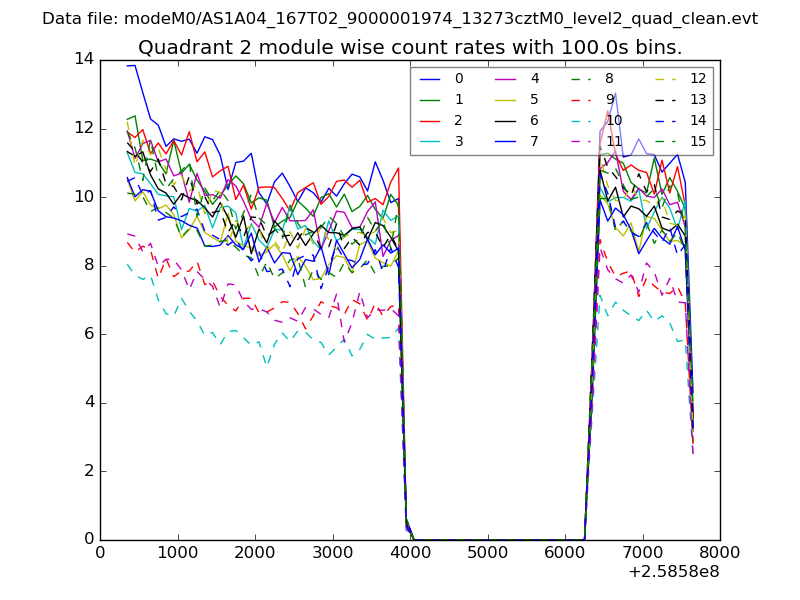
| Module-wise count rates for Quadrant B Data is divided into 100 sec bins |
 |
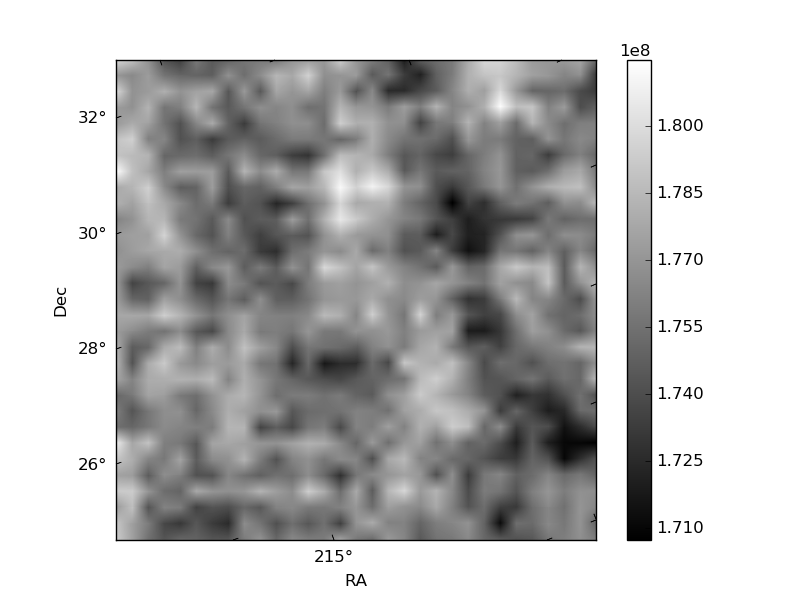 |
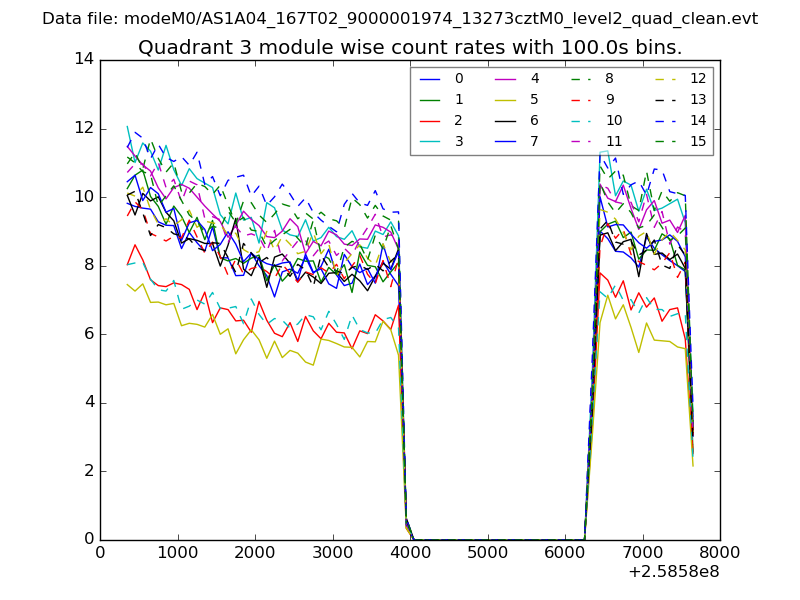
| Module-wise count rates for Quadrant C Data is divided into 100 sec bins |
 |
 |
| Module-wise count rates for Quadrant D Data is divided into 100 sec bins |
 |
 |
| Parameter | Plot |
|---|---|
| CZT HV Monitor | 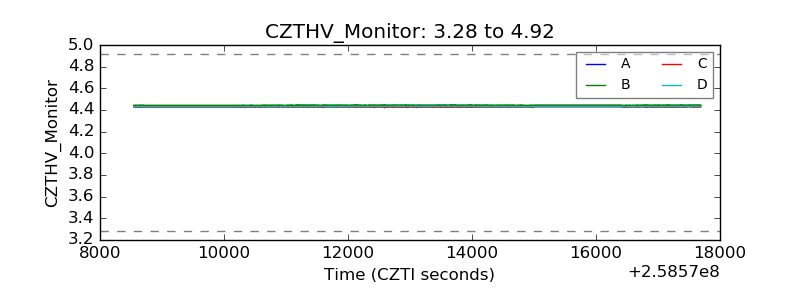 |
| D_VDD | 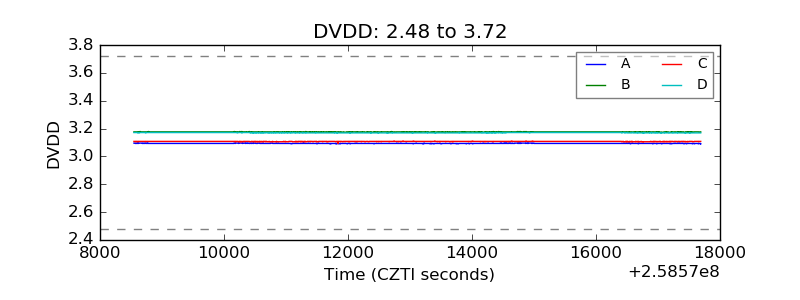 |
| Temperature 1 | 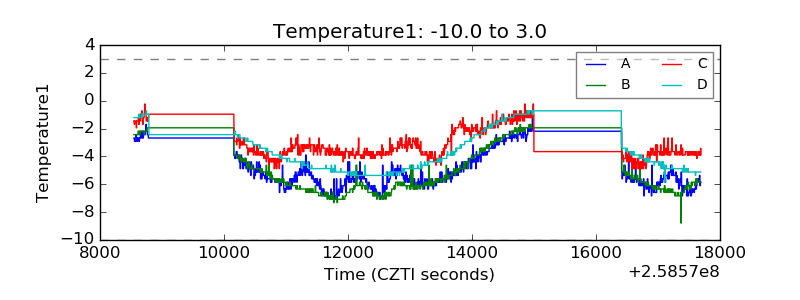 |
| Veto HV Monitor | 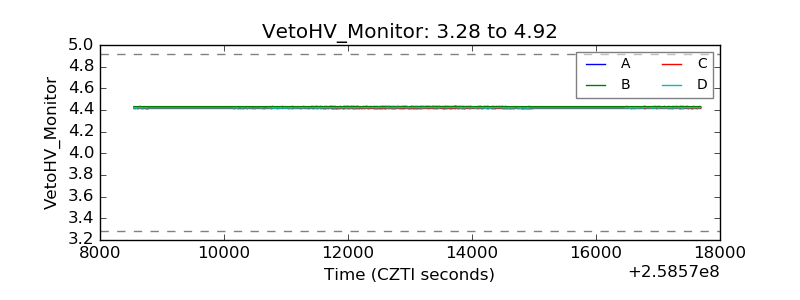 |
| Veto LLD |  |
| Alpha Counter | 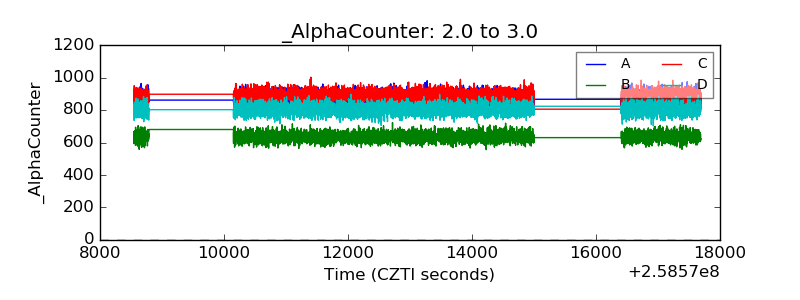 |
| _CPM_Rate | 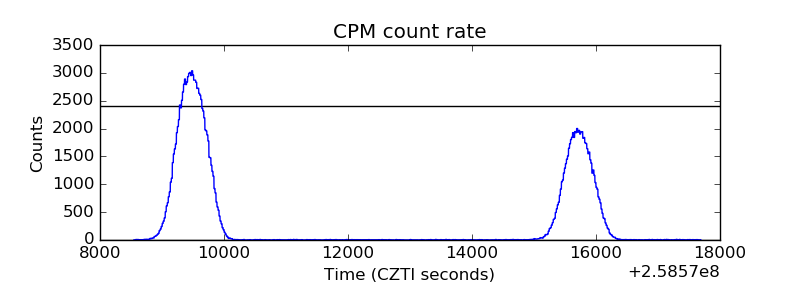 |
| CZT Counter | 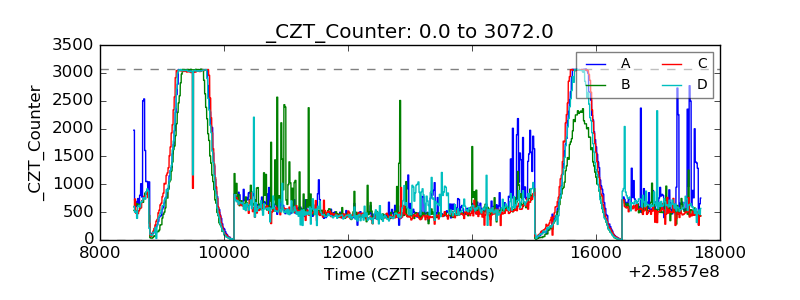 |
| +2.5 Volts monitor | 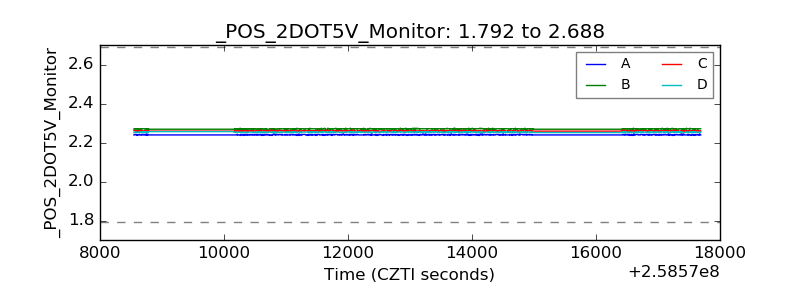 |
| +5 Volts monitor | 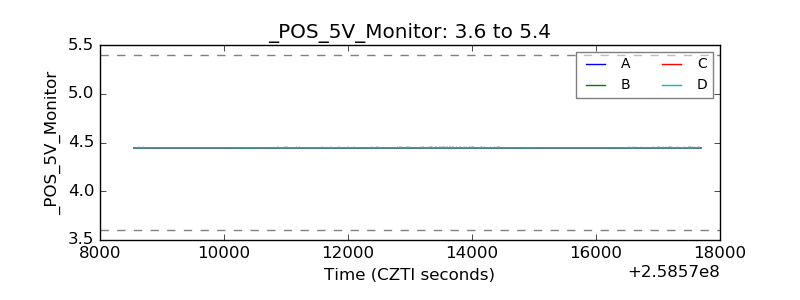 |
| _ROLL_ROT | 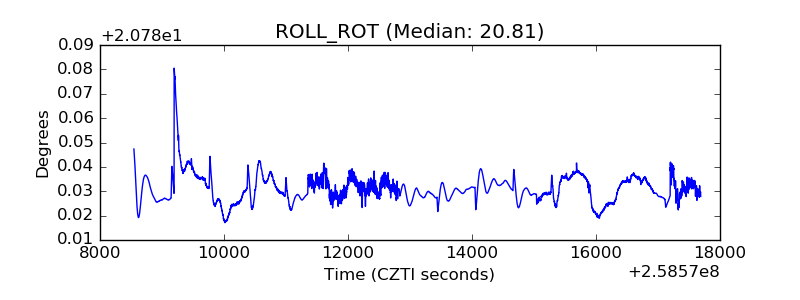 |
| _Roll_DEC | 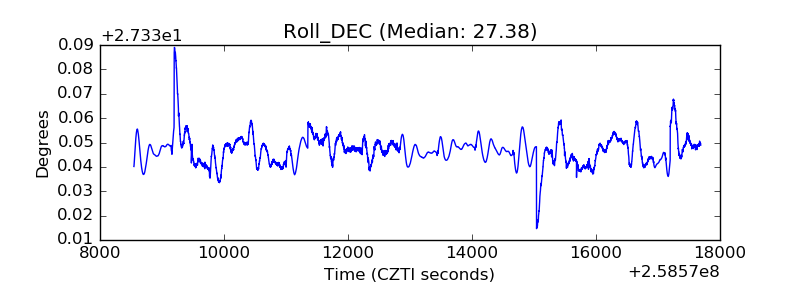 |
| _Roll_RA | 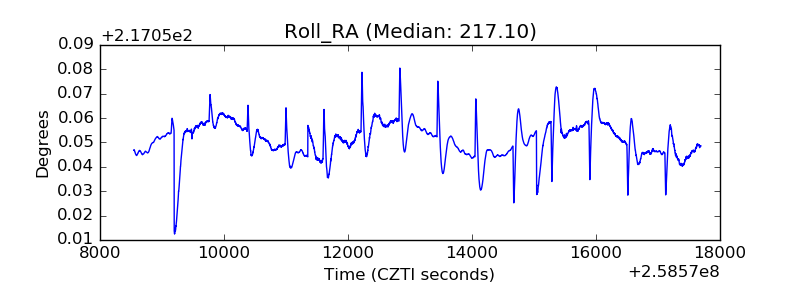 |
| Veto Counter | 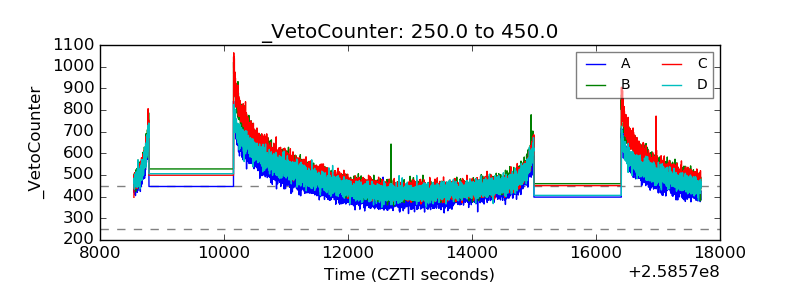 |