| Param | Original file | Final file |
|---|---|---|
| Filename | modeM0/AS1A04_167T02_9000001974_13275cztM0_level2.evt | modeM0/AS1A04_167T02_9000001974_13275cztM0_level2_quad_clean.evt |
| Size (bytes) | 356,564,160 | 55,206,720 |
| Size | 340.0 MB | 52.6 MB |
| Events in quadrant A | 2,077,141 | 373,418 |
| Events in quadrant B | 3,681,613 | 319,167 |
| Events in quadrant C | 1,687,792 | 387,821 |
| Events in quadrant D | 3,122,135 | 351,635 |
| Mode SS | |||
|---|---|---|---|
| Quadrant | BADHDUFLAG | Total packets | Discarded packets |
| A | 0 | 88 | 18 |
| B | 0 | 86 | 16 |
| C | 0 | 88 | 16 |
| D | 0 | 90 | 20 |
| Mode M0 | |||
|---|---|---|---|
| Quadrant | BADHDUFLAG | Total packets | Discarded packets |
| A | 0 | 10513 | 2125 |
| B | 0 | 15236 | 2084 |
| C | 0 | 8792 | 1531 |
| D | 0 | 14365 | 2625 |
| Mode M9 | |||
|---|---|---|---|
| Quadrant | BADHDUFLAG | Total packets | Discarded packets |
| A | 0 | 24 | 3 |
| B | 0 | 26 | 7 |
| C | 0 | 25 | 4 |
| D | 0 | 24 | 4 |
| Quadrant | Total seconds | Saturated seconds | Saturation percentage |
|---|---|---|---|
| A | 3360 | 114 | 3.392857% |
| B | 3357 | 1025 | 30.533214% |
| C | 3405 | 30 | 0.881057% |
| D | 3370 | 222 | 6.587537% |
Noise dominated data is calculated using 1-second bins in cleaned event files. If a bin has >2000 counts, and if more than 50% of those come from <1% of pixels, then it is considered to be noise-dominated and hence unusable.
| Quadrant | # 1 sec bins | Bins with >0 counts | Bins with >2000 counts | High rate bins dominated by noise | Noise dominated (total time) | Noise dominated (detector-on time) | Marked lightcurve |
|---|---|---|---|---|---|---|---|
| A | 7901 | 3445 | 18 | 18 | 0.23% | 0.52% | 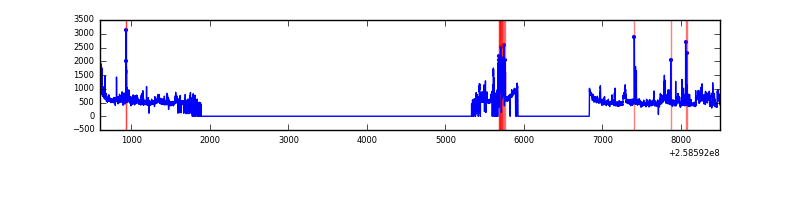 |
| B | 7901 | 3445 | 639 | 639 | 8.09% | 18.55% | 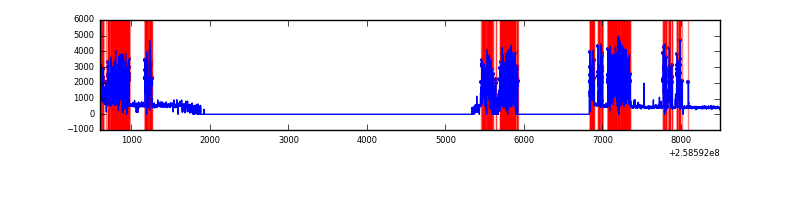 |
| C | 7901 | 3485 | 1 | 1 | 0.01% | 0.03% | 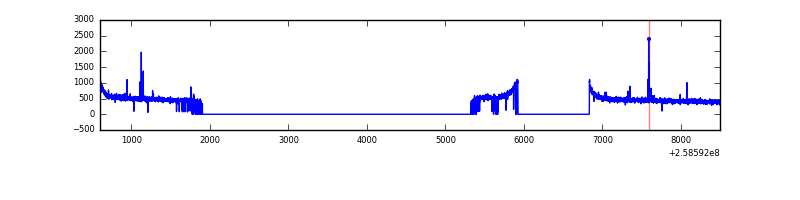 |
| D | 7901 | 3449 | 120 | 120 | 1.52% | 3.48% | 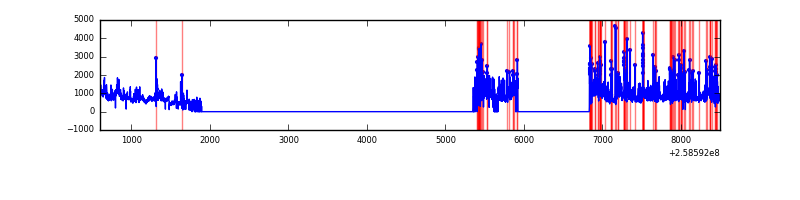 |
Top three noisy pixels from each quadrant. If the there are fewer than three noisy pixels in the level2.evt file, extra rows are filled as -1
| Pixel properties | Quadrant properties | ||||||
|---|---|---|---|---|---|---|---|
| Quadrant | DetID | PixID | Counts | Sigma | Mean | Median | Sigma |
| A | 15 | 239 | 359347 | 4181.15 | 417 | 409 | 85.8 |
| A | 8 | 15 | 91719 | 1063.64 | 417 | 409 | 85.8 |
| A | 1 | 162 | 11220 | 125.93 | 417 | 409 | 85.8 |
| B | 4 | 239 | 2266126 | 34248.15 | 338 | 330 | 66.2 |
| B | 0 | 244 | 65252 | 981.31 | 338 | 330 | 66.2 |
| B | 4 | 173 | 11319 | 166.1 | 338 | 330 | 66.2 |
| C | 6 | 96 | 18412 | 177.46 | 427 | 429 | 101.3 |
| C | 14 | 234 | 3958 | 34.83 | 427 | 429 | 101.3 |
| C | 13 | 61 | 3051 | 25.87 | 427 | 429 | 101.3 |
| D | 1 | 52 | 1239555 | 12579.85 | 399 | 387 | 98.5 |
| D | 13 | 249 | 320117 | 3245.85 | 399 | 387 | 98.5 |
| D | 5 | 222 | 22646 | 225.97 | 399 | 387 | 98.5 |
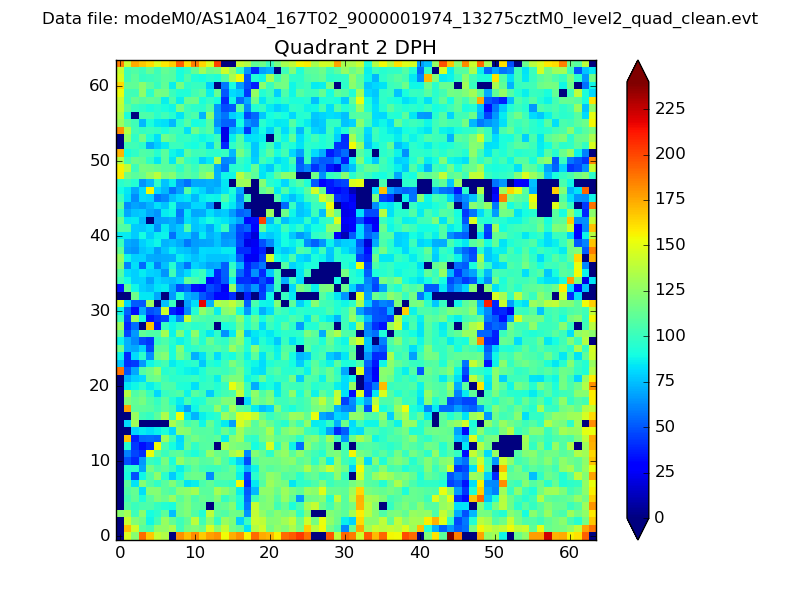
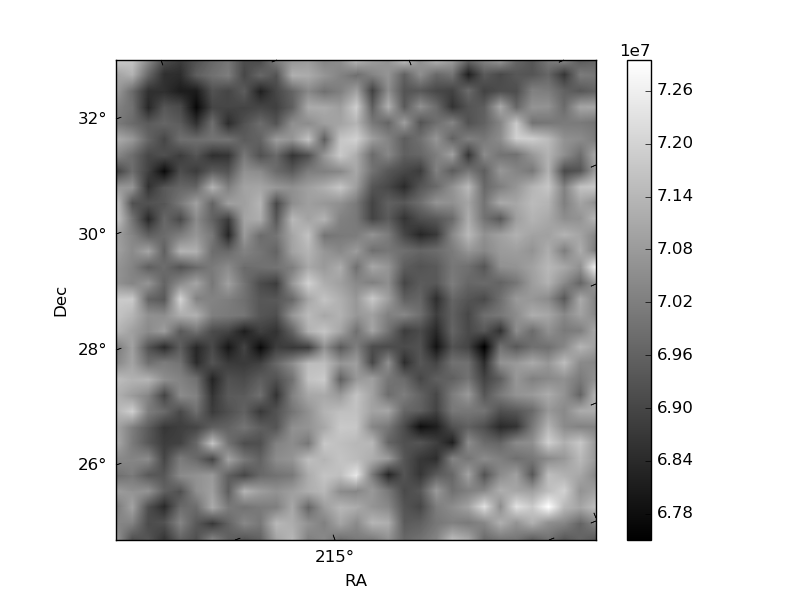
Histogram calculated using DETX and DETY for each event in the final _common_clean file
| Quadrant A | 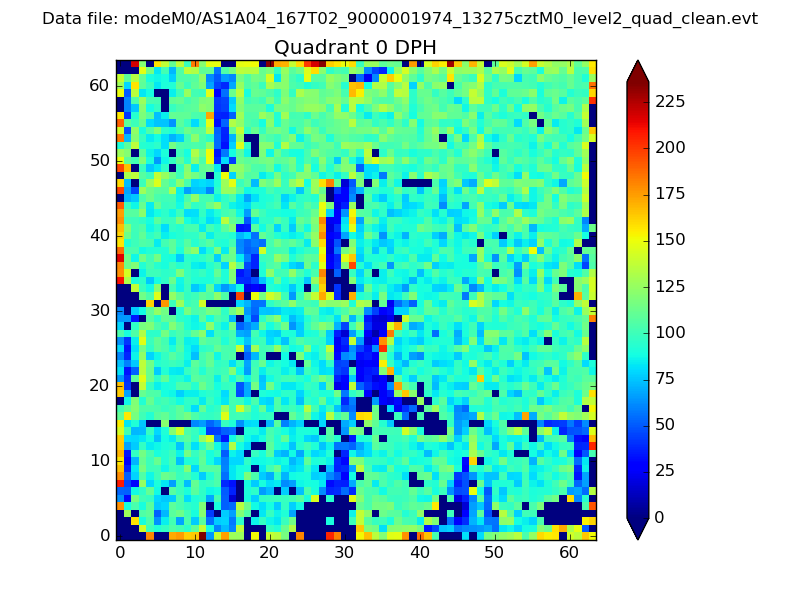 |
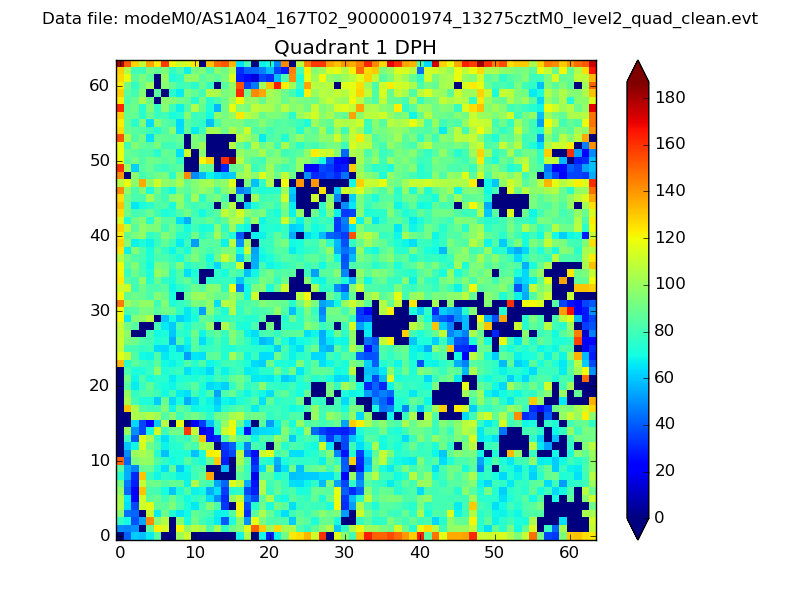 |
Quadrant B |
|---|---|---|---|
| Quadrant D | 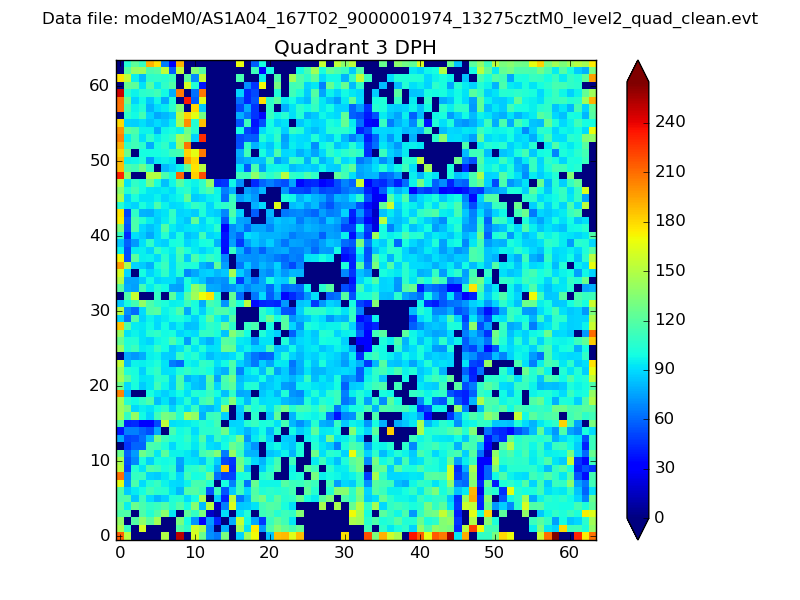 |
 |
Quadrant C |
| Plot type | Count rate plots | Images |
|---|---|---|
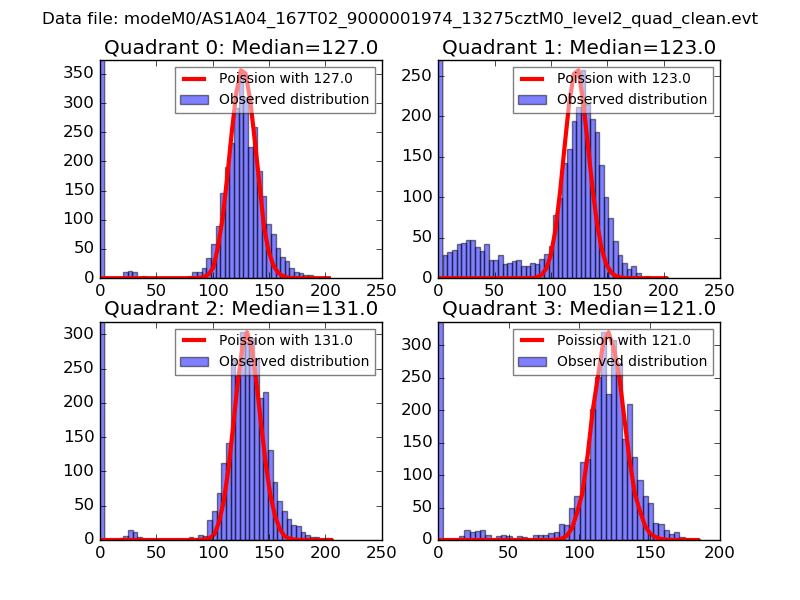
| Comparison with Poisson distribution Blue bars denote a histogram of data divided into 1 sec bins. Red curve is a Poisson curve with rate = median count rate of data. |
 |
 |
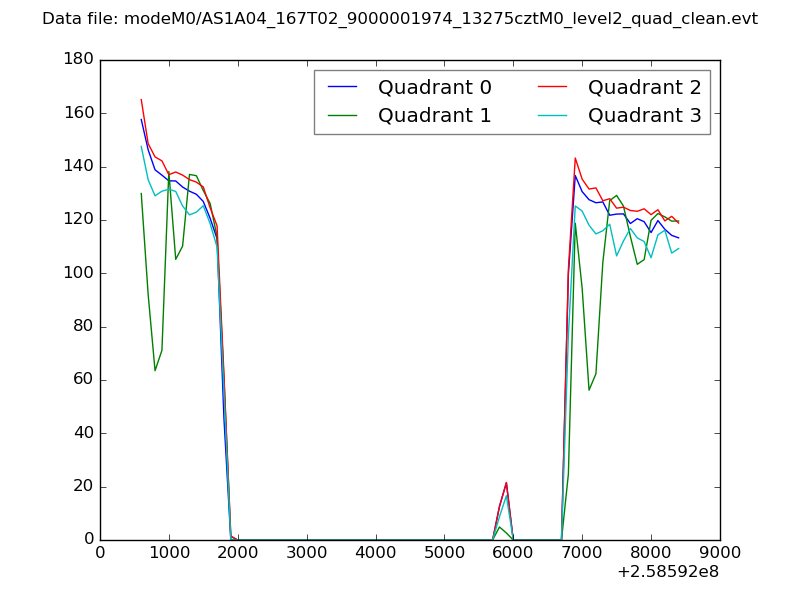
| Quadrant-wise count rates Data is divided into 100 sec bins |
 |
|
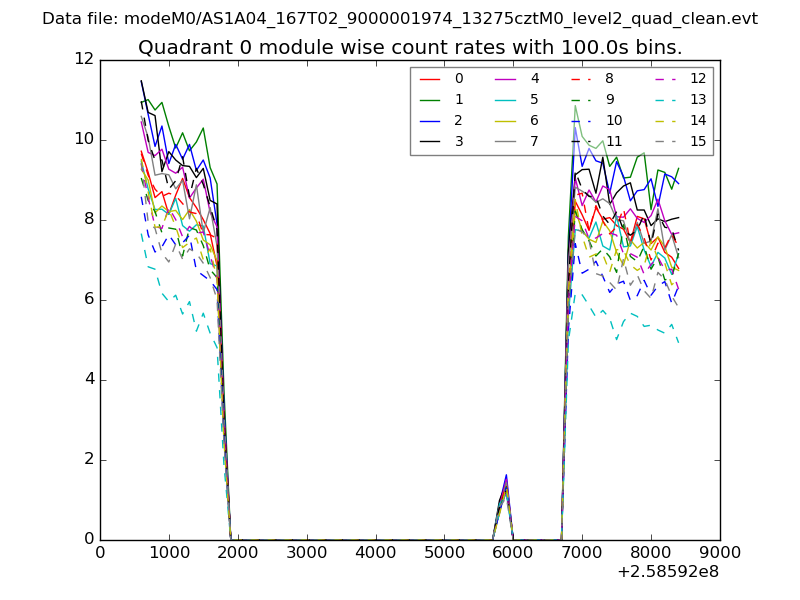
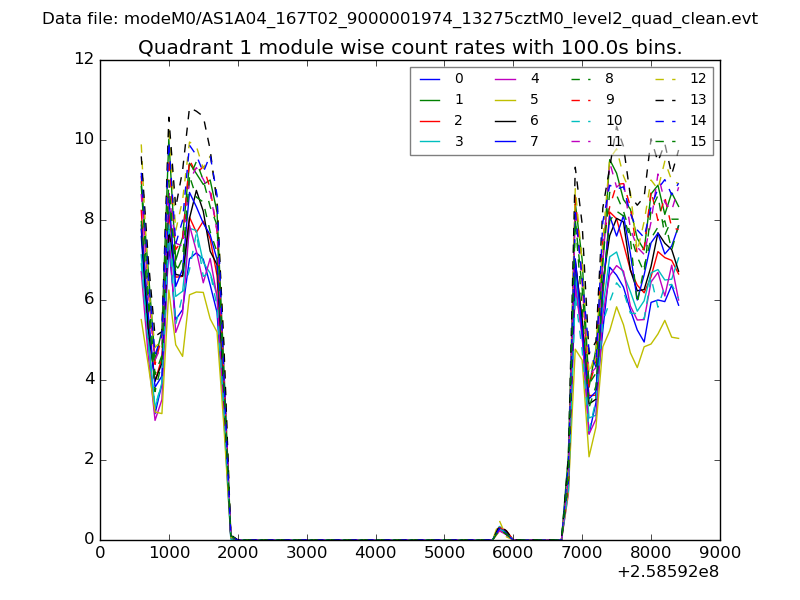
| Module-wise count rates for Quadrant A Data is divided into 100 sec bins |
 |
 |
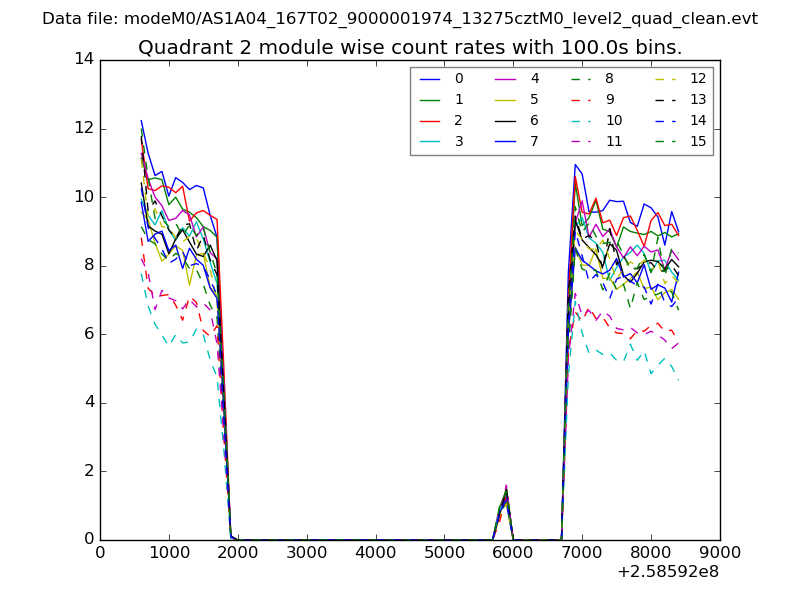
| Module-wise count rates for Quadrant B Data is divided into 100 sec bins |
 |
 |
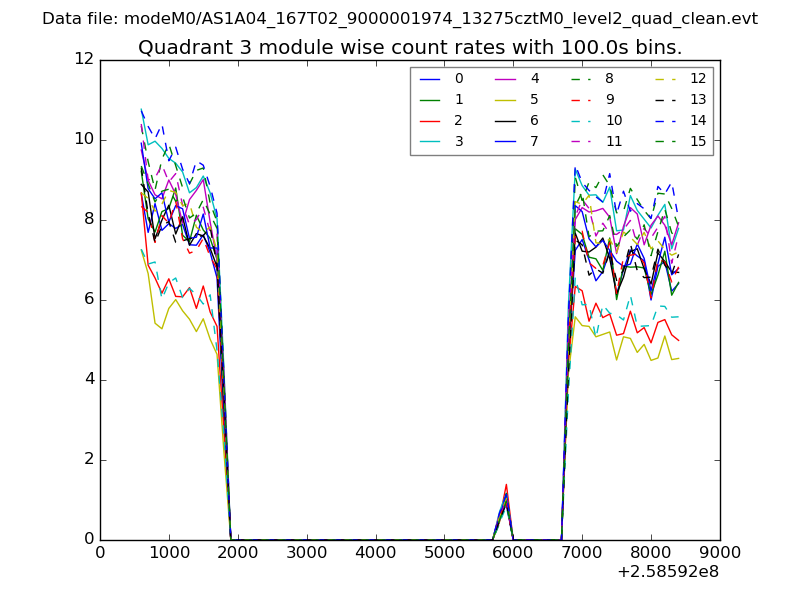
| Module-wise count rates for Quadrant C Data is divided into 100 sec bins |
 |
 |
| Module-wise count rates for Quadrant D Data is divided into 100 sec bins |
 |
 |
| Parameter | Plot |
|---|---|
| CZT HV Monitor | 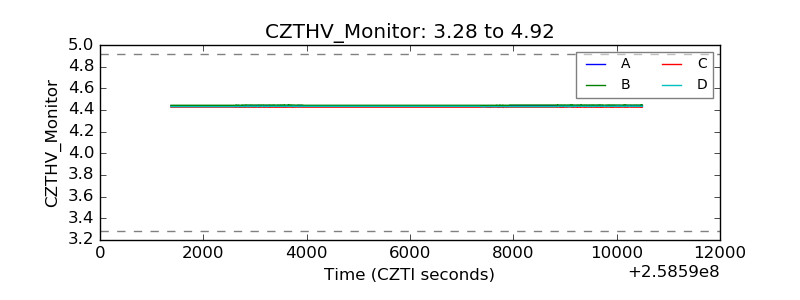 |
| D_VDD | 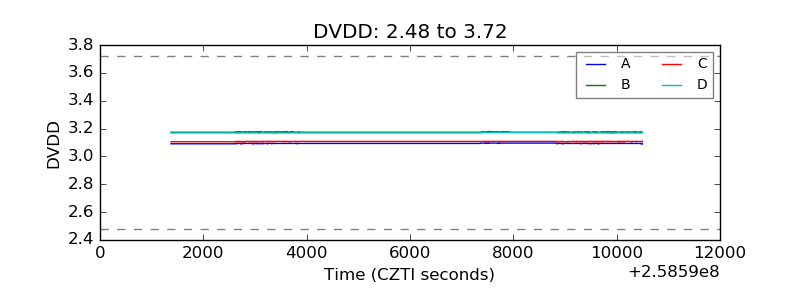 |
| Temperature 1 | 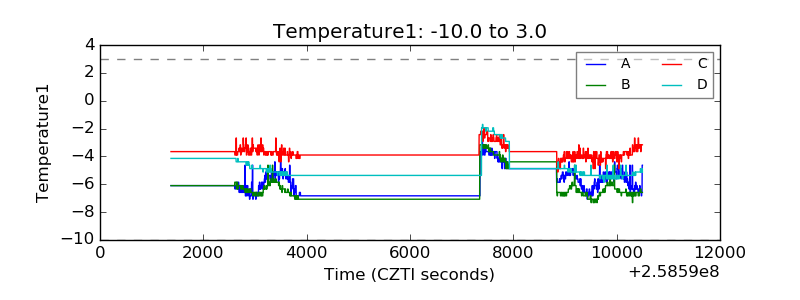 |
| Veto HV Monitor | 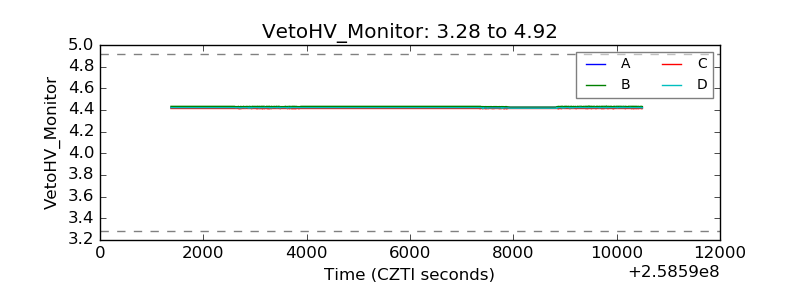 |
| Veto LLD | 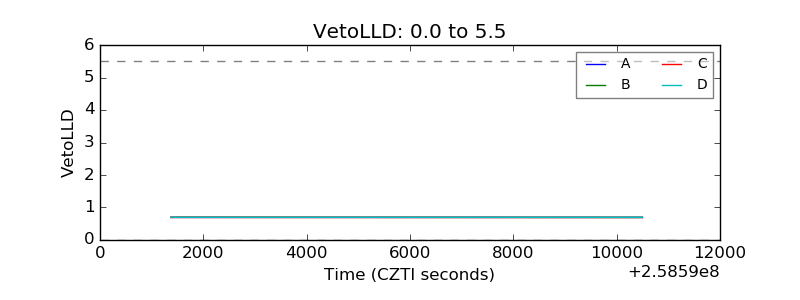 |
| Alpha Counter | 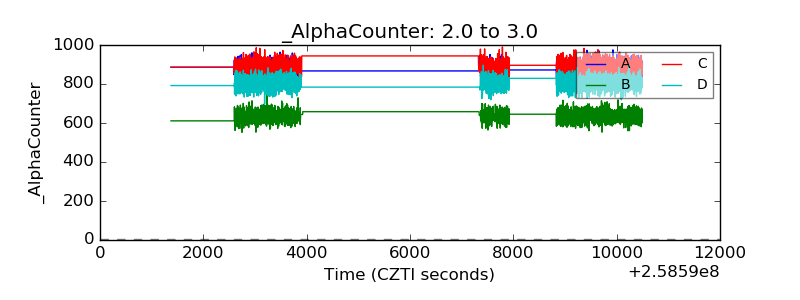 |
| _CPM_Rate | 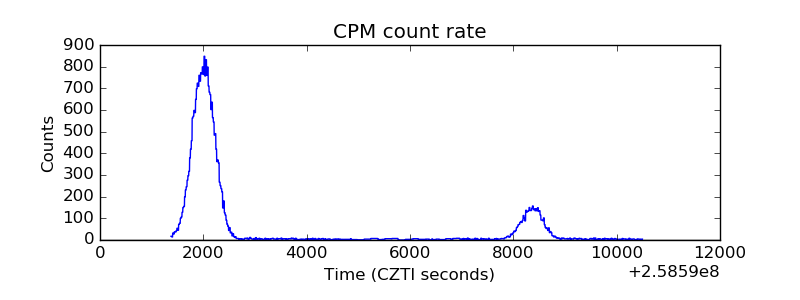 |
| CZT Counter | 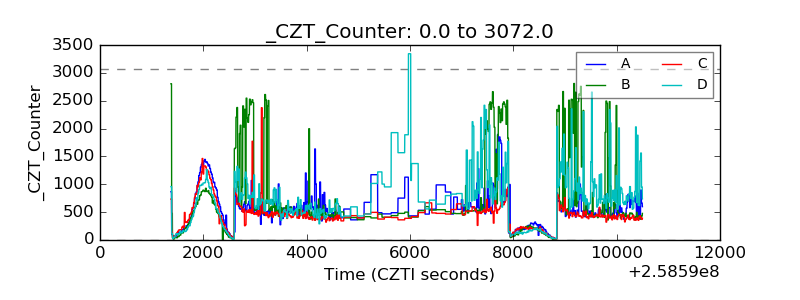 |
| +2.5 Volts monitor |  |
| +5 Volts monitor |  |
| _ROLL_ROT | 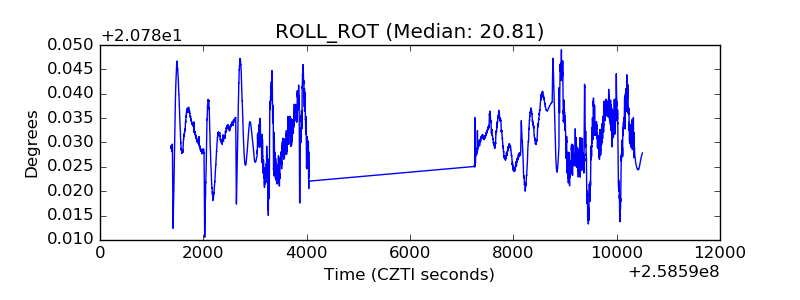 |
| _Roll_DEC | 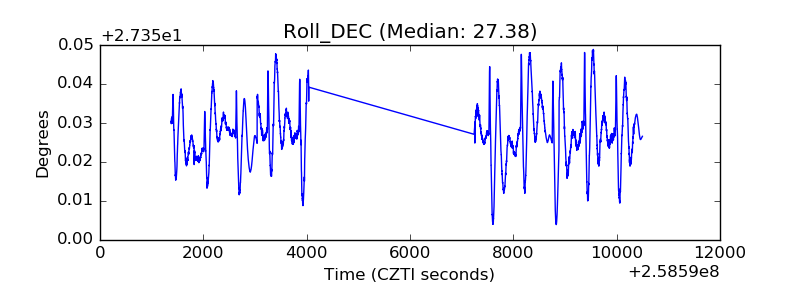 |
| _Roll_RA | 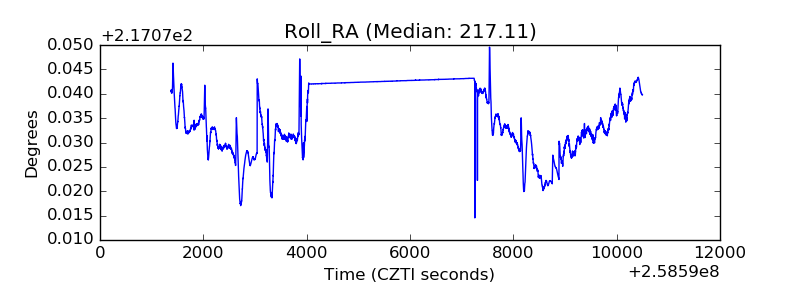 |
| Veto Counter | 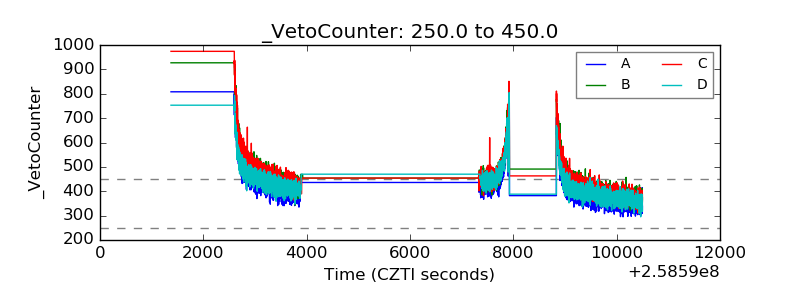 |