| Param | Original file | Final file |
|---|---|---|
| Filename | modeM0/AS1A04_167T02_9000001974_13276cztM0_level2.evt | modeM0/AS1A04_167T02_9000001974_13276cztM0_level2_quad_clean.evt |
| Size (bytes) | 951,321,600 | 115,156,800 |
| Size | 907.3 MB | 109.8 MB |
| Events in quadrant A | 6,550,605 | 705,366 |
| Events in quadrant B | 6,742,912 | 685,347 |
| Events in quadrant C | 4,603,103 | 742,102 |
| Events in quadrant D | 10,236,144 | 658,230 |
| Mode SS | |||
|---|---|---|---|
| Quadrant | BADHDUFLAG | Total packets | Discarded packets |
| A | 0 | 258 | 46 |
| B | 0 | 259 | 47 |
| C | 0 | 256 | 52 |
| D | 0 | 258 | 49 |
| Mode M0 | |||
|---|---|---|---|
| Quadrant | BADHDUFLAG | Total packets | Discarded packets |
| A | 0 | 32599 | 6359 |
| B | 0 | 33367 | 6690 |
| C | 0 | 26189 | 5487 |
| D | 0 | 48668 | 11316 |
| Mode M9 | |||
|---|---|---|---|
| Quadrant | BADHDUFLAG | Total packets | Discarded packets |
| A | 0 | 15 | 4 |
| B | 0 | 19 | 7 |
| C | 0 | 15 | 5 |
| D | 0 | 13 | 2 |
| Quadrant | Total seconds | Saturated seconds | Saturation percentage |
|---|---|---|---|
| A | 10046 | 201 | 2.000796% |
| B | 10060 | 918 | 9.125249% |
| C | 10116 | 34 | 0.336101% |
| D | 9889 | 1327 | 13.418950% |
Noise dominated data is calculated using 1-second bins in cleaned event files. If a bin has >2000 counts, and if more than 50% of those come from <1% of pixels, then it is considered to be noise-dominated and hence unusable.
| Quadrant | # 1 sec bins | Bins with >0 counts | Bins with >2000 counts | High rate bins dominated by noise | Noise dominated (total time) | Noise dominated (detector-on time) | Marked lightcurve |
|---|---|---|---|---|---|---|---|
| A | 13911 | 10317 | 79 | 79 | 0.57% | 0.77% | 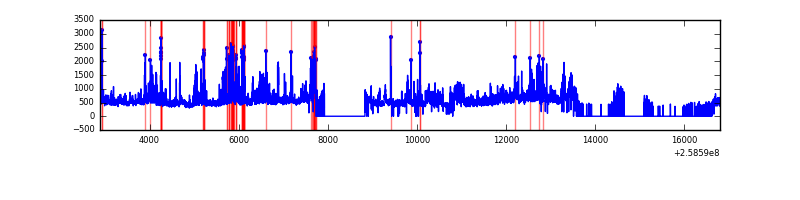 |
| B | 13911 | 10325 | 577 | 577 | 4.15% | 5.59% | 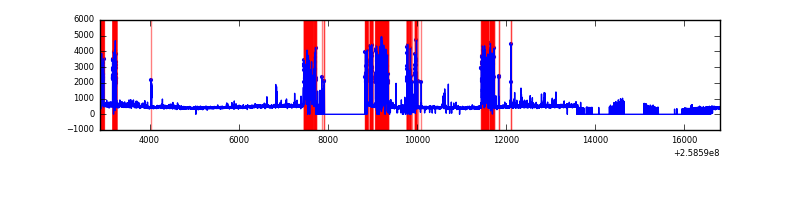 |
| C | 13911 | 10402 | 7 | 7 | 0.05% | 0.07% | 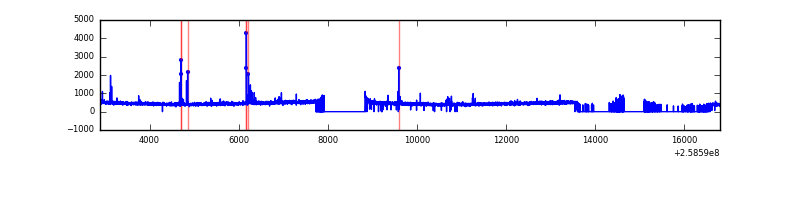 |
| D | 13911 | 10092 | 931 | 931 | 6.69% | 9.23% | 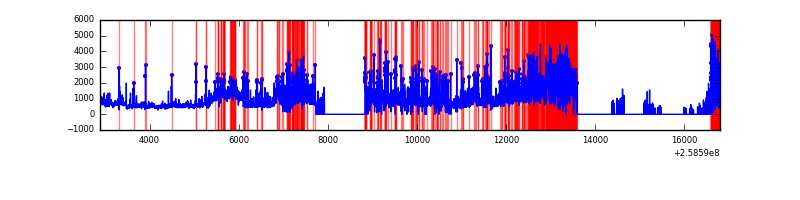 |
Top three noisy pixels from each quadrant. If the there are fewer than three noisy pixels in the level2.evt file, extra rows are filled as -1
| Pixel properties | Quadrant properties | ||||||
|---|---|---|---|---|---|---|---|
| Quadrant | DetID | PixID | Counts | Sigma | Mean | Median | Sigma |
| A | 15 | 239 | 1315748 | 5572.42 | 1167 | 1142 | 235.9 |
| A | 8 | 15 | 670505 | 2837.33 | 1167 | 1142 | 235.9 |
| A | 1 | 162 | 37818 | 155.46 | 1167 | 1142 | 235.9 |
| B | 4 | 239 | 2105481 | 9974.02 | 1112 | 1087 | 211.0 |
| B | 0 | 244 | 105103 | 493.0 | 1112 | 1087 | 211.0 |
| B | 3 | 64 | 42122 | 194.49 | 1112 | 1087 | 211.0 |
| C | 14 | 234 | 42836 | 156.67 | 1155 | 1162 | 266.0 |
| C | 15 | 208 | 32145 | 116.48 | 1155 | 1162 | 266.0 |
| C | 6 | 96 | 26542 | 95.41 | 1155 | 1162 | 266.0 |
| D | 1 | 52 | 4291681 | 17052.43 | 1046 | 1016 | 251.6 |
| D | 13 | 249 | 1835152 | 7289.42 | 1046 | 1016 | 251.6 |
| D | 5 | 222 | 44115 | 171.29 | 1046 | 1016 | 251.6 |
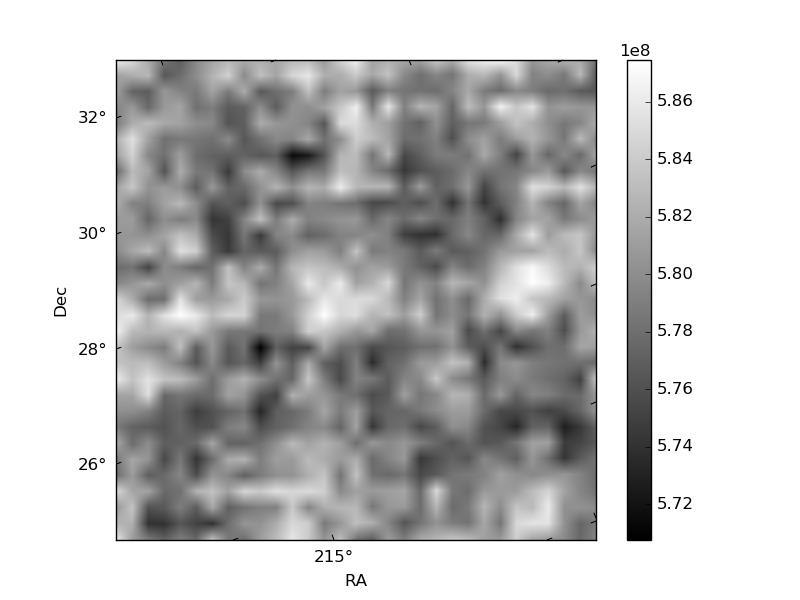
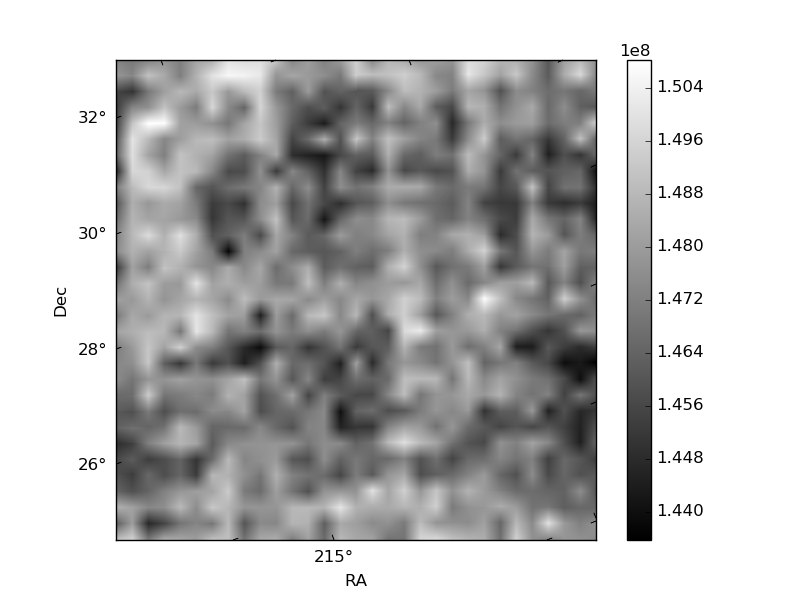
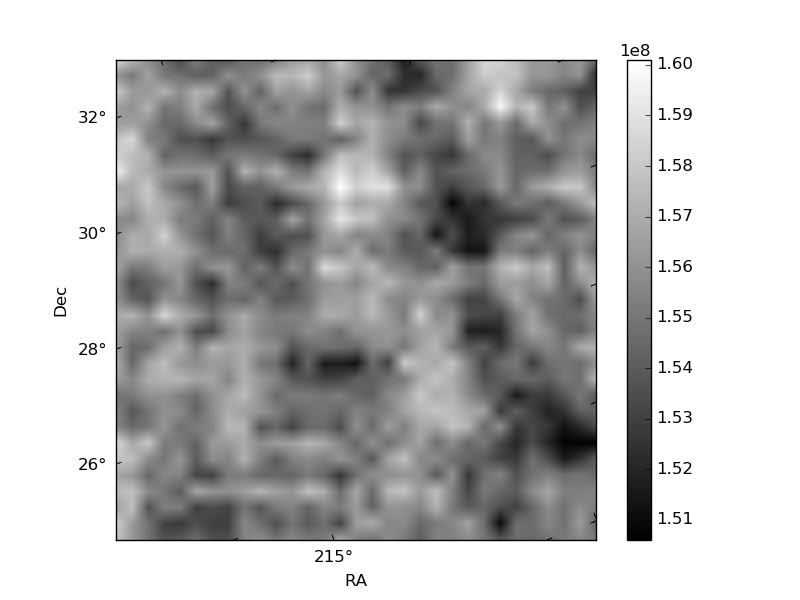
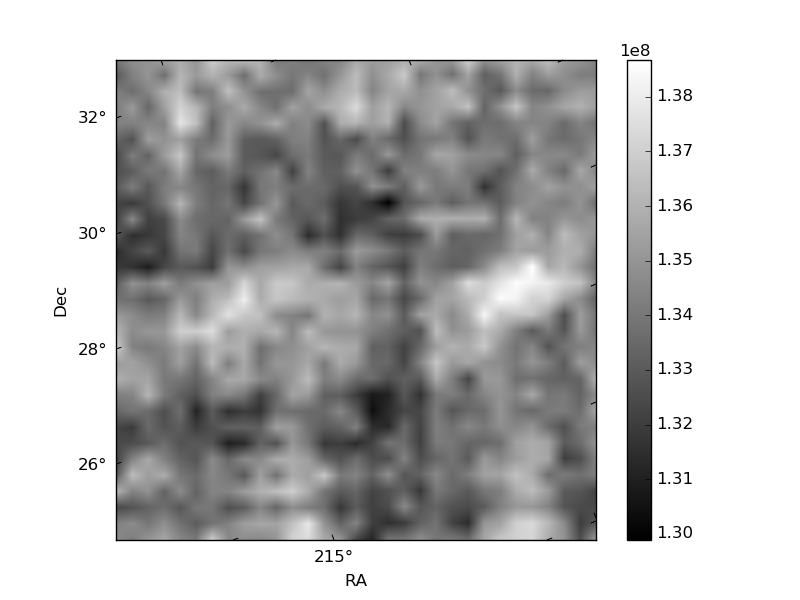
Histogram calculated using DETX and DETY for each event in the final _common_clean file
| Quadrant A | 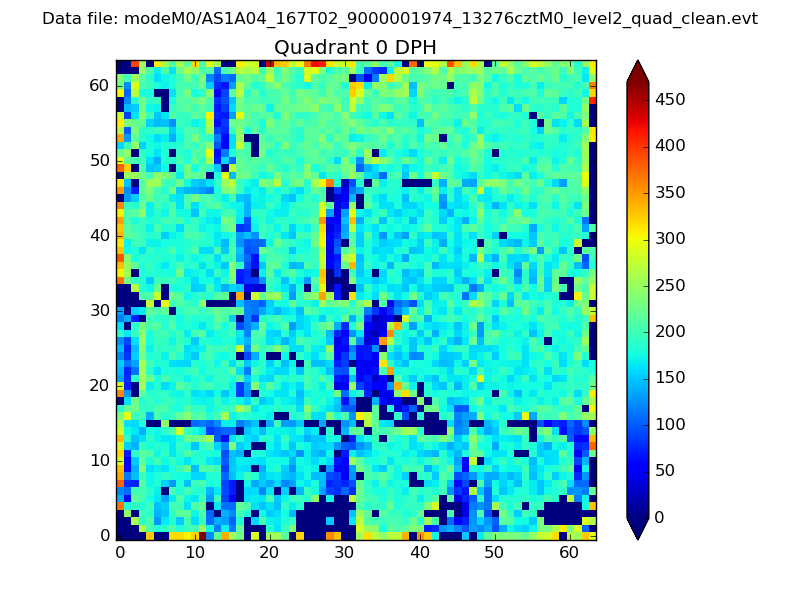 |
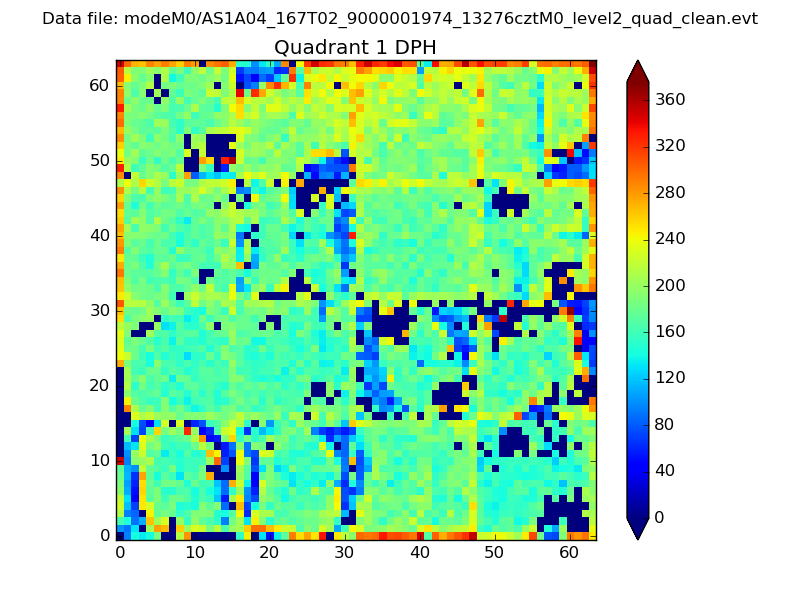 |
Quadrant B |
|---|---|---|---|
| Quadrant D |  |
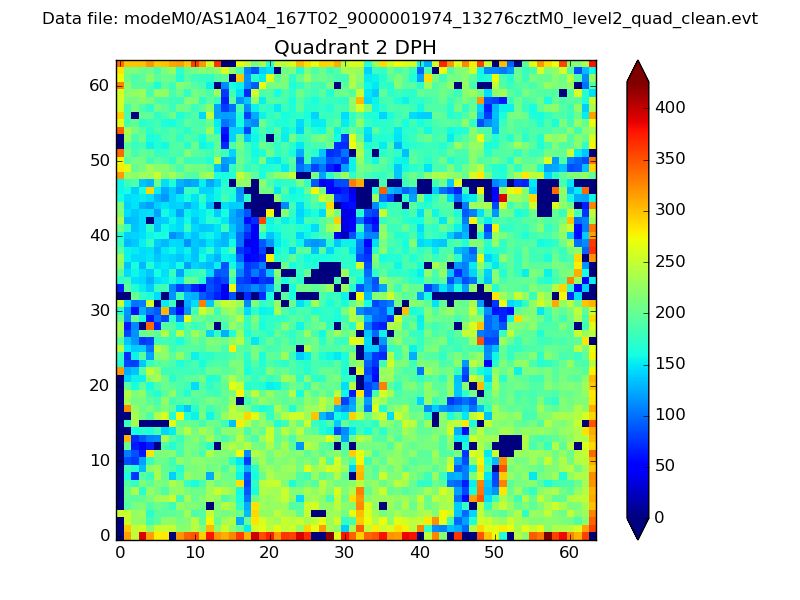 |
Quadrant C |
| Plot type | Count rate plots | Images |
|---|---|---|
| Comparison with Poisson distribution Blue bars denote a histogram of data divided into 1 sec bins. Red curve is a Poisson curve with rate = median count rate of data. |
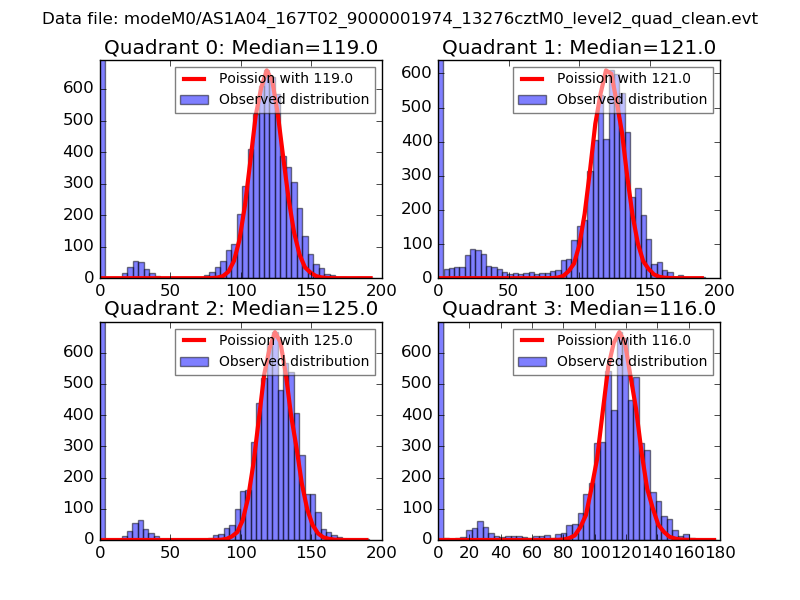 |
 |
| Quadrant-wise count rates Data is divided into 100 sec bins |
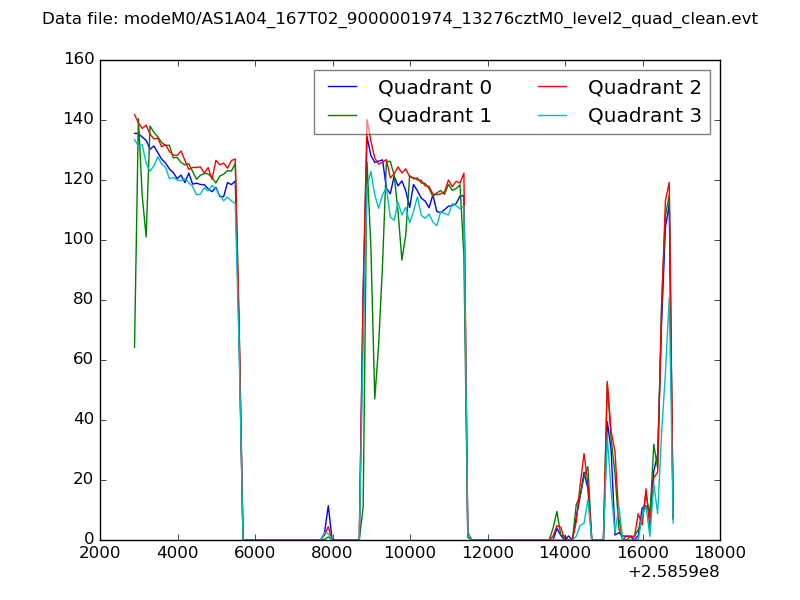 |
|
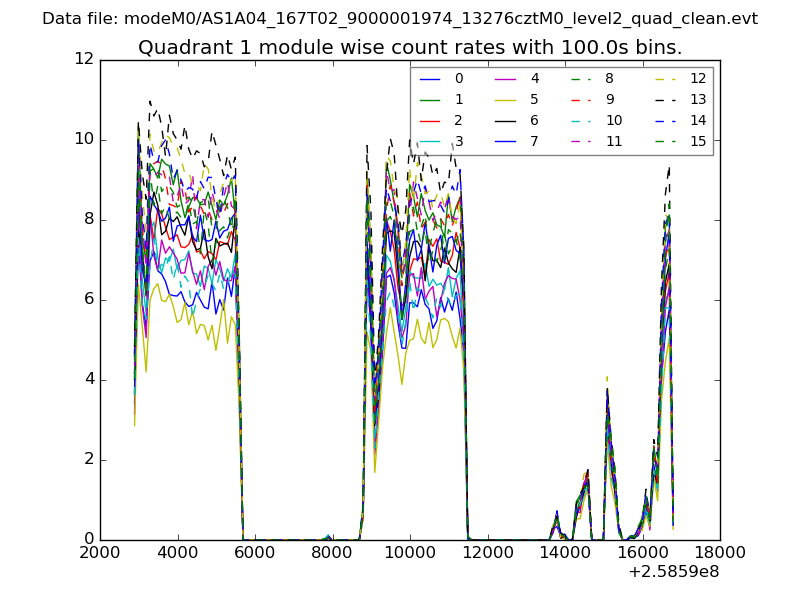
| Module-wise count rates for Quadrant A Data is divided into 100 sec bins |
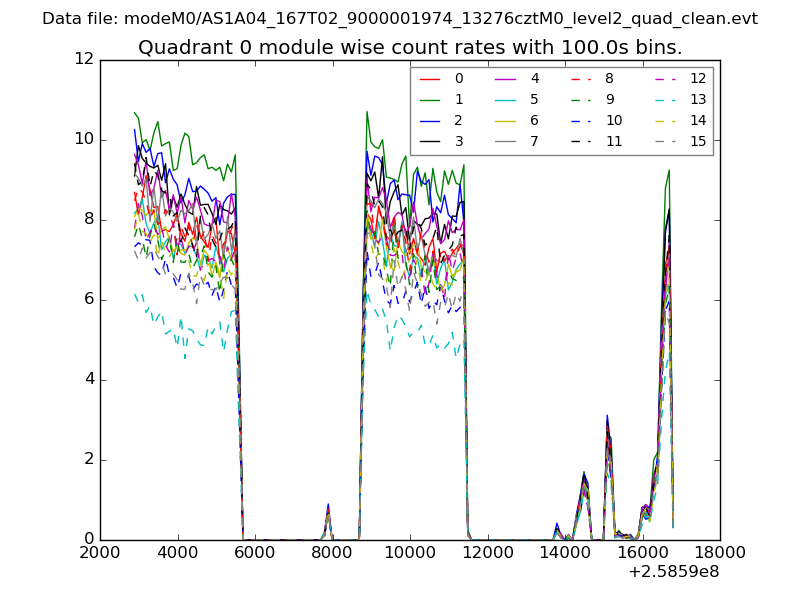 |
 |
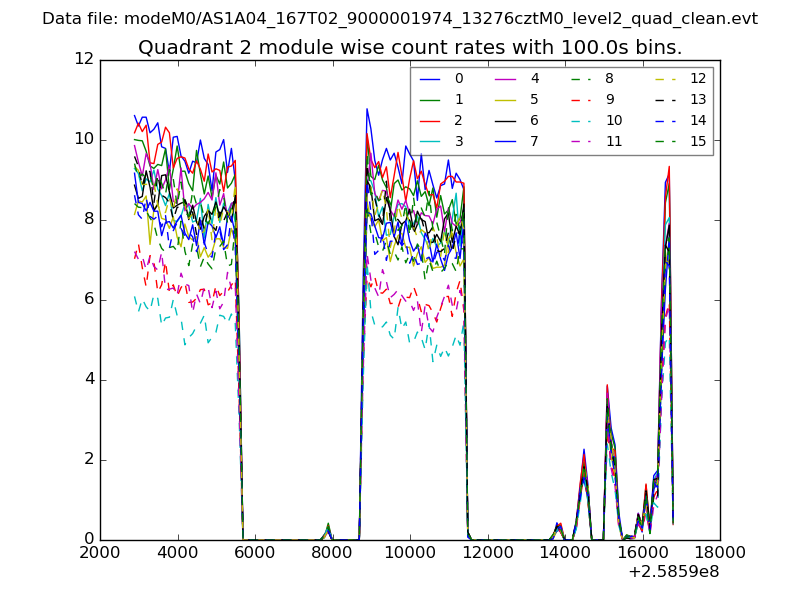
| Module-wise count rates for Quadrant B Data is divided into 100 sec bins |
 |
 |
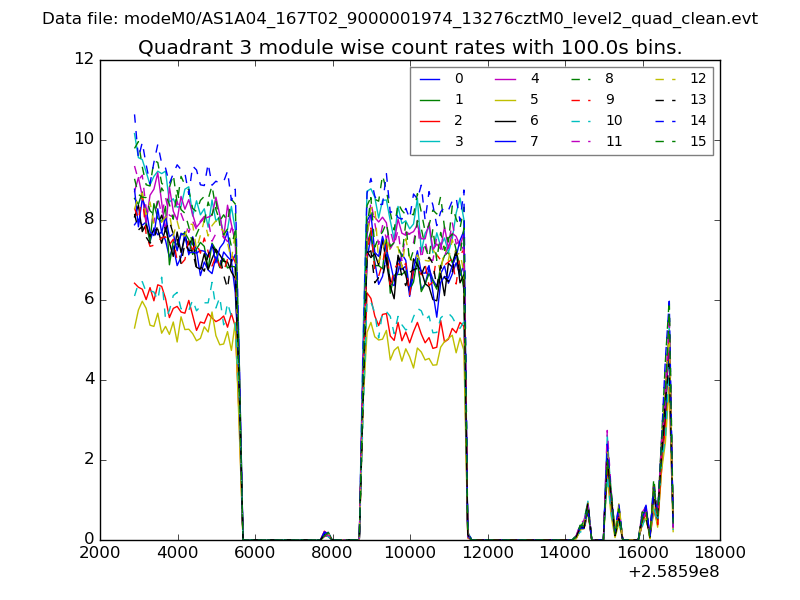
| Module-wise count rates for Quadrant C Data is divided into 100 sec bins |
 |
 |
| Module-wise count rates for Quadrant D Data is divided into 100 sec bins |
 |
 |
| Parameter | Plot |
|---|---|
| CZT HV Monitor | 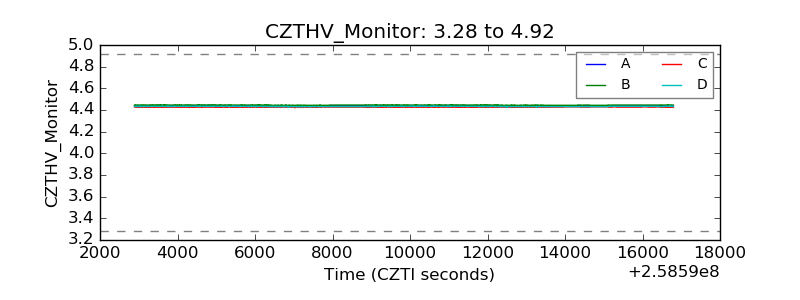 |
| D_VDD | 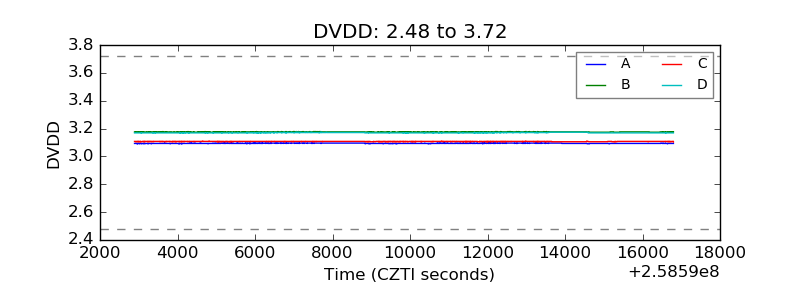 |
| Temperature 1 | 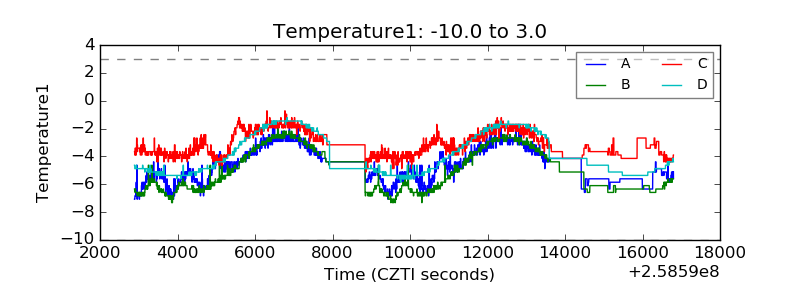 |
| Veto HV Monitor | 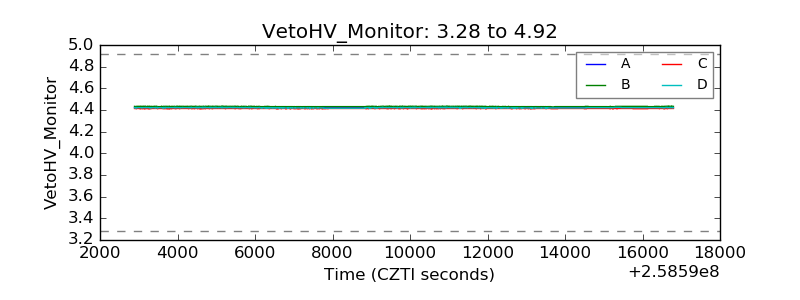 |
| Veto LLD | 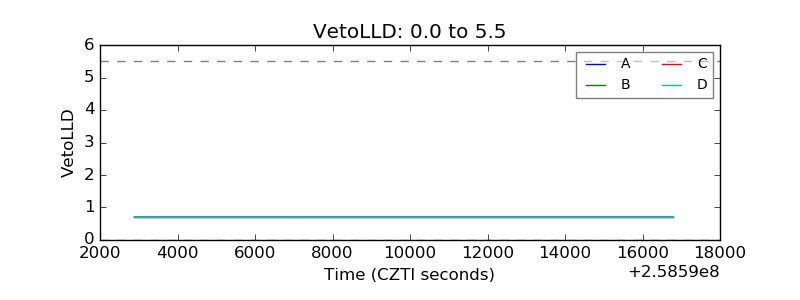 |
| Alpha Counter | 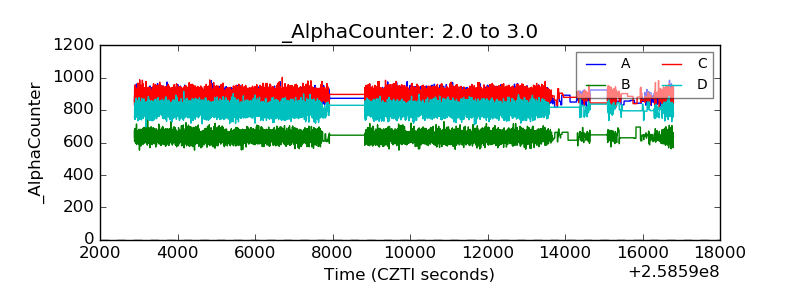 |
| _CPM_Rate | 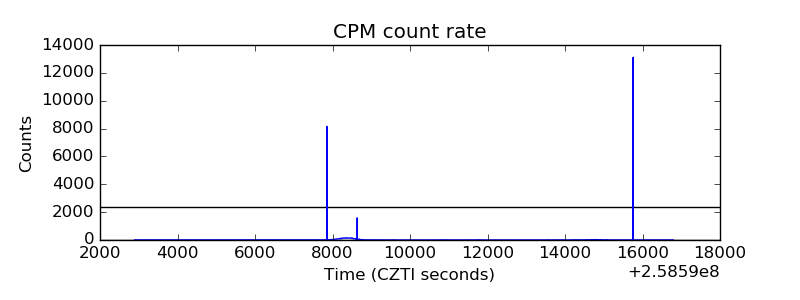 |
| CZT Counter | 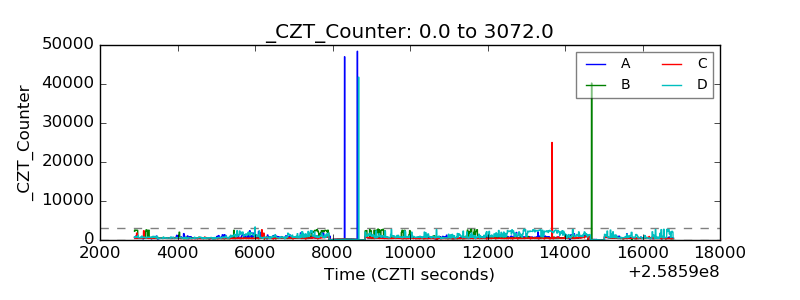 |
| +2.5 Volts monitor |  |
| +5 Volts monitor |  |
| _ROLL_ROT | 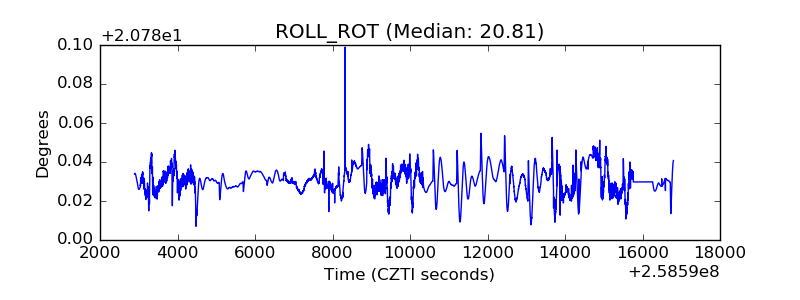 |
| _Roll_DEC | 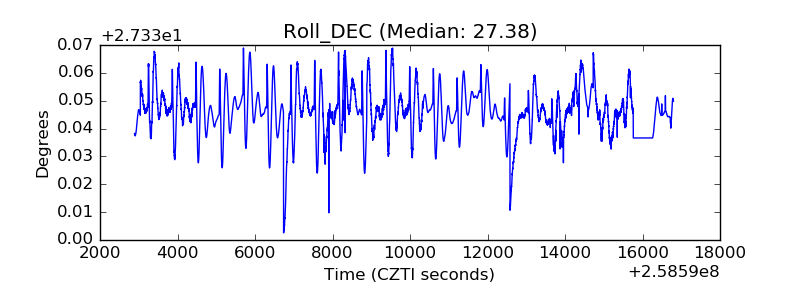 |
| _Roll_RA | 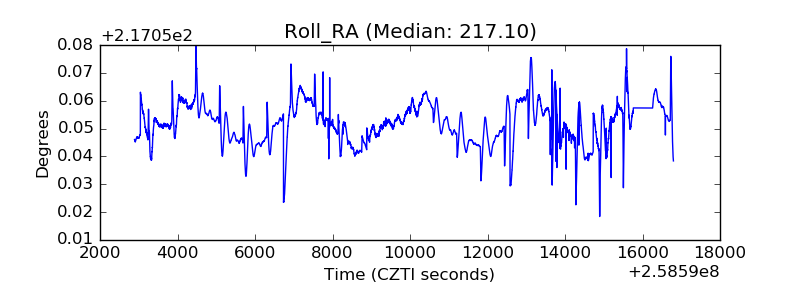 |
| Veto Counter | 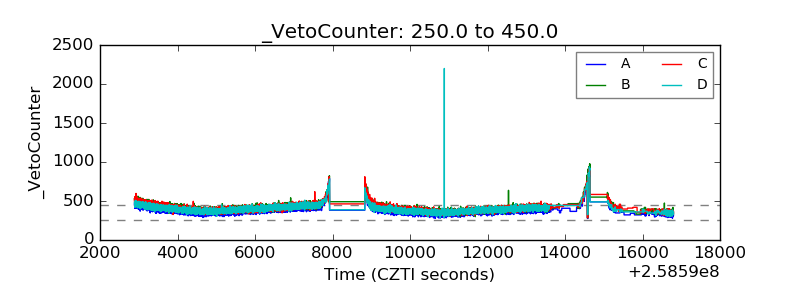 |