| Param | Original file | Final file |
|---|---|---|
| Filename | modeM0/AS1A04_167T02_9000001974_13281cztM0_level2.evt | modeM0/AS1A04_167T02_9000001974_13281cztM0_level2_quad_clean.evt |
| Size (bytes) | 874,008,000 | 106,283,520 |
| Size | 833.5 MB | 101.4 MB |
| Events in quadrant A | 4,682,148 | 650,121 |
| Events in quadrant B | 7,419,230 | 606,526 |
| Events in quadrant C | 4,454,088 | 671,916 |
| Events in quadrant D | 9,247,568 | 606,766 |
| Mode SS | |||
|---|---|---|---|
| Quadrant | BADHDUFLAG | Total packets | Discarded packets |
| A | 0 | 202 | 0 |
| B | 0 | 202 | 0 |
| C | 0 | 202 | 0 |
| D | 0 | 202 | 0 |
| Mode M0 | |||
|---|---|---|---|
| Quadrant | BADHDUFLAG | Total packets | Discarded packets |
| A | 0 | 20346 | 2 |
| B | 0 | 28333 | 2 |
| C | 0 | 20115 | 2 |
| D | 0 | 34208 | 2 |
| Mode M9 | |||
|---|---|---|---|
| Quadrant | BADHDUFLAG | Total packets | Discarded packets |
| A | 0 | 6 | 0 |
| B | 0 | 6 | 0 |
| C | 0 | 6 | 0 |
| D | 0 | 6 | 0 |
| Quadrant | Total seconds | Saturated seconds | Saturation percentage |
|---|---|---|---|
| A | 9842 | 175 | 1.778094% |
| B | 9842 | 1753 | 17.811420% |
| C | 9842 | 92 | 0.934769% |
| D | 9842 | 999 | 10.150376% |
Noise dominated data is calculated using 1-second bins in cleaned event files. If a bin has >2000 counts, and if more than 50% of those come from <1% of pixels, then it is considered to be noise-dominated and hence unusable.
| Quadrant | # 1 sec bins | Bins with >0 counts | Bins with >2000 counts | High rate bins dominated by noise | Noise dominated (total time) | Noise dominated (detector-on time) | Marked lightcurve |
|---|---|---|---|---|---|---|---|
| A | 10498 | 9845 | 6 | 6 | 0.06% | 0.06% | 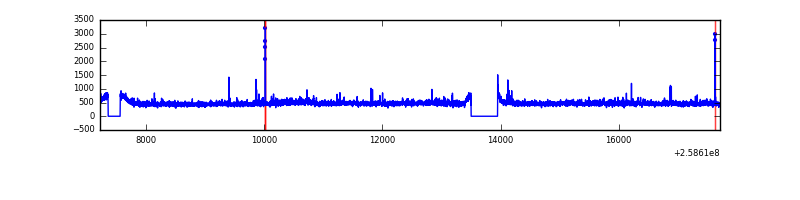 |
| B | 10497 | 9844 | 708 | 708 | 6.74% | 7.19% | 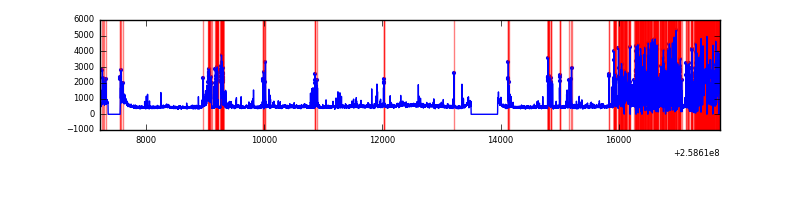 |
| C | 10498 | 9845 | 1 | 1 | 0.01% | 0.01% | 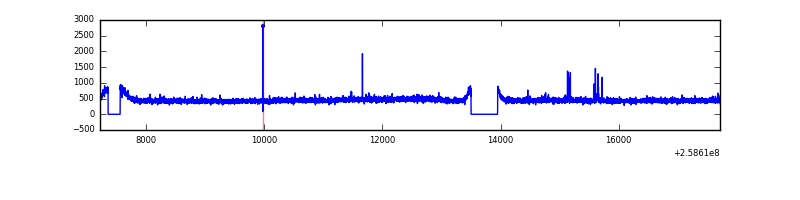 |
| D | 10498 | 9845 | 739 | 739 | 7.04% | 7.51% | 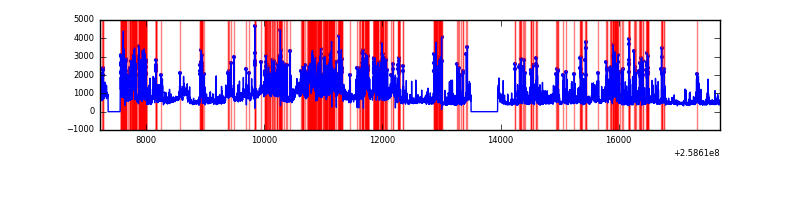 |
Top three noisy pixels from each quadrant. If the there are fewer than three noisy pixels in the level2.evt file, extra rows are filled as -1
| Pixel properties | Quadrant properties | ||||||
|---|---|---|---|---|---|---|---|
| Quadrant | DetID | PixID | Counts | Sigma | Mean | Median | Sigma |
| A | 1 | 162 | 64553 | 267.68 | 1160 | 1133 | 236.9 |
| A | 8 | 15 | 56663 | 234.38 | 1160 | 1133 | 236.9 |
| A | 15 | 69 | 31793 | 129.41 | 1160 | 1133 | 236.9 |
| B | 4 | 239 | 2855377 | 14588.71 | 1013 | 984 | 195.7 |
| B | 3 | 64 | 213917 | 1088.29 | 1013 | 984 | 195.7 |
| B | 10 | 245 | 145028 | 736.2 | 1013 | 984 | 195.7 |
| C | 14 | 234 | 18840 | 67.52 | 1132 | 1135 | 262.2 |
| C | 15 | 208 | 17712 | 63.22 | 1132 | 1135 | 262.2 |
| C | 13 | 61 | 8015 | 26.24 | 1132 | 1135 | 262.2 |
| D | 13 | 249 | 2435863 | 9304.85 | 1087 | 1056 | 261.7 |
| D | 1 | 52 | 2289260 | 8744.59 | 1087 | 1056 | 261.7 |
| D | 8 | 195 | 354345 | 1350.13 | 1087 | 1056 | 261.7 |
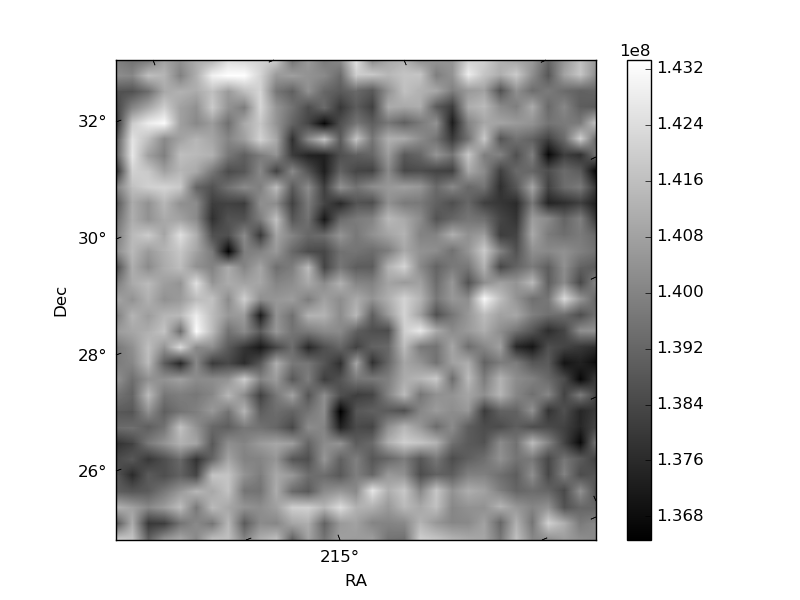
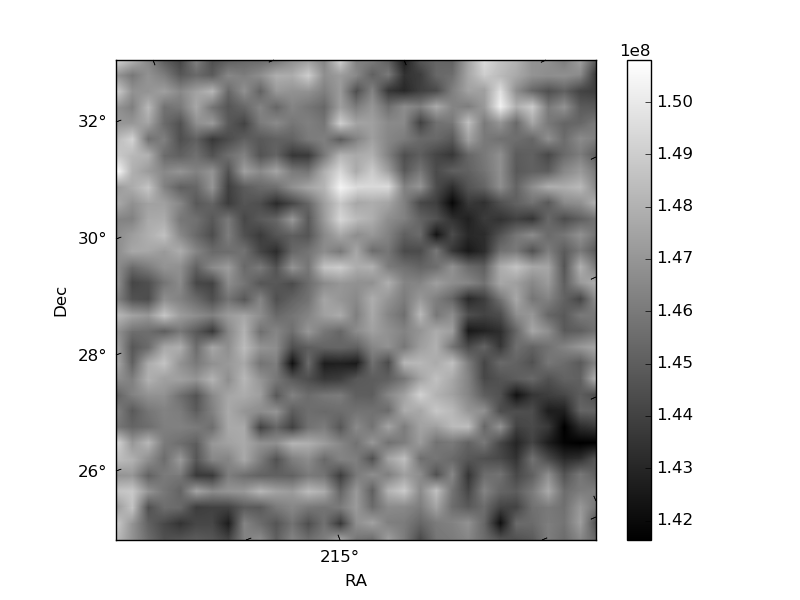
Histogram calculated using DETX and DETY for each event in the final _common_clean file
| Quadrant A | 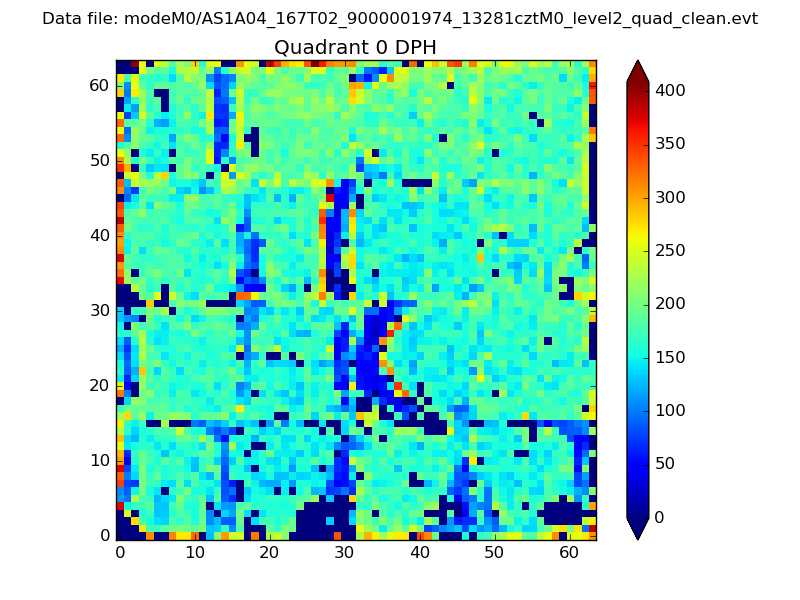 |
 |
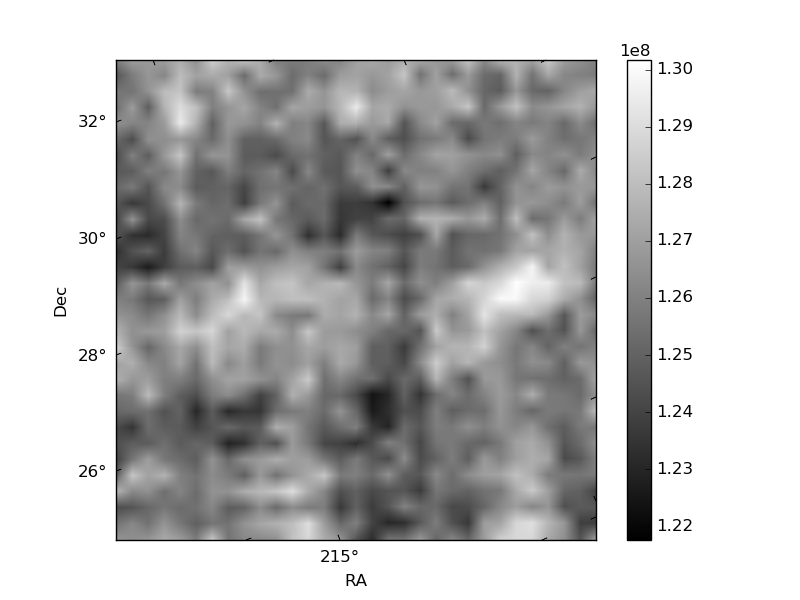
Quadrant B |
|---|---|---|---|
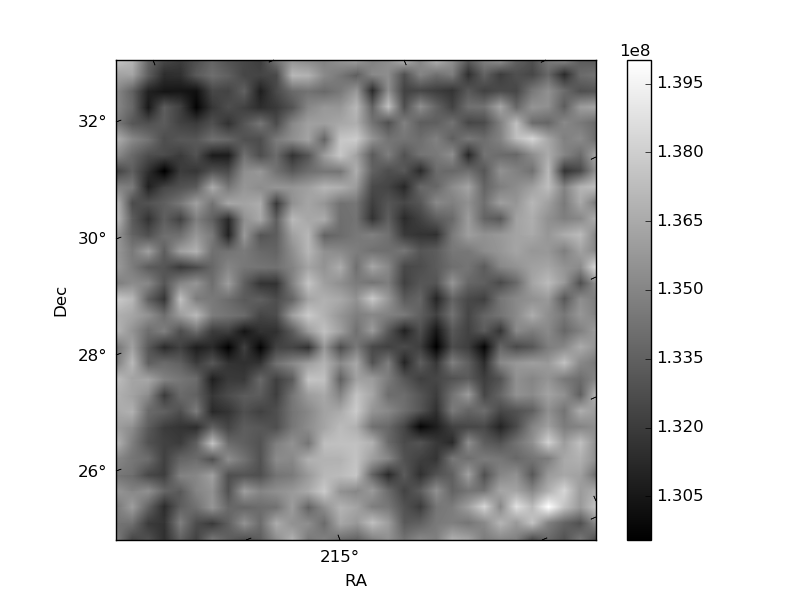
| Quadrant D |  |
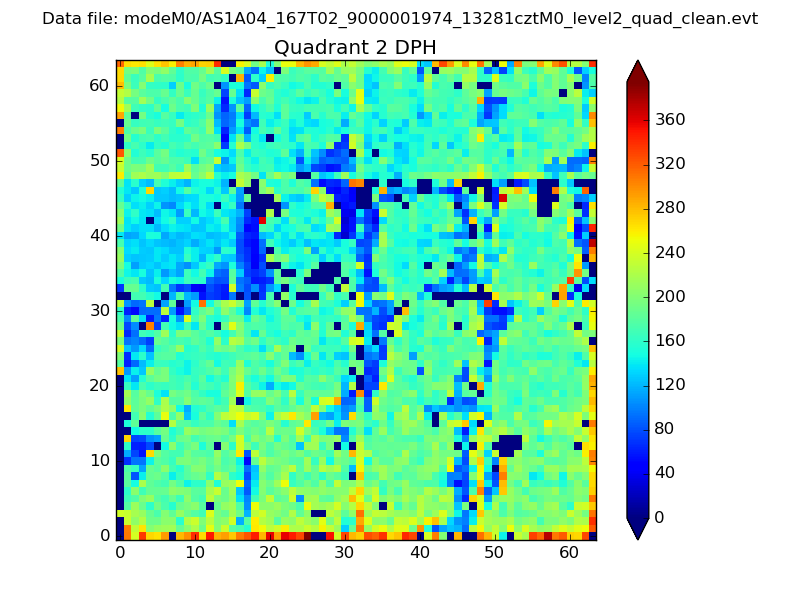 |
Quadrant C |
| Plot type | Count rate plots | Images |
|---|---|---|
| Comparison with Poisson distribution Blue bars denote a histogram of data divided into 1 sec bins. Red curve is a Poisson curve with rate = median count rate of data. |
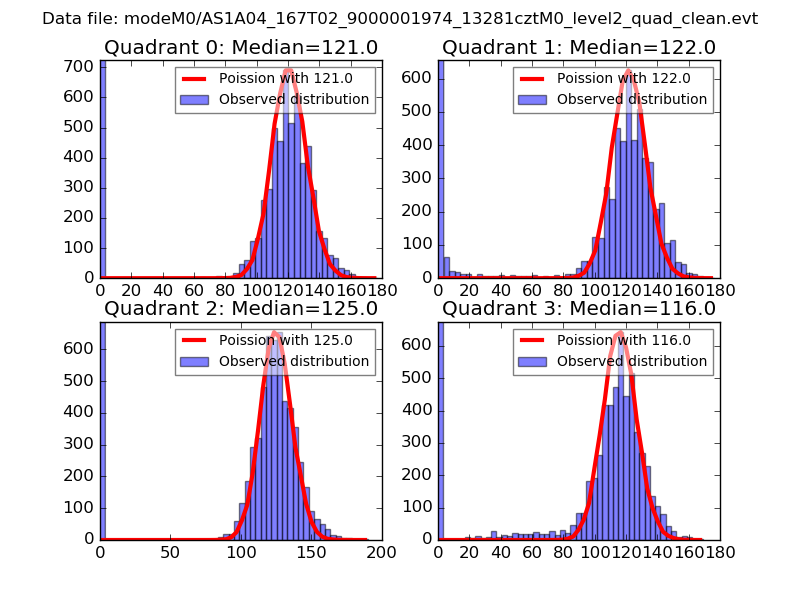 |
 |
| Quadrant-wise count rates Data is divided into 100 sec bins |
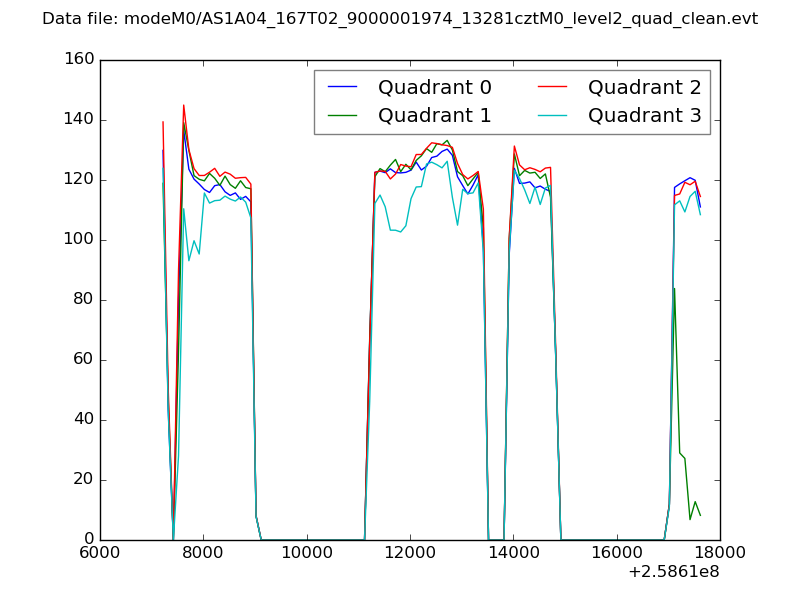 |
|
| Module-wise count rates for Quadrant A Data is divided into 100 sec bins |
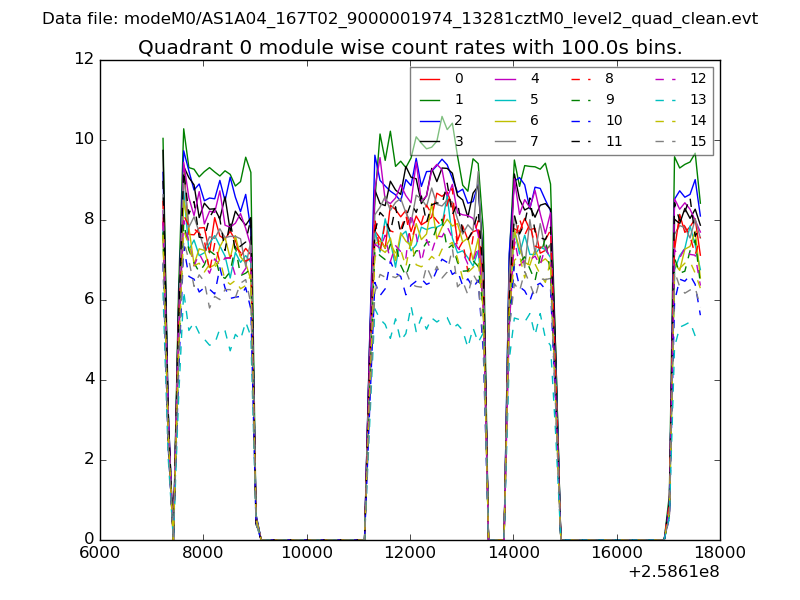 |
 |
| Module-wise count rates for Quadrant B Data is divided into 100 sec bins |
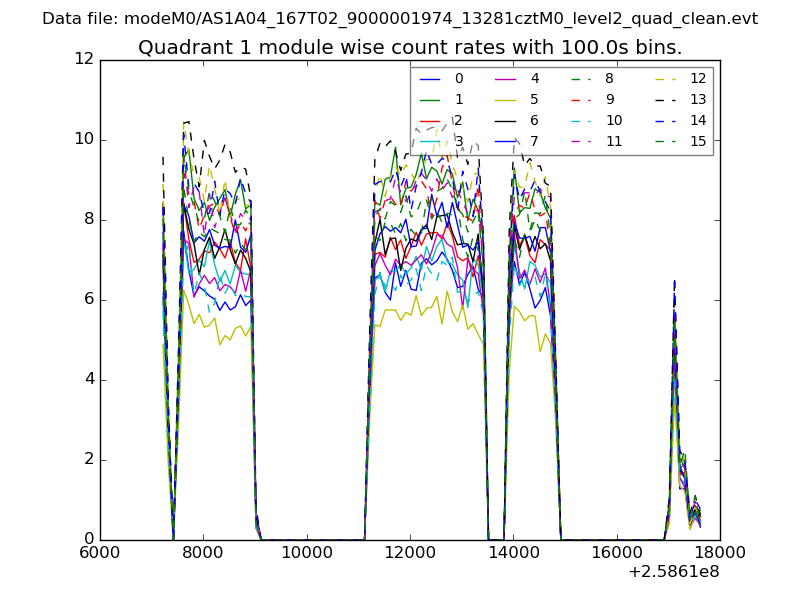 |
 |
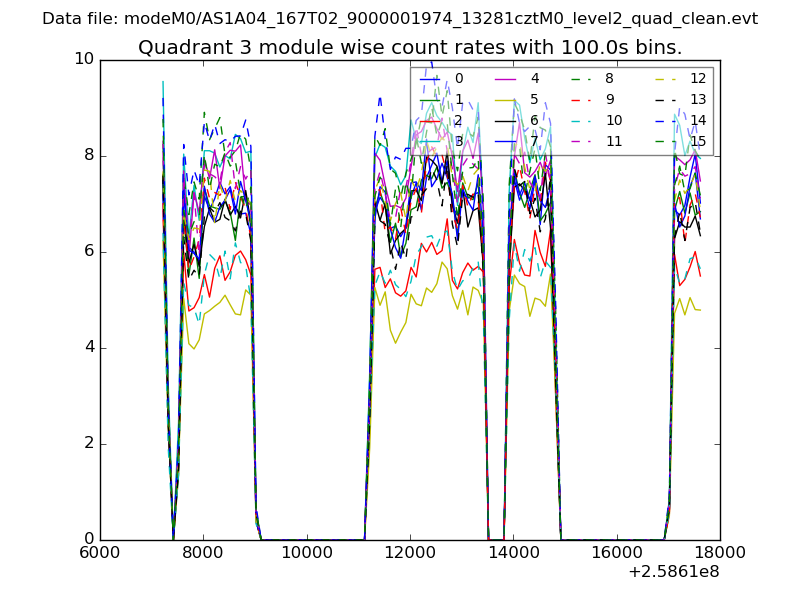
| Module-wise count rates for Quadrant C Data is divided into 100 sec bins |
 |
 |
| Module-wise count rates for Quadrant D Data is divided into 100 sec bins |
 |
 |
| Parameter | Plot |
|---|---|
| CZT HV Monitor | 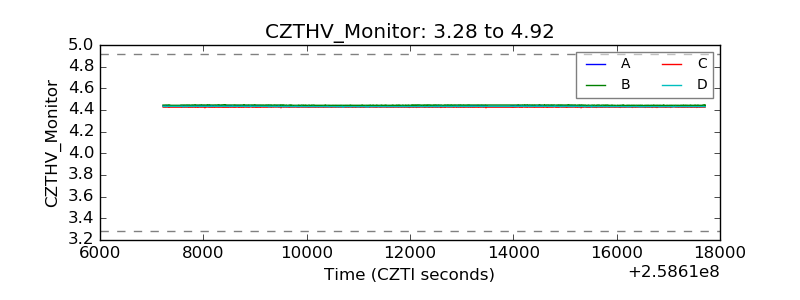 |
| D_VDD | 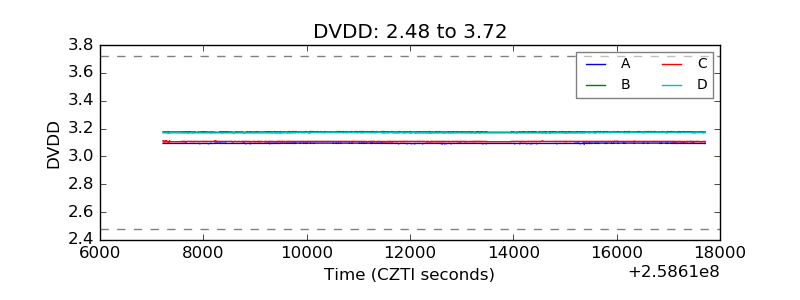 |
| Temperature 1 | 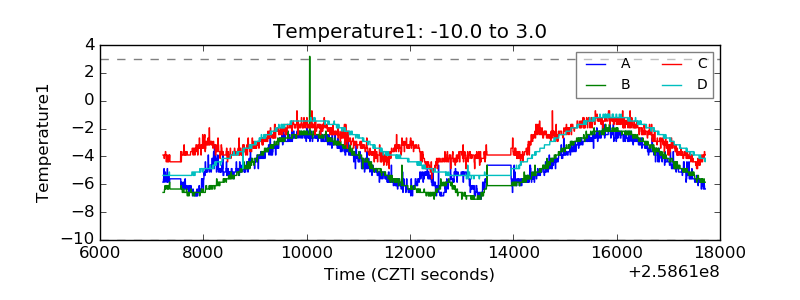 |
| Veto HV Monitor | 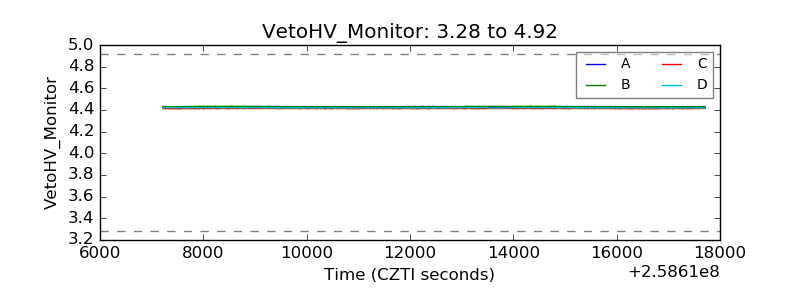 |
| Veto LLD | 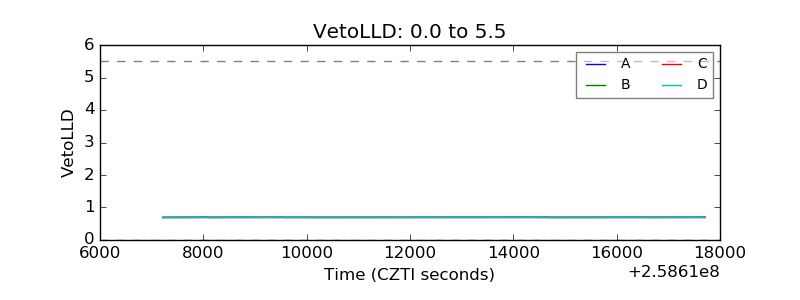 |
| Alpha Counter | 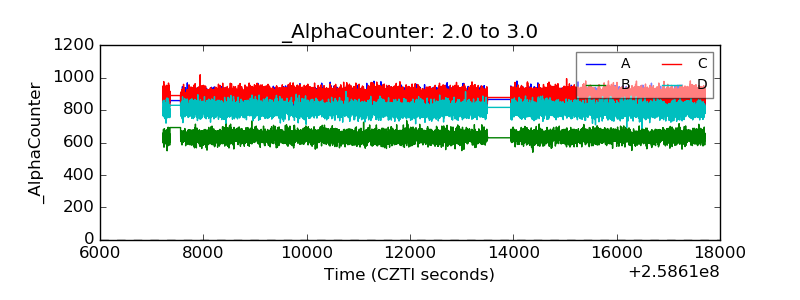 |
| _CPM_Rate | 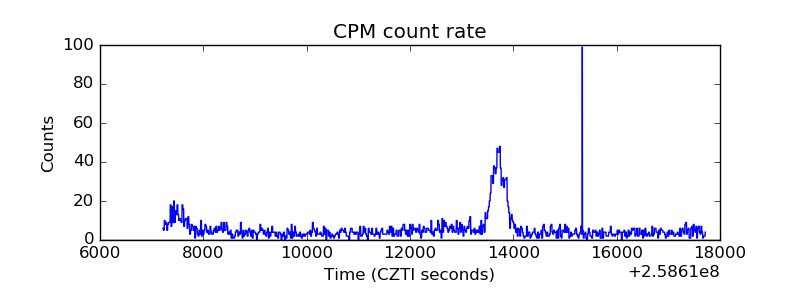 |
| CZT Counter | 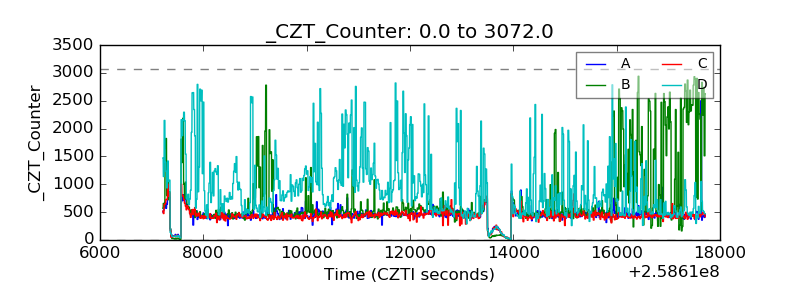 |
| +2.5 Volts monitor |  |
| +5 Volts monitor |  |
| _ROLL_ROT | 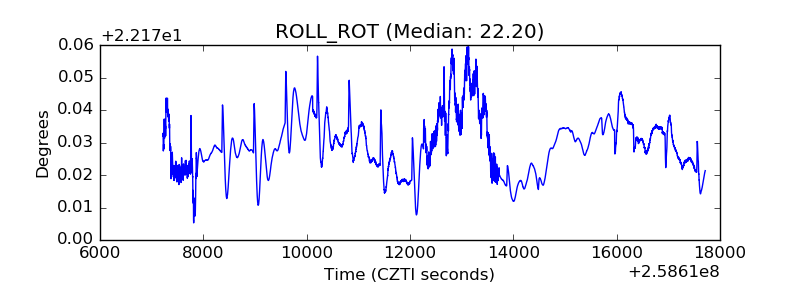 |
| _Roll_DEC | 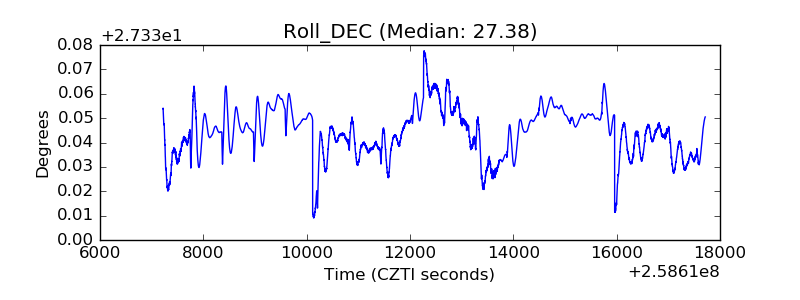 |
| _Roll_RA | 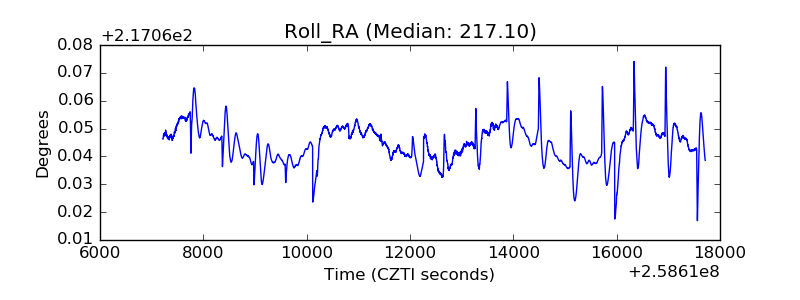 |
| Veto Counter |  |