| Param | Original file | Final file |
|---|---|---|
| Filename | modeM0/AS1A04_167T02_9000001974_13282cztM0_level2.evt | modeM0/AS1A04_167T02_9000001974_13282cztM0_level2_quad_clean.evt |
| Size (bytes) | 1,769,797,440 | 198,322,560 |
| Size | 1.6 GB | 189.1 MB |
| Events in quadrant A | 8,540,097 | 1,261,251 |
| Events in quadrant B | 16,046,720 | 1,127,168 |
| Events in quadrant C | 7,812,278 | 1,304,031 |
| Events in quadrant D | 20,048,519 | 1,133,759 |
| Mode SS | |||
|---|---|---|---|
| Quadrant | BADHDUFLAG | Total packets | Discarded packets |
| A | 0 | 344 | 0 |
| B | 0 | 344 | 0 |
| C | 0 | 344 | 0 |
| D | 0 | 344 | 0 |
| Mode M0 | |||
|---|---|---|---|
| Quadrant | BADHDUFLAG | Total packets | Discarded packets |
| A | 0 | 36540 | 3 |
| B | 0 | 58992 | 2 |
| C | 0 | 34979 | 2 |
| D | 0 | 71740 | 2 |
| Mode M9 | |||
|---|---|---|---|
| Quadrant | BADHDUFLAG | Total packets | Discarded packets |
| A | 0 | 2 | 0 |
| B | 0 | 2 | 0 |
| C | 0 | 2 | 0 |
| D | 0 | 2 | 0 |
| Quadrant | Total seconds | Saturated seconds | Saturation percentage |
|---|---|---|---|
| A | 17089 | 307 | 1.796477% |
| B | 17089 | 4070 | 23.816490% |
| C | 17089 | 124 | 0.725613% |
| D | 17089 | 3057 | 17.888700% |
Noise dominated data is calculated using 1-second bins in cleaned event files. If a bin has >2000 counts, and if more than 50% of those come from <1% of pixels, then it is considered to be noise-dominated and hence unusable.
| Quadrant | # 1 sec bins | Bins with >0 counts | Bins with >2000 counts | High rate bins dominated by noise | Noise dominated (total time) | Noise dominated (detector-on time) | Marked lightcurve |
|---|---|---|---|---|---|---|---|
| A | 17310 | 17092 | 4 | 4 | 0.02% | 0.02% | 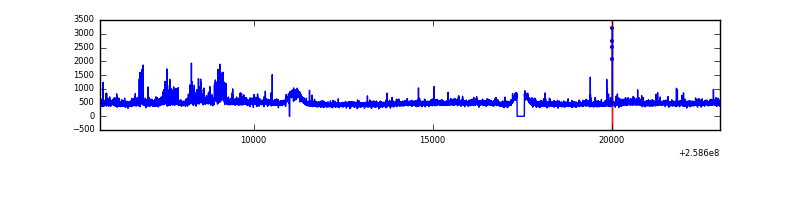 |
| B | 17310 | 17091 | 2549 | 2549 | 14.73% | 14.91% | 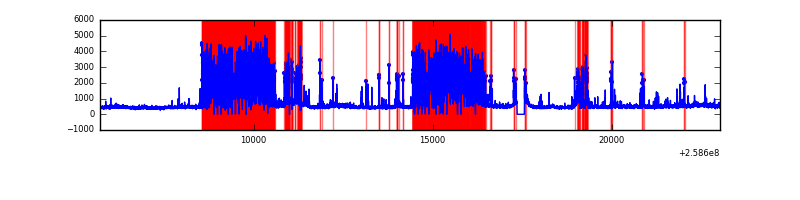 |
| C | 17310 | 17092 | 4 | 4 | 0.02% | 0.02% | 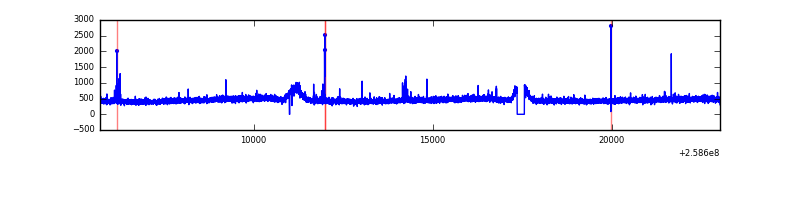 |
| D | 17310 | 17091 | 2357 | 2357 | 13.62% | 13.79% | 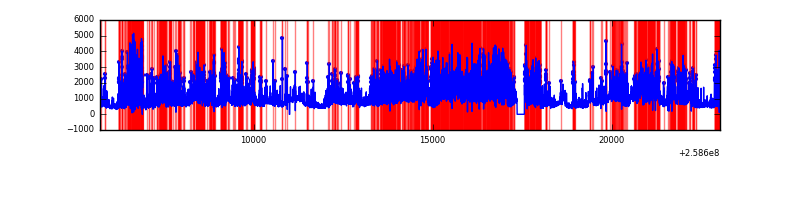 |
Top three noisy pixels from each quadrant. If the there are fewer than three noisy pixels in the level2.evt file, extra rows are filled as -1
| Pixel properties | Quadrant properties | ||||||
|---|---|---|---|---|---|---|---|
| Quadrant | DetID | PixID | Counts | Sigma | Mean | Median | Sigma |
| A | 15 | 239 | 432269 | 1041.4 | 2021 | 1972 | 413.2 |
| A | 8 | 15 | 155016 | 370.39 | 2021 | 1972 | 413.2 |
| A | 1 | 162 | 85614 | 202.43 | 2021 | 1972 | 413.2 |
| B | 4 | 239 | 8487508 | 26074.03 | 1702 | 1657 | 325.5 |
| B | 0 | 244 | 228384 | 696.65 | 1702 | 1657 | 325.5 |
| B | 3 | 64 | 221815 | 676.47 | 1702 | 1657 | 325.5 |
| C | 15 | 208 | 55650 | 117.87 | 1980 | 1993 | 455.2 |
| C | 13 | 61 | 14314 | 27.07 | 1980 | 1993 | 455.2 |
| C | 14 | 234 | 12871 | 23.9 | 1980 | 1993 | 455.2 |
| D | 1 | 52 | 6869736 | 15286.47 | 1846 | 1791 | 449.3 |
| D | 13 | 249 | 5714788 | 12715.82 | 1846 | 1791 | 449.3 |
| D | 8 | 195 | 369442 | 818.31 | 1846 | 1791 | 449.3 |
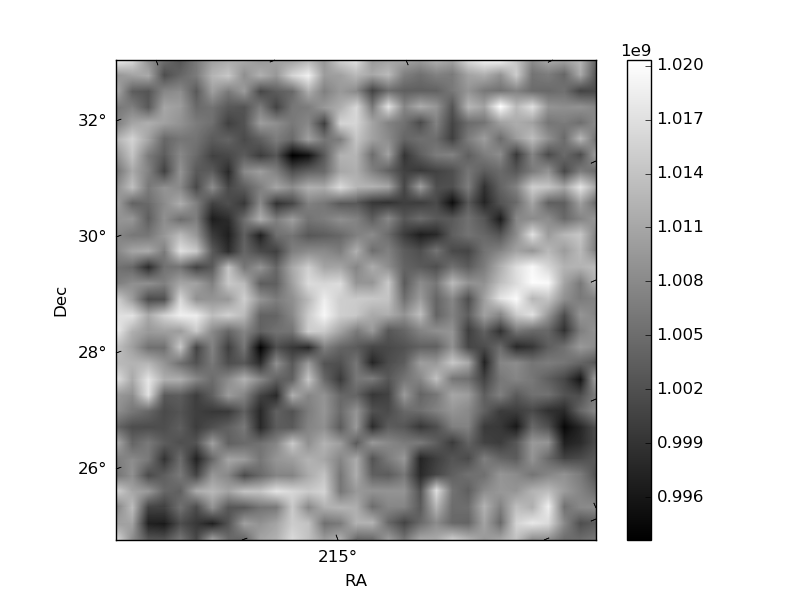
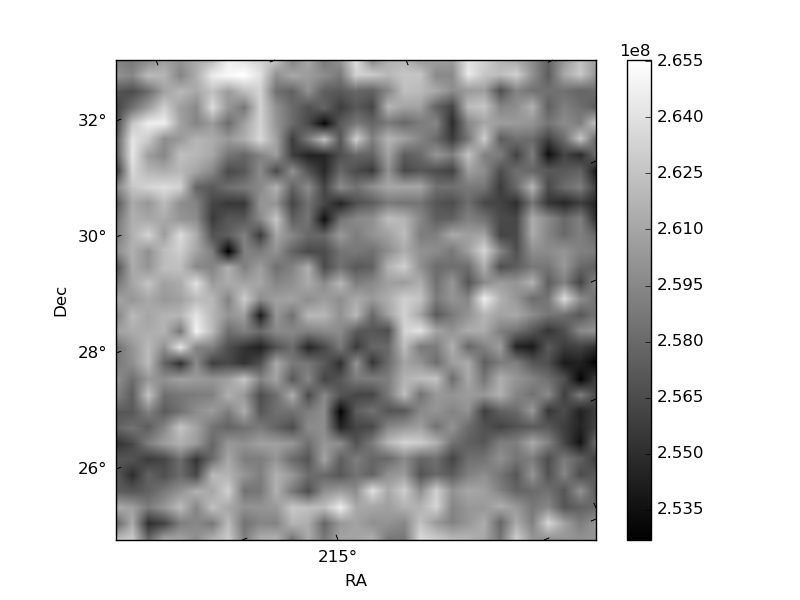
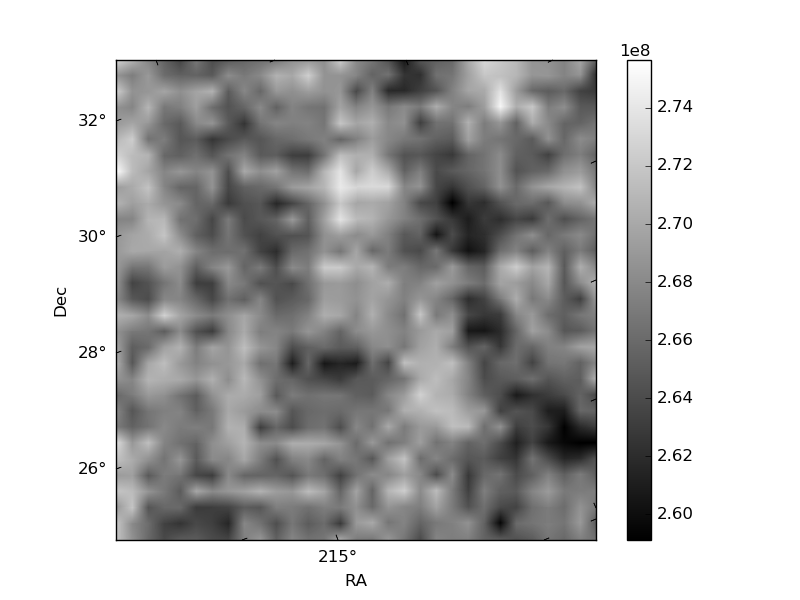
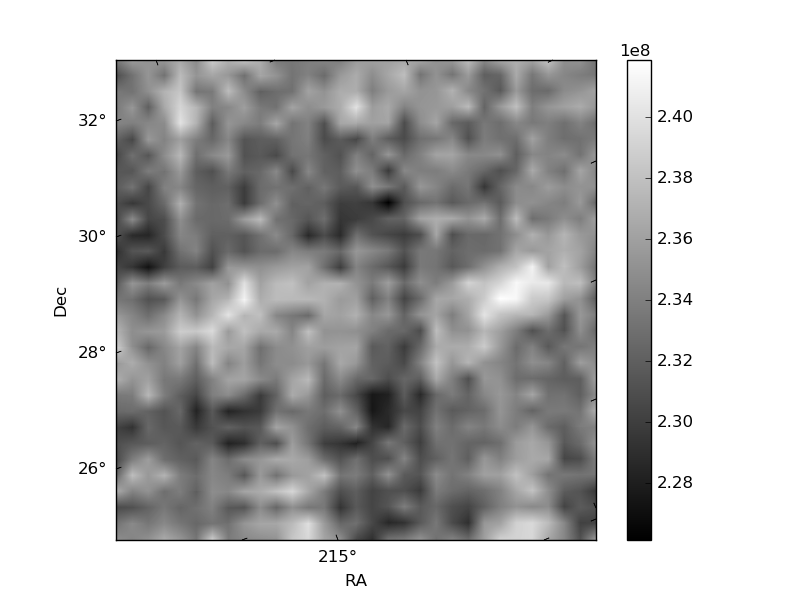
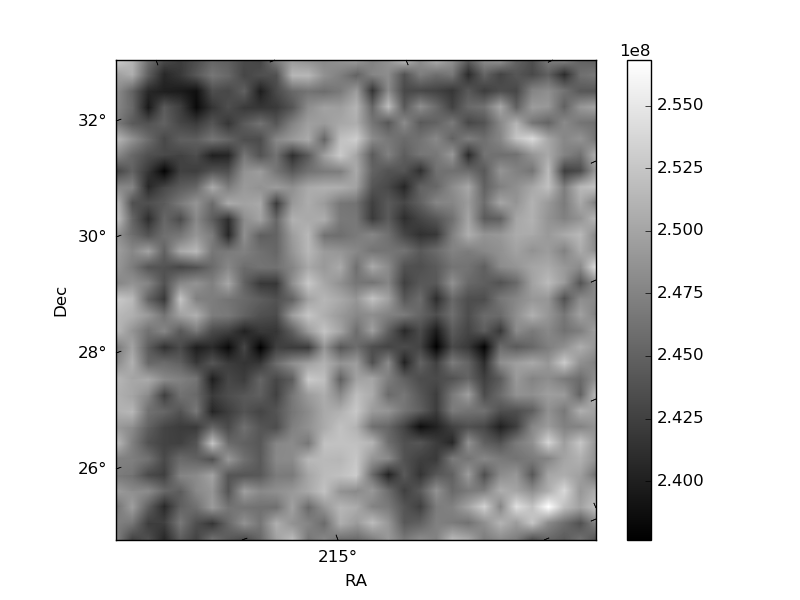
Histogram calculated using DETX and DETY for each event in the final _common_clean file
| Quadrant A | 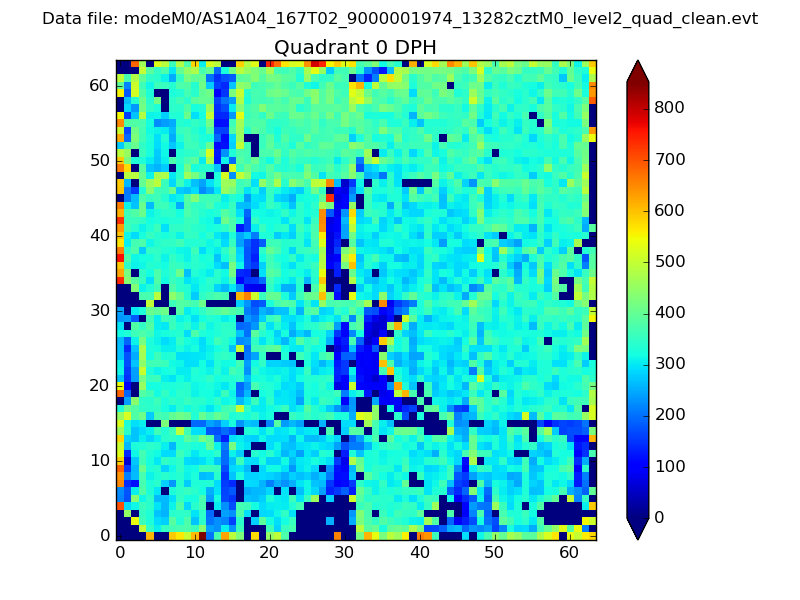 |
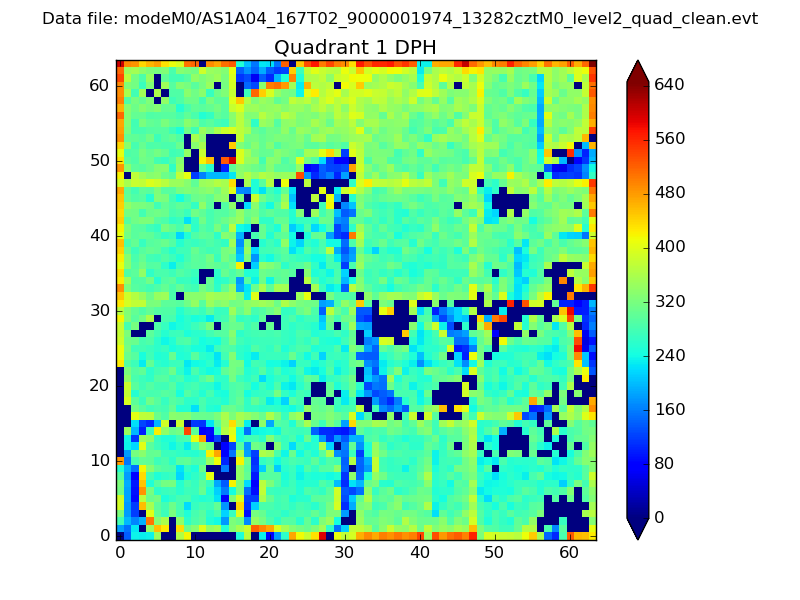 |
Quadrant B |
|---|---|---|---|
| Quadrant D | 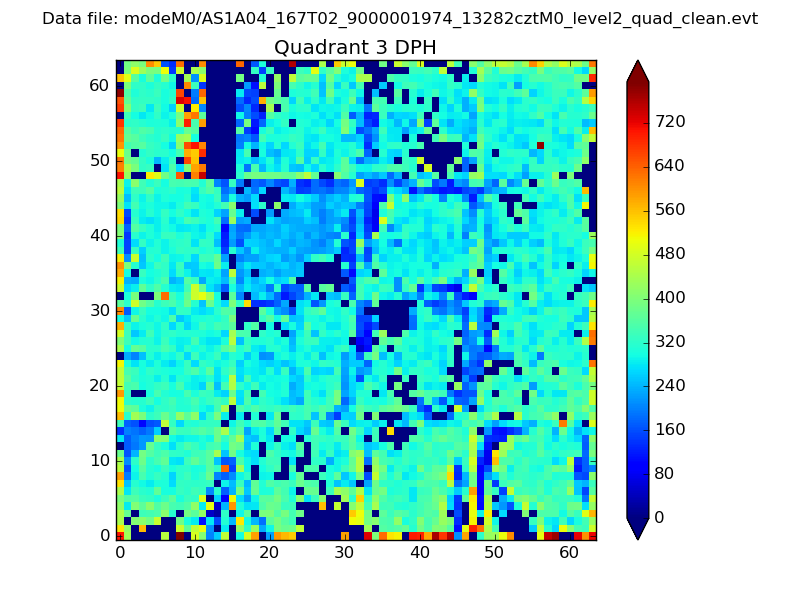 |
 |
Quadrant C |
| Plot type | Count rate plots | Images |
|---|---|---|
| Comparison with Poisson distribution Blue bars denote a histogram of data divided into 1 sec bins. Red curve is a Poisson curve with rate = median count rate of data. |
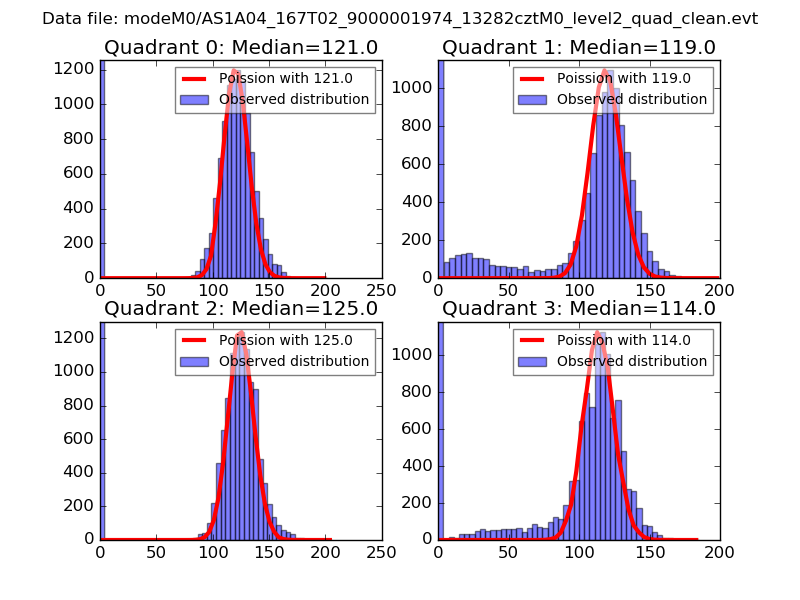 |
 |
| Quadrant-wise count rates Data is divided into 100 sec bins |
 |
|
| Module-wise count rates for Quadrant A Data is divided into 100 sec bins |
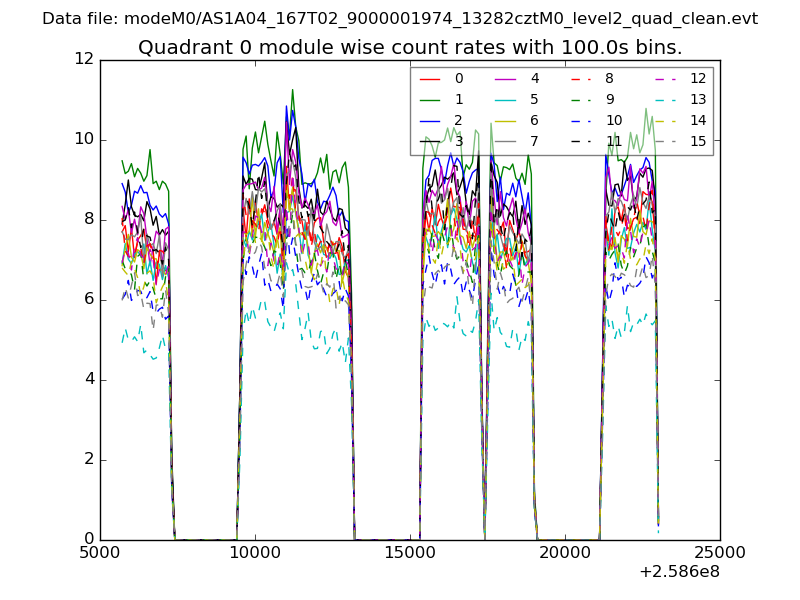 |
 |
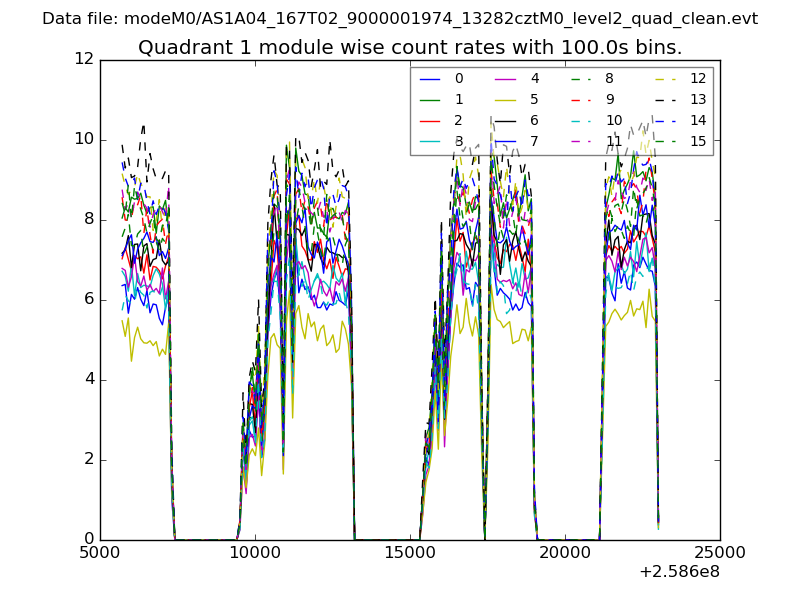
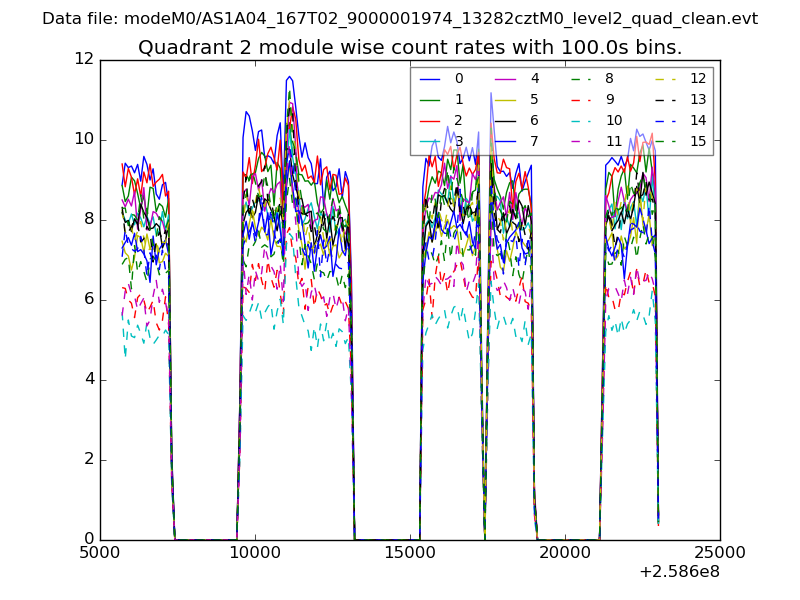
| Module-wise count rates for Quadrant B Data is divided into 100 sec bins |
 |
 |
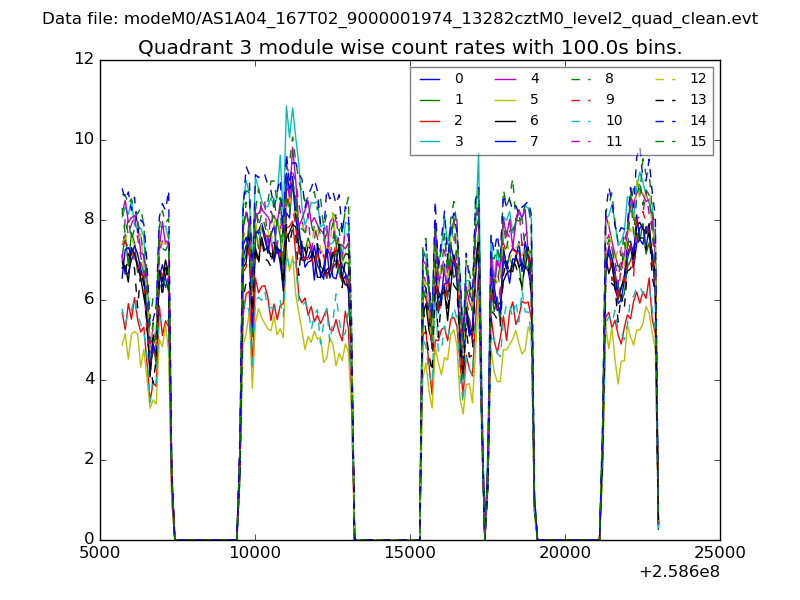
| Module-wise count rates for Quadrant C Data is divided into 100 sec bins |
 |
 |
| Module-wise count rates for Quadrant D Data is divided into 100 sec bins |
 |
 |
| Parameter | Plot |
|---|---|
| CZT HV Monitor | 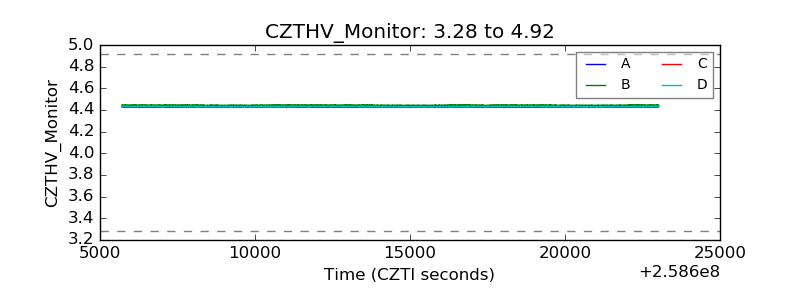 |
| D_VDD | 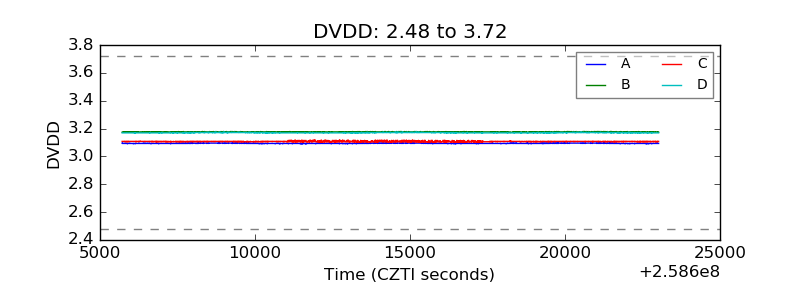 |
| Temperature 1 |  |
| Veto HV Monitor | 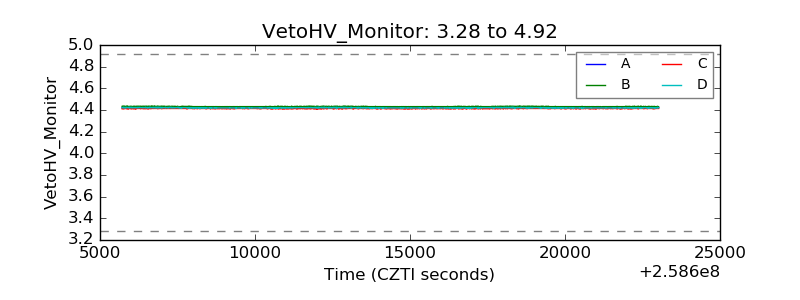 |
| Veto LLD | 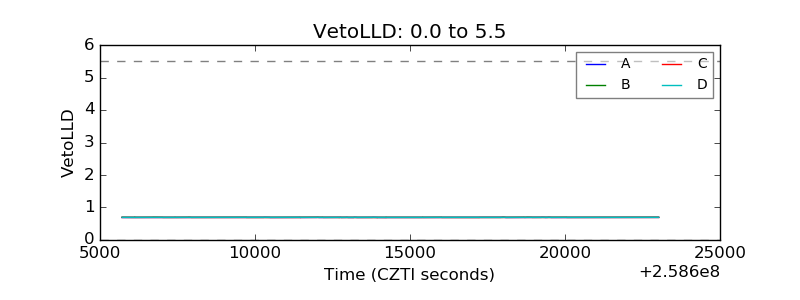 |
| Alpha Counter | 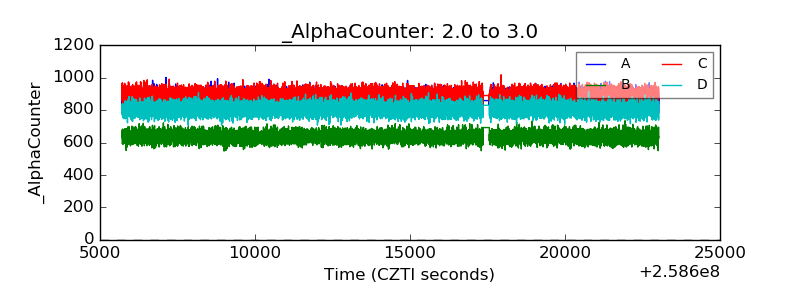 |
| _CPM_Rate | 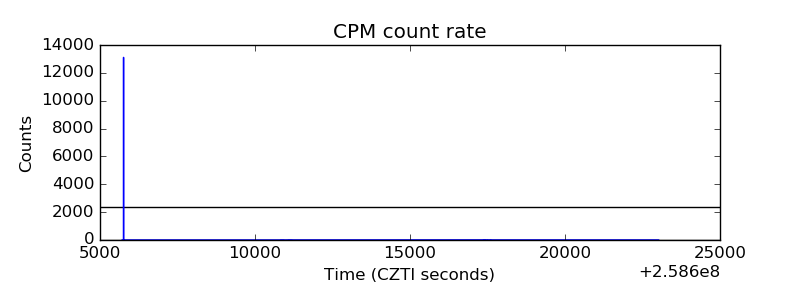 |
| CZT Counter |  |
| +2.5 Volts monitor |  |
| +5 Volts monitor |  |
| _ROLL_ROT | 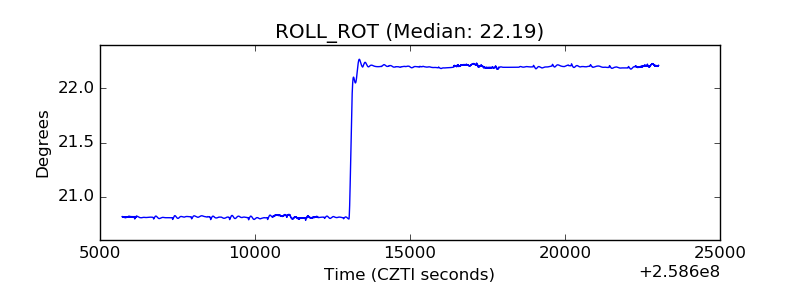 |
| _Roll_DEC | 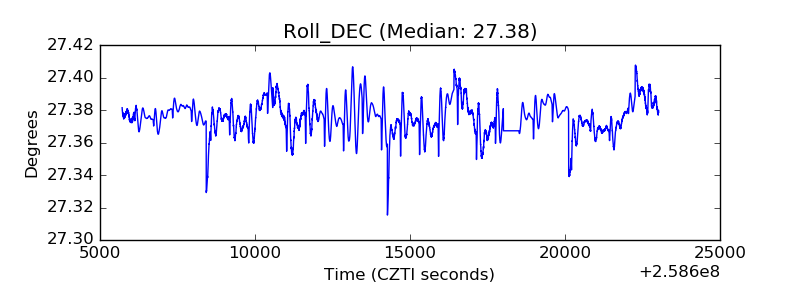 |
| _Roll_RA |  |
| Veto Counter | 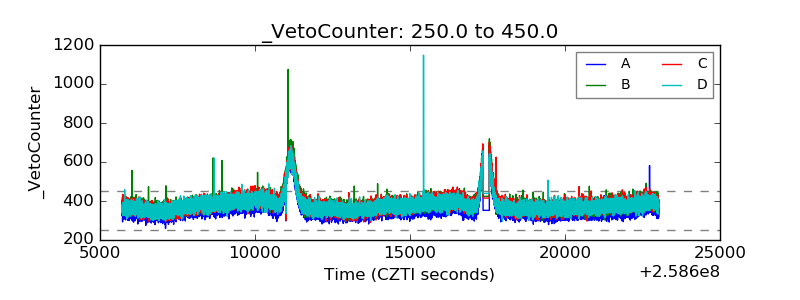 |