| Param | Original file | Final file |
|---|---|---|
| Filename | modeM0/AS1G08_031T03_9000001972cztM0_level2.fits | modeM0/AS1G08_031T03_9000001972cztM0_level2_quad_clean.evt |
| Size (bytes) | 222,572,160 | 188,357,760 |
| Size | 212.3 MB | 179.6 MB |
| Events in quadrant A | 1,308,022 | 1,030,919 |
| Events in quadrant B | 1,310,484 | 1,082,531 |
| Events in quadrant C | 1,357,572 | 1,045,887 |
| Events in quadrant D | 1,168,402 | 949,350 |
| Mode SS | |||
|---|---|---|---|
| Quadrant | BADHDUFLAG | Total packets | Discarded packets |
| A | 0 | 474 | 0 |
| B | 0 | 474 | 0 |
| C | 0 | 474 | 0 |
| D | 0 | 474 | 0 |
| Mode M0 | |||
|---|---|---|---|
| Quadrant | BADHDUFLAG | Total packets | Discarded packets |
| A | 0 | 80039 | 0 |
| B | 0 | 53243 | 0 |
| C | 0 | 48174 | 0 |
| D | 0 | 60380 | 0 |
| Mode M9 | |||
|---|---|---|---|
| Quadrant | BADHDUFLAG | Total packets | Discarded packets |
| A | 0 | 51 | 0 |
| B | 0 | 51 | 0 |
| C | 0 | 51 | 0 |
| D | 0 | 51 | 0 |
| Quadrant | Total seconds | Saturated seconds | Saturation percentage |
|---|---|---|---|
| A | 23169 | 3192 | 13.777030% |
| B | 23169 | 739 | 3.189607% |
| C | 23169 | 199 | 0.858906% |
| D | 23169 | 975 | 4.208209% |
Noise dominated data is calculated using 1-second bins in cleaned event files. If a bin has >2000 counts, and if more than 50% of those come from <1% of pixels, then it is considered to be noise-dominated and hence unusable.
| Quadrant | # 1 sec bins | Bins with >0 counts | Bins with >2000 counts | High rate bins dominated by noise | Noise dominated (total time) | Noise dominated (detector-on time) | Marked lightcurve |
|---|---|---|---|---|---|---|---|
| A | 28294 | 23157 | 0 | 0 | 0.00% | 0.00% |  |
| B | 28294 | 23152 | 0 | 0 | 0.00% | 0.00% |  |
| C | 28294 | 23169 | 0 | 0 | 0.00% | 0.00% |  |
| D | 28294 | 23161 | 0 | 0 | 0.00% | 0.00% |  |
Top three noisy pixels from each quadrant. If the there are fewer than three noisy pixels in the level2.evt file, extra rows are filled as -1
| Pixel properties | Quadrant properties | ||||||
|---|---|---|---|---|---|---|---|
| Quadrant | DetID | PixID | Counts | Sigma | Mean | Median | Sigma |
| A | 0 | 29 | 1310 | 11.43 | 339 | 318 | 86.8 |
| A | 7 | 110 | 1048 | 8.41 | 339 | 318 | 86.8 |
| A | 0 | 30 | 1005 | 7.92 | 339 | 318 | 86.8 |
| B | 2 | 9 | 1126 | 11.28 | 345 | 329 | 70.7 |
| B | 5 | 225 | 902 | 8.11 | 345 | 329 | 70.7 |
| B | 14 | 254 | 892 | 7.97 | 345 | 329 | 70.7 |
| C | 3 | 126 | 930 | 6.27 | 359 | 334 | 95.0 |
| C | 12 | 241 | 915 | 6.12 | 359 | 334 | 95.0 |
| C | 2 | 191 | 913 | 6.09 | 359 | 334 | 95.0 |
| D | 6 | 231 | 848 | 5.91 | 333 | 304 | 92.1 |
| D | 3 | 14 | 820 | 5.6 | 333 | 304 | 92.1 |
| D | 6 | 67 | 813 | 5.53 | 333 | 304 | 92.1 |
Histogram calculated using DETX and DETY for each event in the final _common_clean file
| Quadrant A | 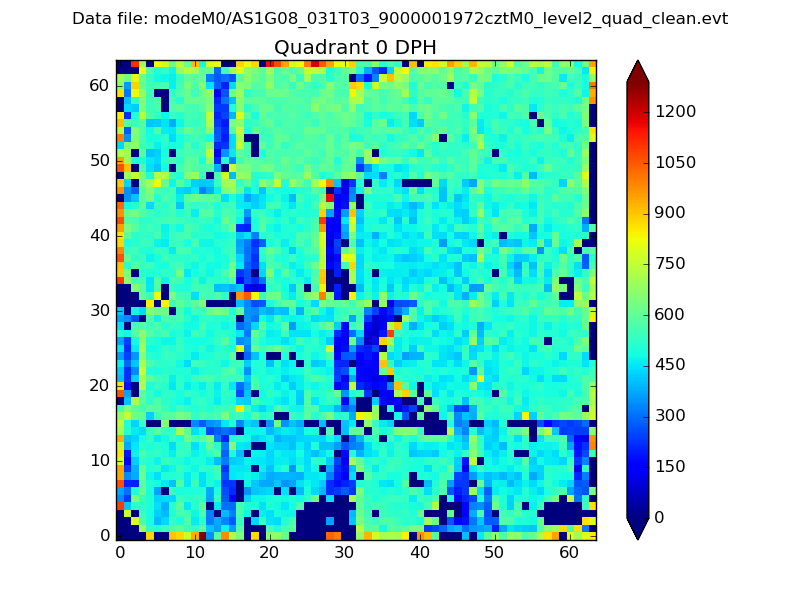 |
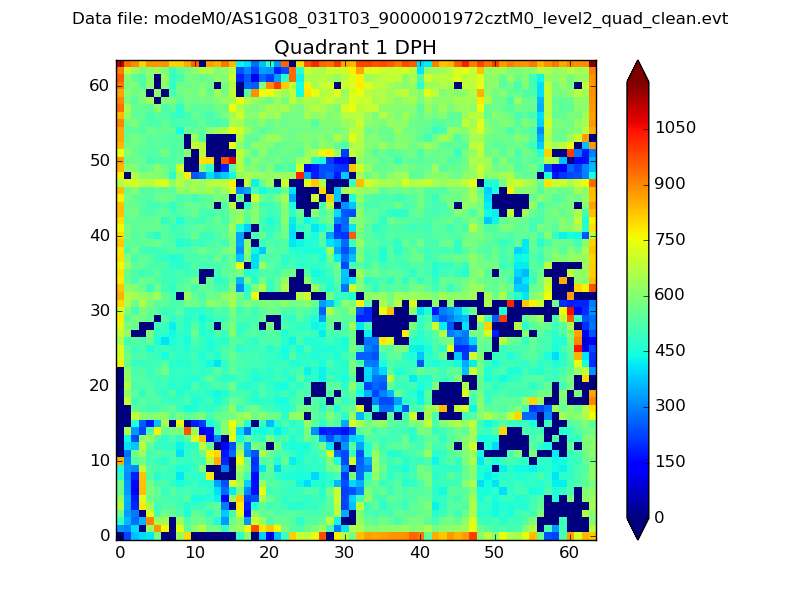 |
Quadrant B |
|---|---|---|---|
| Quadrant D | 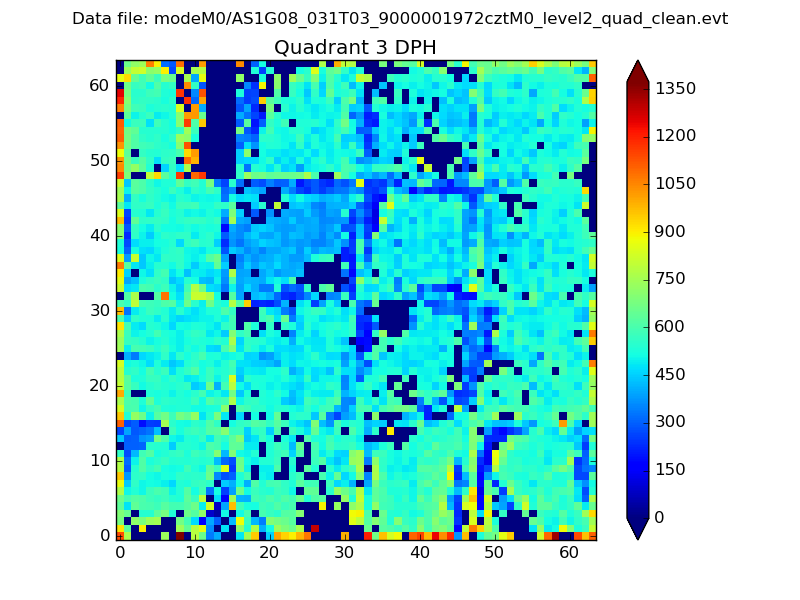 |
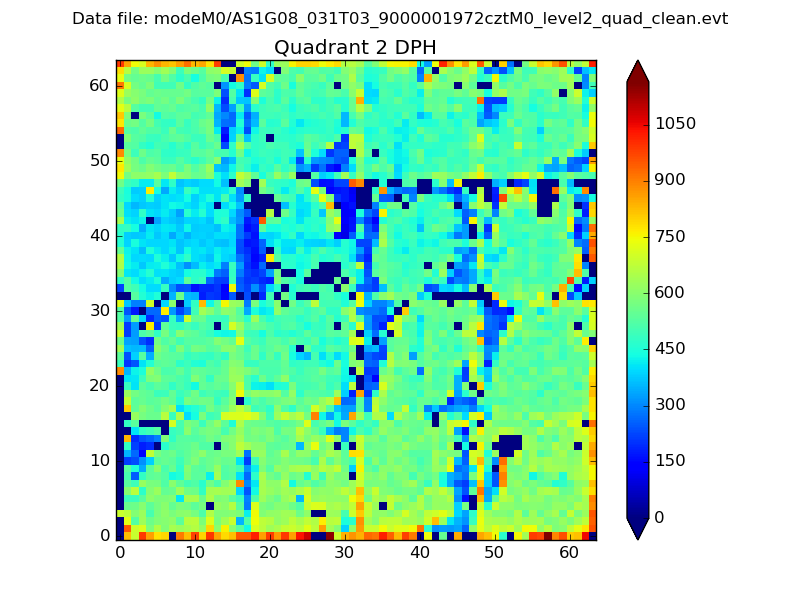 |
Quadrant C |
| Plot type | Count rate plots | Images |
|---|---|---|
| Comparison with Poisson distribution Blue bars denote a histogram of data divided into 1 sec bins. Red curve is a Poisson curve with rate = median count rate of data. |
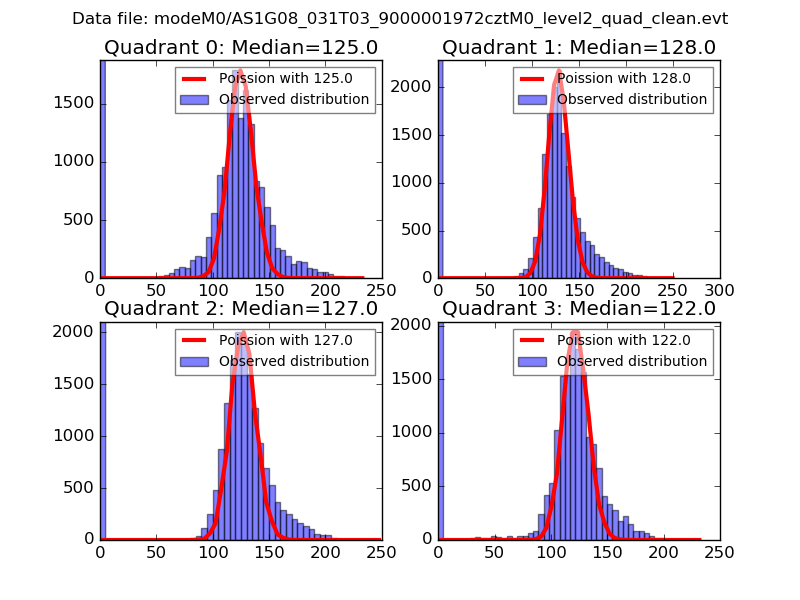 |
 |
| Quadrant-wise count rates Data is divided into 100 sec bins |
 |
|
| Module-wise count rates for Quadrant A Data is divided into 100 sec bins |
 |
 |
| Module-wise count rates for Quadrant B Data is divided into 100 sec bins |
 |
 |
| Module-wise count rates for Quadrant C Data is divided into 100 sec bins |
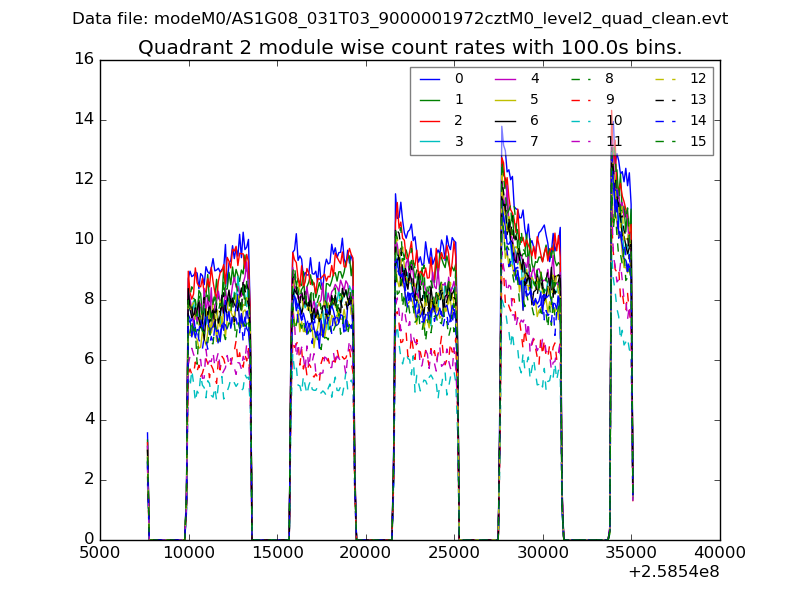 |
 |
| Module-wise count rates for Quadrant D Data is divided into 100 sec bins |
 |
 |
| Parameter | Plot |
|---|---|
| CZT HV Monitor |  |
| D_VDD | 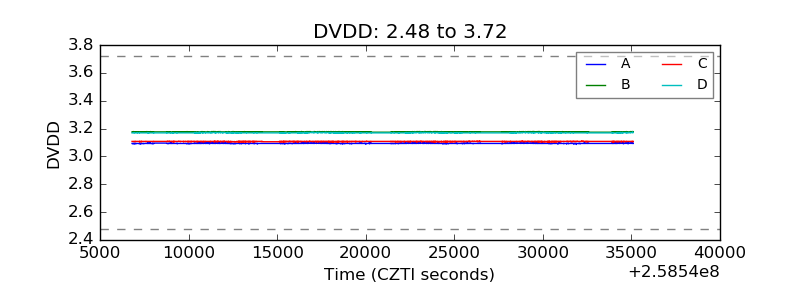 |
| Temperature 1 |  |
| Veto HV Monitor | 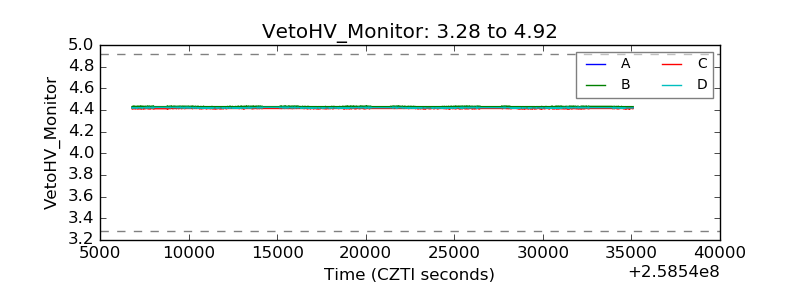 |
| Veto LLD |  |
| Alpha Counter |  |
| _CPM_Rate |  |
| CZT Counter |  |
| +2.5 Volts monitor |  |
| +5 Volts monitor |  |
| _ROLL_ROT |  |
| _Roll_DEC |  |
| _Roll_RA |  |
| Veto Counter |  |