| Param | Original file | Final file |
|---|---|---|
| Filename | modeM0/AS1G08_031T03_9000001972_13268cztM0_level2.evt | modeM0/AS1G08_031T03_9000001972_13268cztM0_level2_quad_clean.evt |
| Size (bytes) | 571,196,160 | 89,861,760 |
| Size | 544.7 MB | 85.7 MB |
| Events in quadrant A | 6,555,592 | 565,670 |
| Events in quadrant B | 3,345,438 | 587,725 |
| Events in quadrant C | 2,891,728 | 582,858 |
| Events in quadrant D | 4,087,805 | 554,159 |
| Mode SS | |||
|---|---|---|---|
| Quadrant | BADHDUFLAG | Total packets | Discarded packets |
| A | 0 | 128 | 0 |
| B | 0 | 128 | 0 |
| C | 0 | 128 | 0 |
| D | 0 | 128 | 0 |
| Mode M0 | |||
|---|---|---|---|
| Quadrant | BADHDUFLAG | Total packets | Discarded packets |
| A | 0 | 23565 | 2 |
| B | 0 | 13974 | 1 |
| C | 0 | 12696 | 1 |
| D | 0 | 16135 | 1 |
| Mode M9 | |||
|---|---|---|---|
| Quadrant | BADHDUFLAG | Total packets | Discarded packets |
| A | 0 | 10 | 0 |
| B | 0 | 10 | 0 |
| C | 0 | 10 | 0 |
| D | 0 | 10 | 0 |
| Quadrant | Total seconds | Saturated seconds | Saturation percentage |
|---|---|---|---|
| A | 6159 | 974 | 15.814256% |
| B | 6159 | 167 | 2.711479% |
| C | 6159 | 32 | 0.519565% |
| D | 6159 | 368 | 5.974996% |
Noise dominated data is calculated using 1-second bins in cleaned event files. If a bin has >2000 counts, and if more than 50% of those come from <1% of pixels, then it is considered to be noise-dominated and hence unusable.
| Quadrant | # 1 sec bins | Bins with >0 counts | Bins with >2000 counts | High rate bins dominated by noise | Noise dominated (total time) | Noise dominated (detector-on time) | Marked lightcurve |
|---|---|---|---|---|---|---|---|
| A | 7225 | 6161 | 808 | 808 | 11.18% | 13.11% | 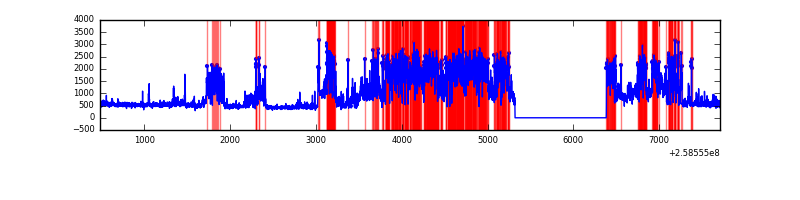 |
| B | 7225 | 6160 | 76 | 76 | 1.05% | 1.23% | 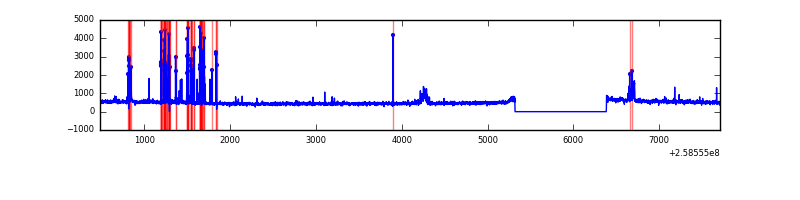 |
| C | 7225 | 6161 | 1 | 1 | 0.01% | 0.02% | 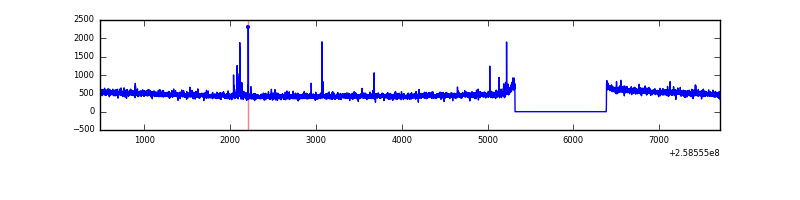 |
| D | 7225 | 6161 | 296 | 296 | 4.10% | 4.80% | 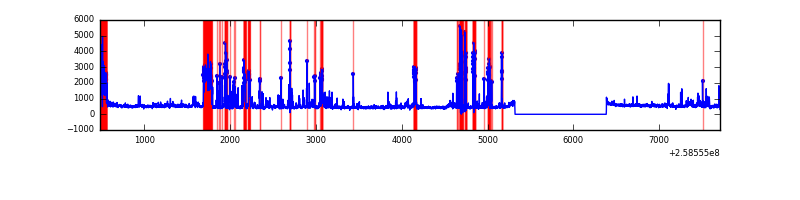 |
Top three noisy pixels from each quadrant. If the there are fewer than three noisy pixels in the level2.evt file, extra rows are filled as -1
| Pixel properties | Quadrant properties | ||||||
|---|---|---|---|---|---|---|---|
| Quadrant | DetID | PixID | Counts | Sigma | Mean | Median | Sigma |
| A | 15 | 239 | 3560265 | 24011.1 | 729 | 712 | 148.2 |
| A | 8 | 15 | 76284 | 509.77 | 729 | 712 | 148.2 |
| A | 4 | 2 | 72818 | 486.39 | 729 | 712 | 148.2 |
| B | 4 | 239 | 303884 | 2119.34 | 742 | 722 | 143.0 |
| B | 3 | 64 | 47008 | 323.58 | 742 | 722 | 143.0 |
| B | 4 | 173 | 41779 | 287.02 | 742 | 722 | 143.0 |
| C | 15 | 208 | 23059 | 131.46 | 732 | 737 | 169.8 |
| C | 6 | 96 | 8191 | 43.9 | 732 | 737 | 169.8 |
| C | 13 | 61 | 5175 | 26.14 | 732 | 737 | 169.8 |
| D | 1 | 52 | 1008327 | 5883.55 | 714 | 694 | 171.3 |
| D | 5 | 222 | 303465 | 1767.87 | 714 | 694 | 171.3 |
| D | 14 | 35 | 45646 | 262.47 | 714 | 694 | 171.3 |
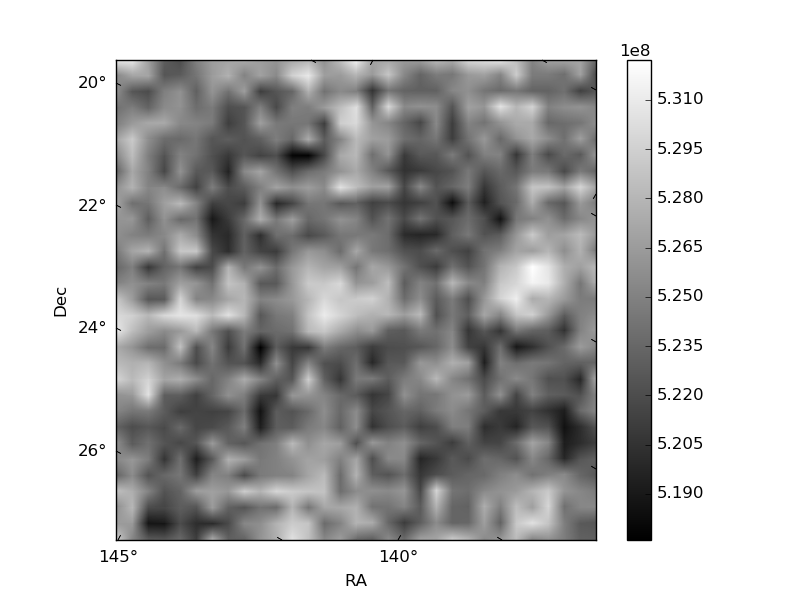
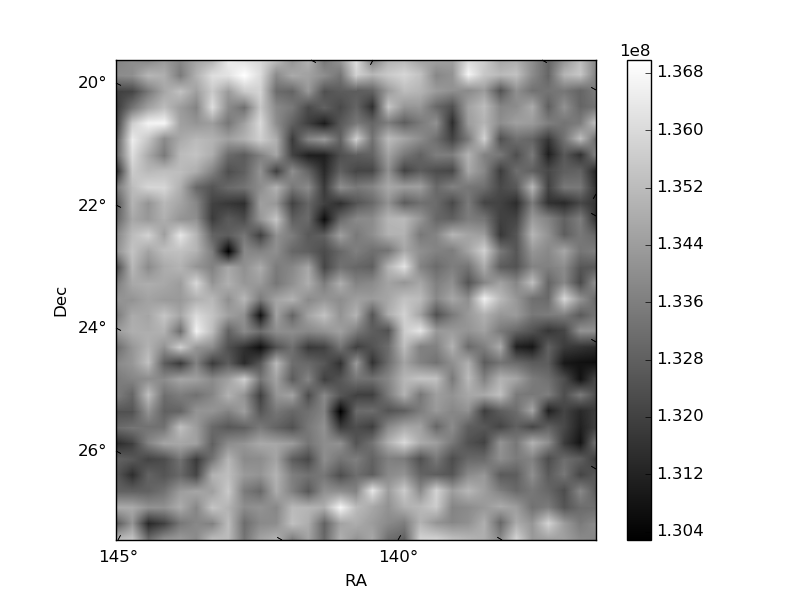
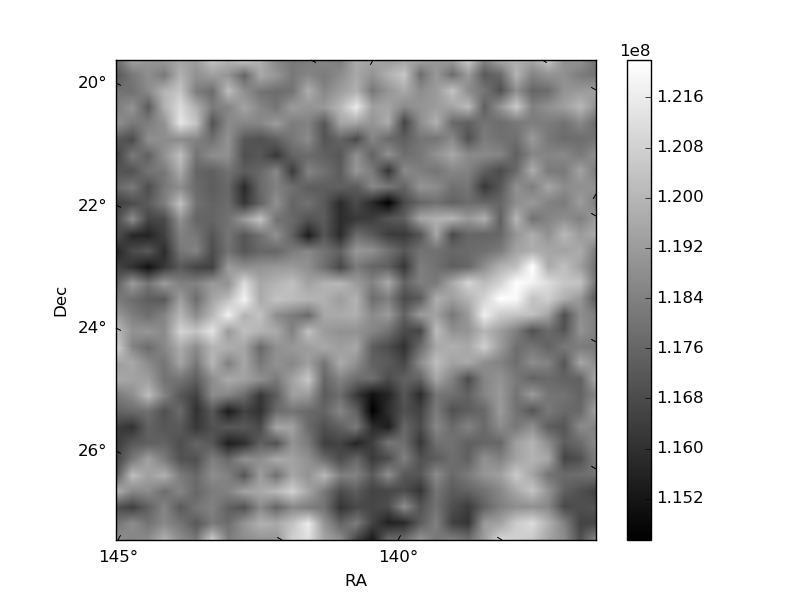
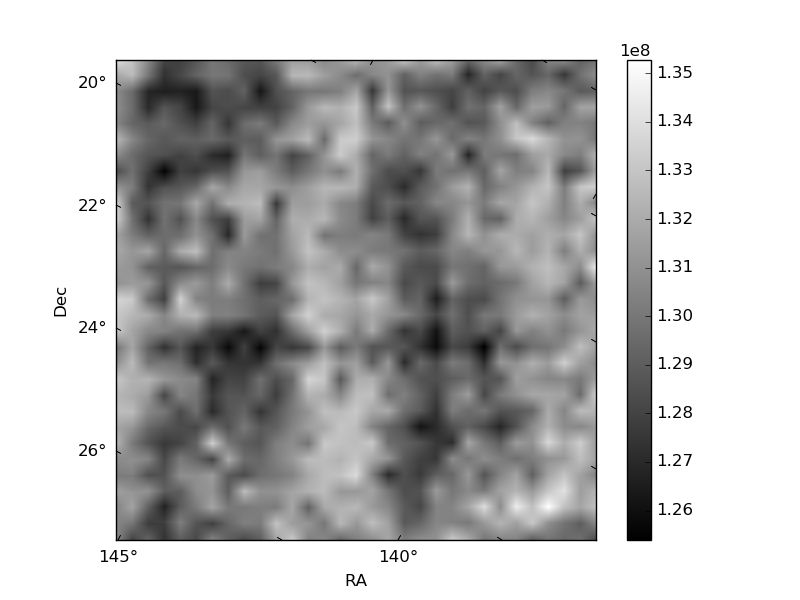
Histogram calculated using DETX and DETY for each event in the final _common_clean file
| Quadrant A | 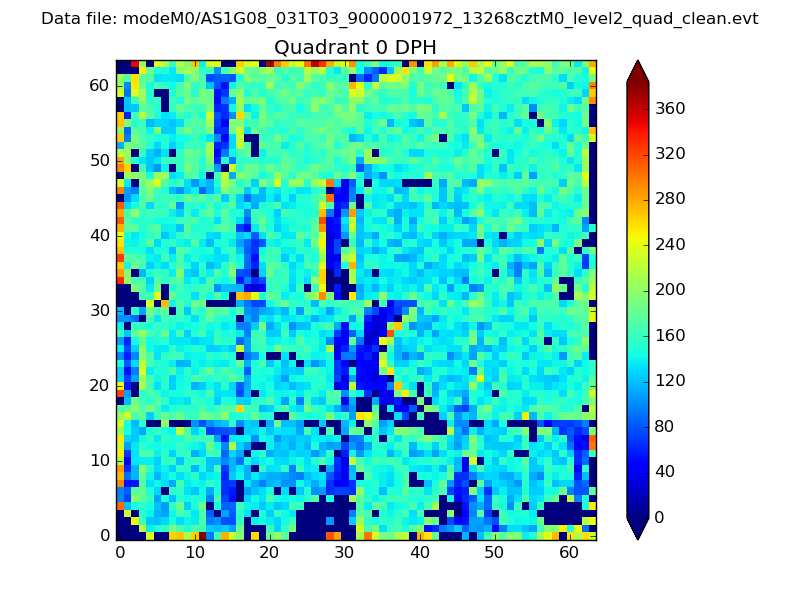 |
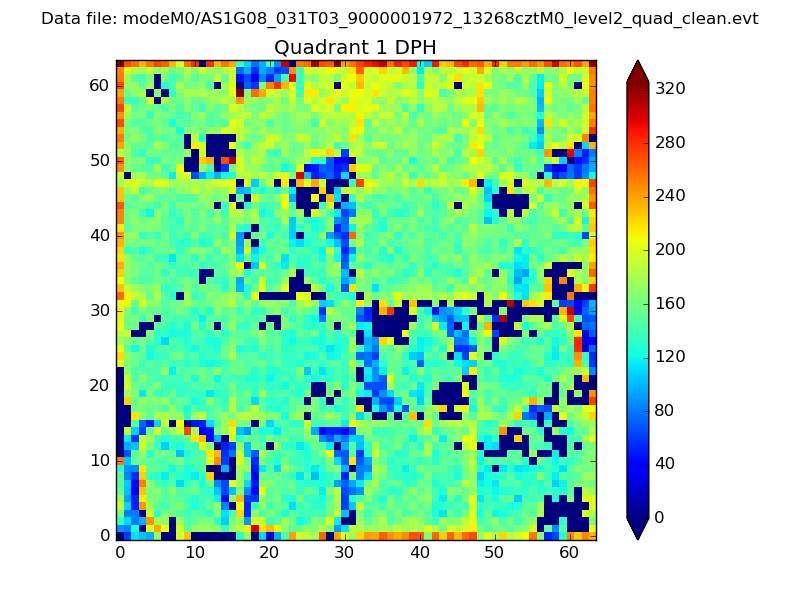 |
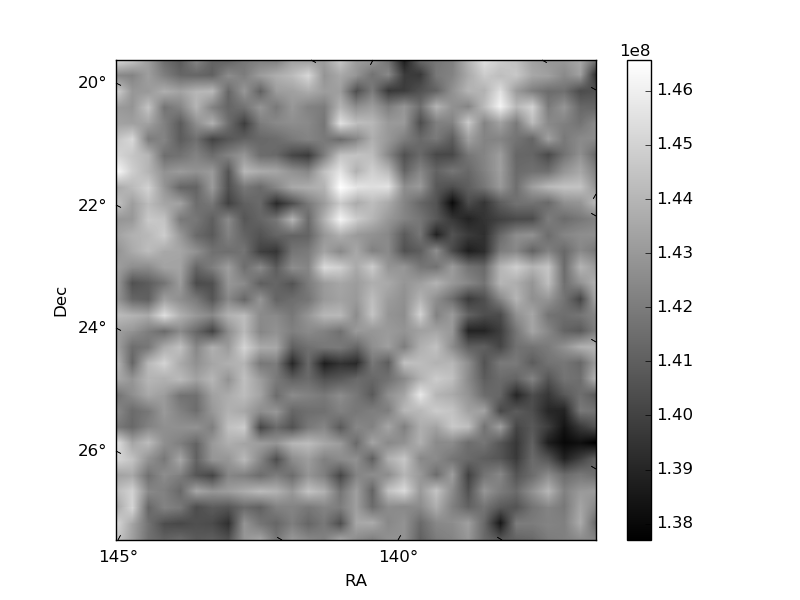
Quadrant B |
|---|---|---|---|
| Quadrant D | 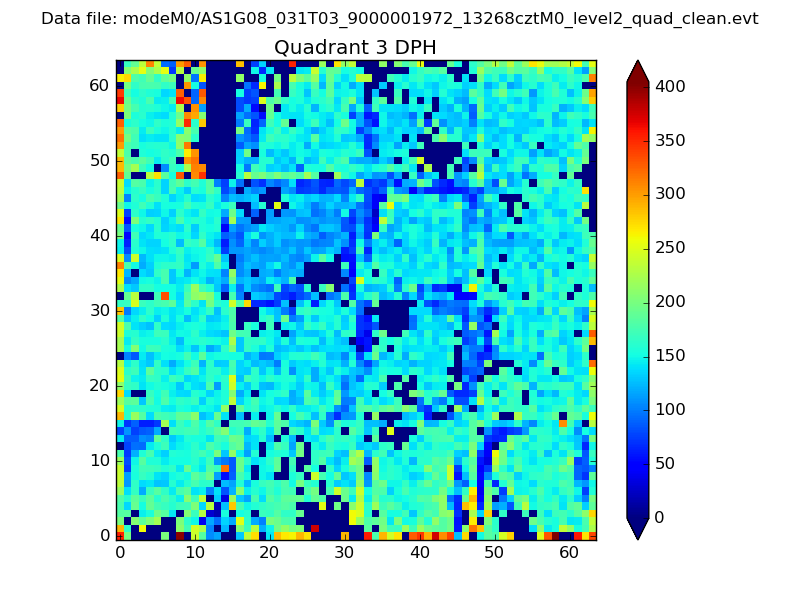 |
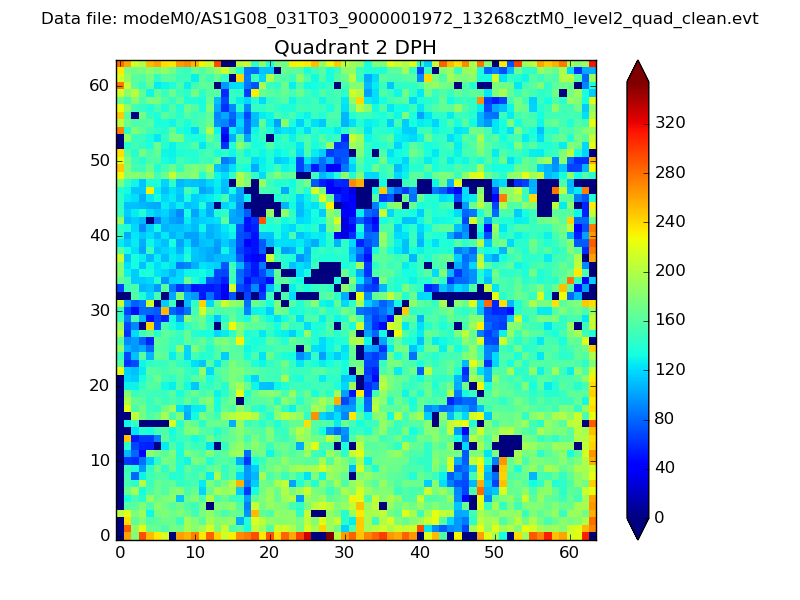 |
Quadrant C |
| Plot type | Count rate plots | Images |
|---|---|---|
| Comparison with Poisson distribution Blue bars denote a histogram of data divided into 1 sec bins. Red curve is a Poisson curve with rate = median count rate of data. |
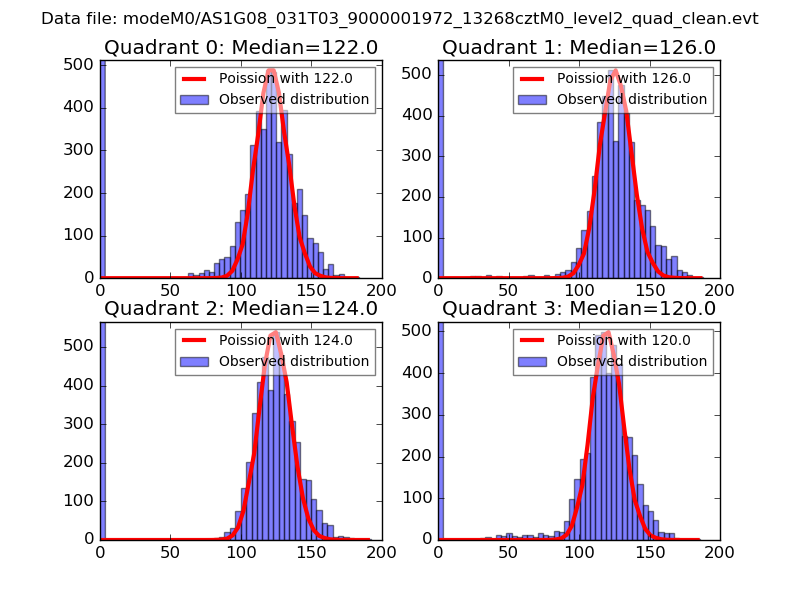 |
 |
| Quadrant-wise count rates Data is divided into 100 sec bins |
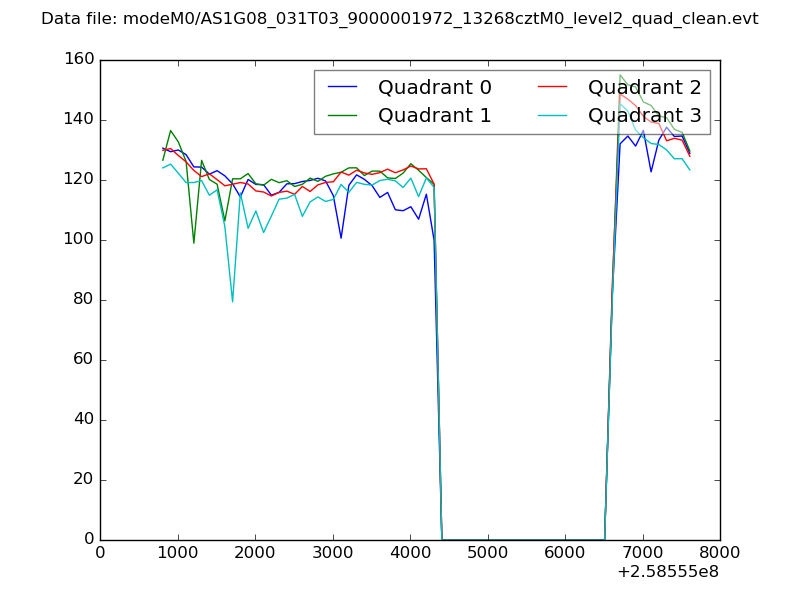 |
|
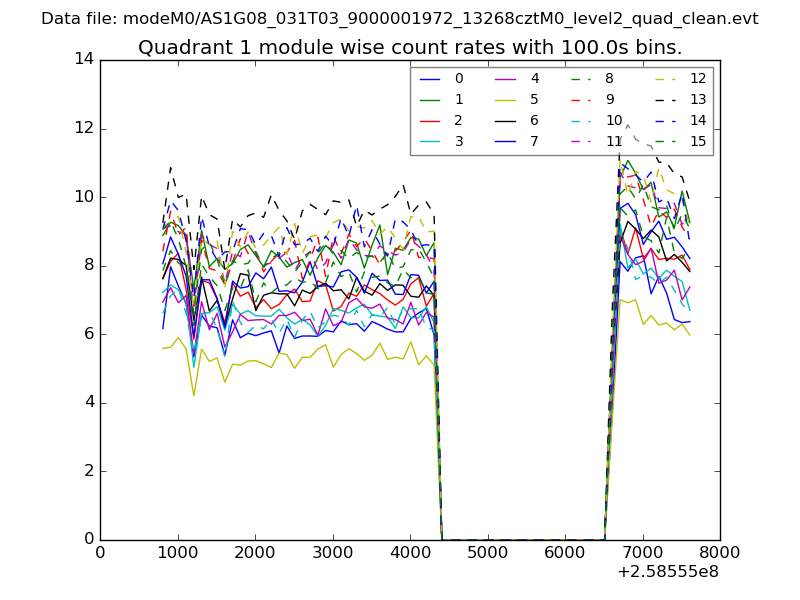
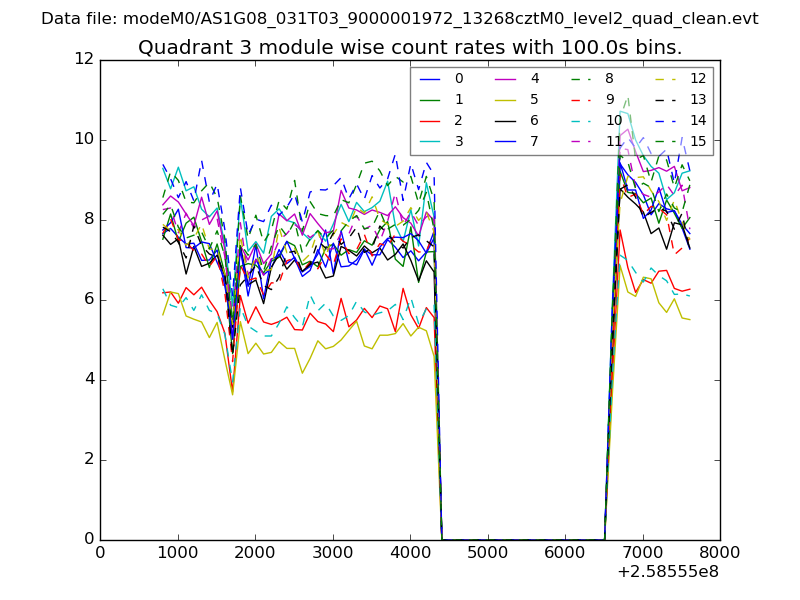
| Module-wise count rates for Quadrant A Data is divided into 100 sec bins |
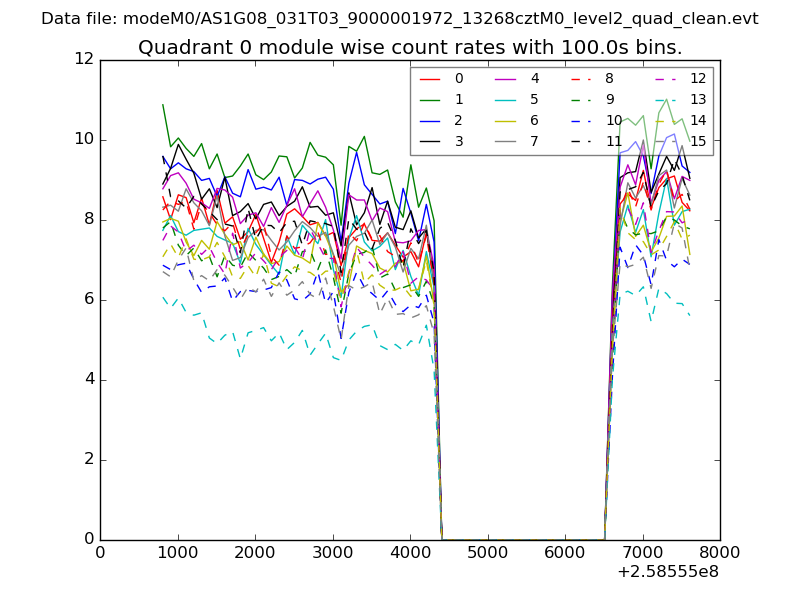 |
 |
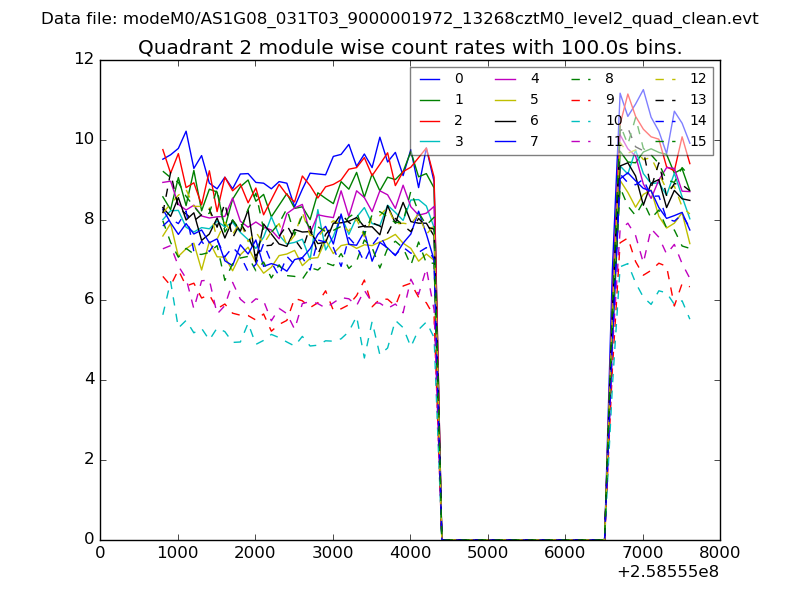
| Module-wise count rates for Quadrant B Data is divided into 100 sec bins |
 |
 |
| Module-wise count rates for Quadrant C Data is divided into 100 sec bins |
 |
 |
| Module-wise count rates for Quadrant D Data is divided into 100 sec bins |
 |
 |
| Parameter | Plot |
|---|---|
| CZT HV Monitor | 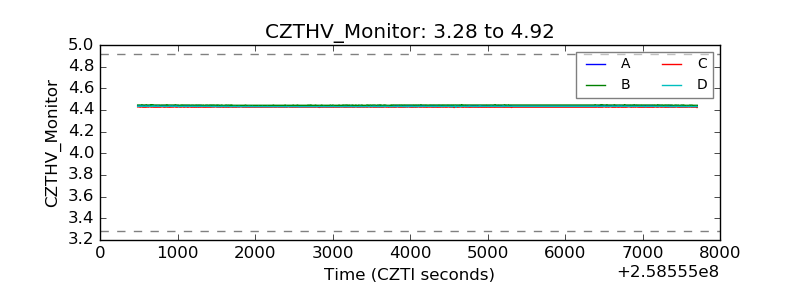 |
| D_VDD | 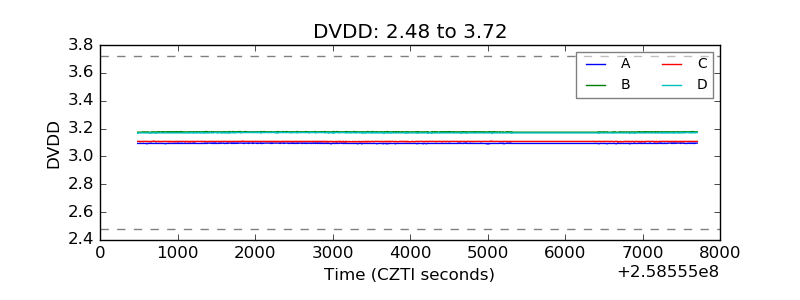 |
| Temperature 1 | 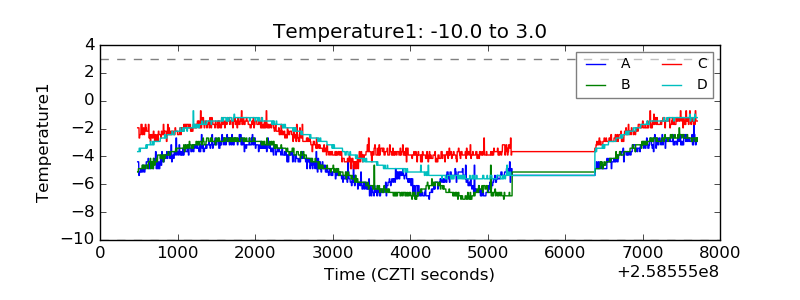 |
| Veto HV Monitor | 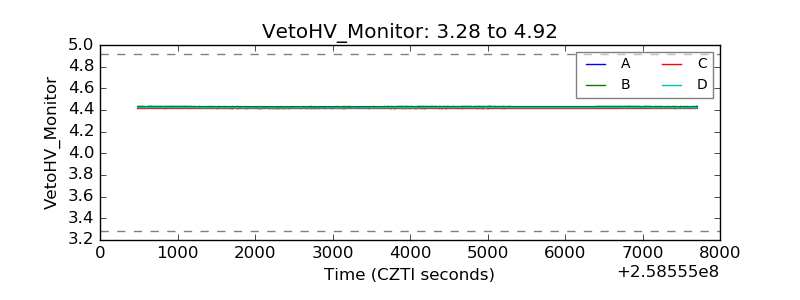 |
| Veto LLD | 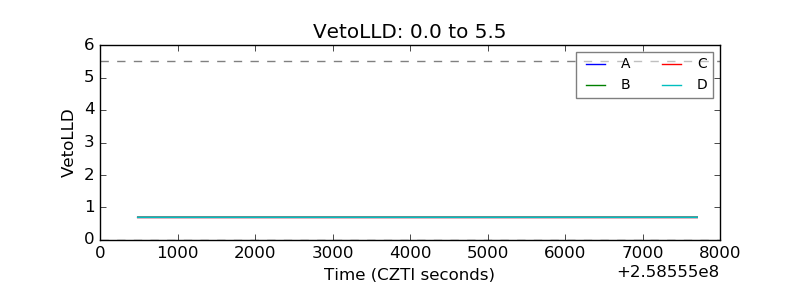 |
| Alpha Counter | 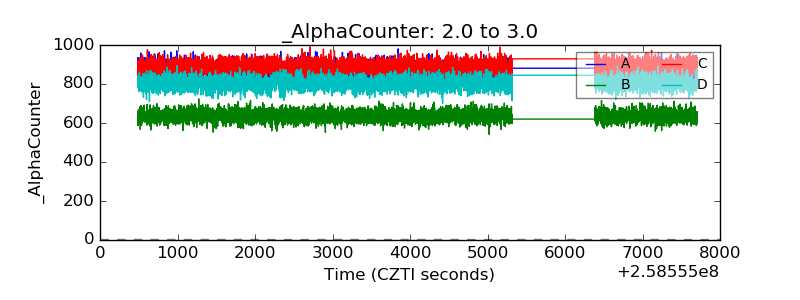 |
| _CPM_Rate | 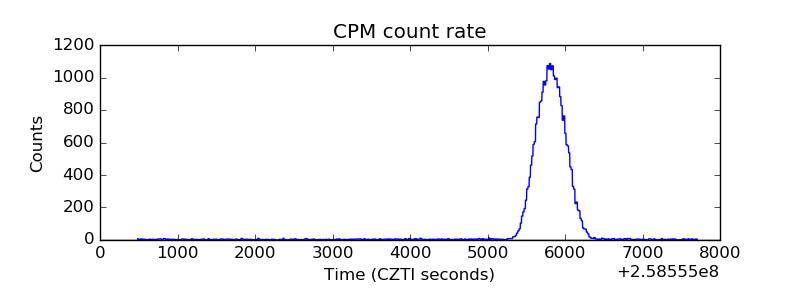 |
| CZT Counter | 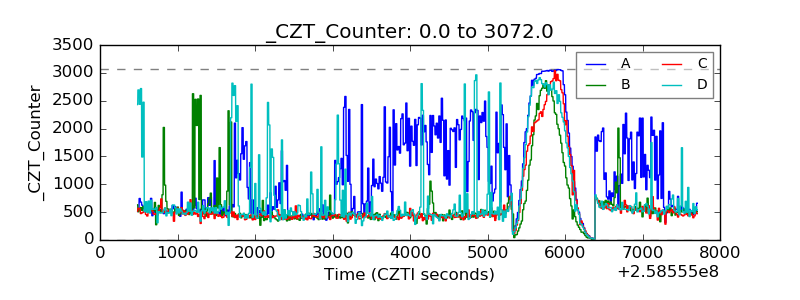 |
| +2.5 Volts monitor |  |
| +5 Volts monitor | 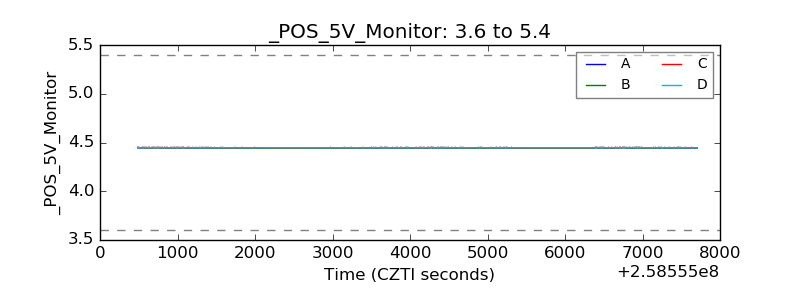 |
| _ROLL_ROT | 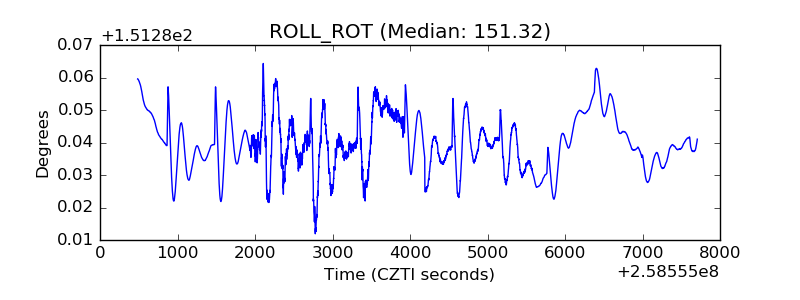 |
| _Roll_DEC | 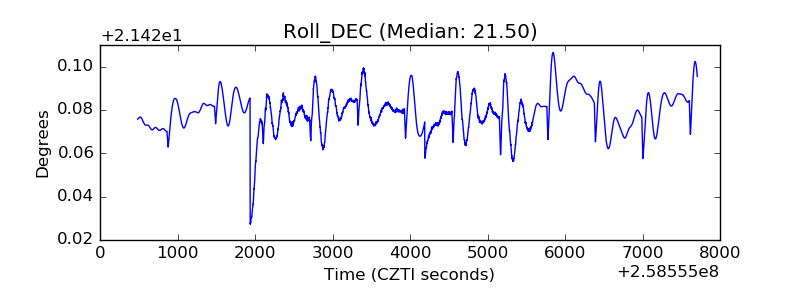 |
| _Roll_RA | 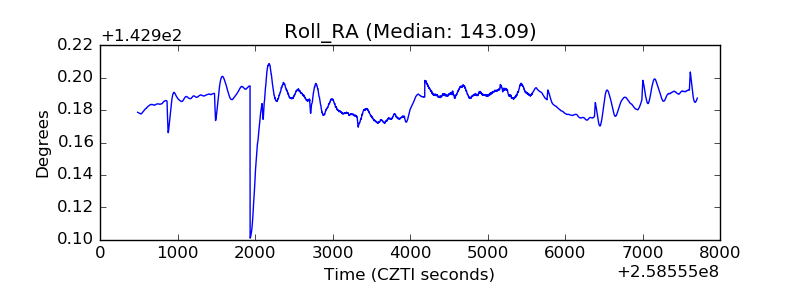 |
| Veto Counter | 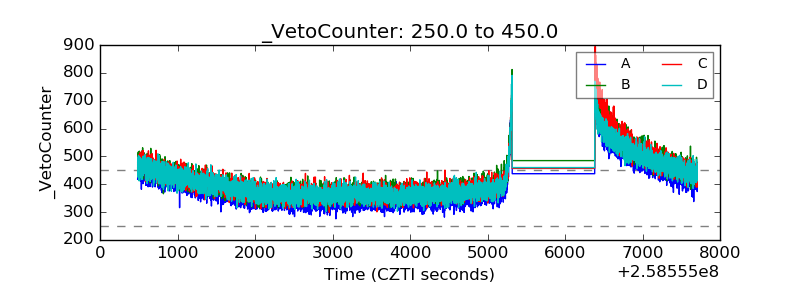 |