| Param | Original file | Final file |
|---|---|---|
| Filename | modeM0/AS1G08_031T03_9000001972_13272cztM0_level2.evt | modeM0/AS1G08_031T03_9000001972_13272cztM0_level2_quad_clean.evt |
| Size (bytes) | 579,502,080 | 103,536,000 |
| Size | 552.7 MB | 98.7 MB |
| Events in quadrant A | 5,758,779 | 665,088 |
| Events in quadrant B | 3,462,244 | 700,579 |
| Events in quadrant C | 3,131,845 | 687,438 |
| Events in quadrant D | 4,775,547 | 647,625 |
| Mode SS | |||
|---|---|---|---|
| Quadrant | BADHDUFLAG | Total packets | Discarded packets |
| A | 0 | 130 | 0 |
| B | 0 | 130 | 0 |
| C | 0 | 130 | 0 |
| D | 0 | 130 | 0 |
| Mode M0 | |||
|---|---|---|---|
| Quadrant | BADHDUFLAG | Total packets | Discarded packets |
| A | 0 | 21450 | 2 |
| B | 0 | 14472 | 2 |
| C | 0 | 13410 | 2 |
| D | 0 | 18462 | 2 |
| Mode M9 | |||
|---|---|---|---|
| Quadrant | BADHDUFLAG | Total packets | Discarded packets |
| A | 0 | 24 | 0 |
| B | 0 | 24 | 0 |
| C | 0 | 24 | 0 |
| D | 0 | 24 | 0 |
| Quadrant | Total seconds | Saturated seconds | Saturation percentage |
|---|---|---|---|
| A | 6224 | 875 | 14.058483% |
| B | 6224 | 128 | 2.056555% |
| C | 6224 | 74 | 1.188946% |
| D | 6224 | 280 | 4.498715% |
Noise dominated data is calculated using 1-second bins in cleaned event files. If a bin has >2000 counts, and if more than 50% of those come from <1% of pixels, then it is considered to be noise-dominated and hence unusable.
| Quadrant | # 1 sec bins | Bins with >0 counts | Bins with >2000 counts | High rate bins dominated by noise | Noise dominated (total time) | Noise dominated (detector-on time) | Marked lightcurve |
|---|---|---|---|---|---|---|---|
| A | 8660 | 6227 | 621 | 621 | 7.17% | 9.97% | 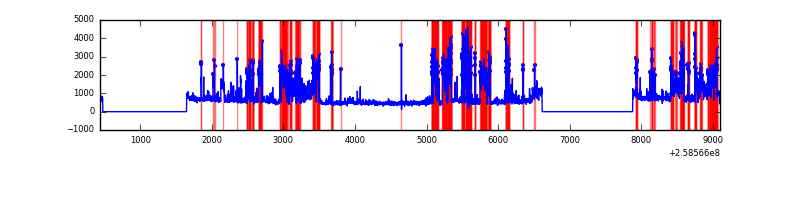 |
| B | 8660 | 6227 | 22 | 22 | 0.25% | 0.35% | 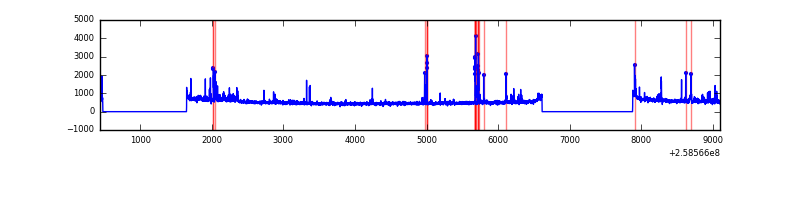 |
| C | 8660 | 6227 | 1 | 1 | 0.01% | 0.02% | 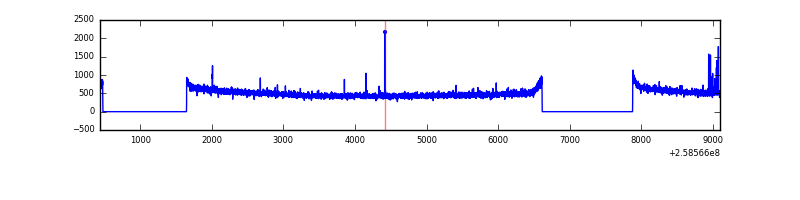 |
| D | 8660 | 6227 | 192 | 192 | 2.22% | 3.08% | 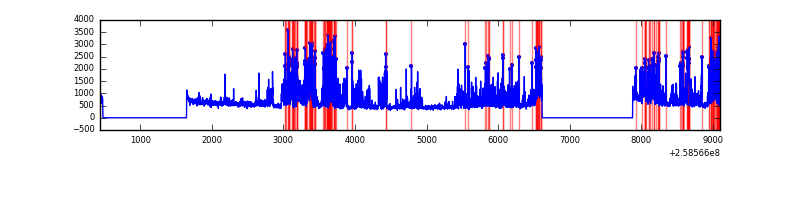 |
Top three noisy pixels from each quadrant. If the there are fewer than three noisy pixels in the level2.evt file, extra rows are filled as -1
| Pixel properties | Quadrant properties | ||||||
|---|---|---|---|---|---|---|---|
| Quadrant | DetID | PixID | Counts | Sigma | Mean | Median | Sigma |
| A | 15 | 239 | 2653130 | 16830.0 | 785 | 769 | 157.6 |
| A | 15 | 69 | 33843 | 209.86 | 785 | 769 | 157.6 |
| A | 8 | 15 | 19448 | 118.52 | 785 | 769 | 157.6 |
| B | 4 | 239 | 195160 | 1266.79 | 811 | 791 | 153.4 |
| B | 4 | 142 | 47546 | 304.72 | 811 | 791 | 153.4 |
| B | 0 | 214 | 22100 | 138.88 | 811 | 791 | 153.4 |
| C | 15 | 208 | 19510 | 101.82 | 796 | 800 | 183.8 |
| C | 6 | 96 | 5810 | 27.26 | 796 | 800 | 183.8 |
| C | 13 | 61 | 5672 | 26.51 | 796 | 800 | 183.8 |
| D | 5 | 222 | 1713097 | 9151.84 | 787 | 769 | 187.1 |
| D | 1 | 52 | 62805 | 331.56 | 787 | 769 | 187.1 |
| D | 2 | 234 | 21703 | 111.89 | 787 | 769 | 187.1 |
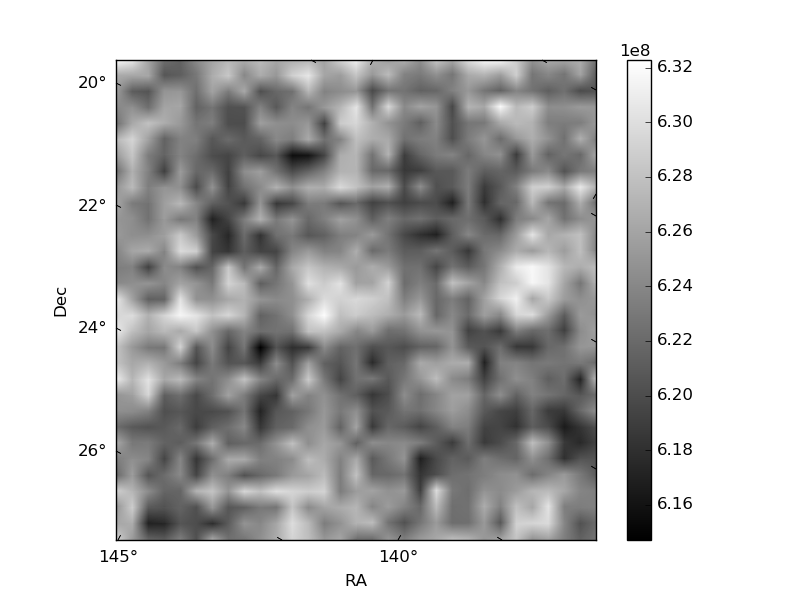
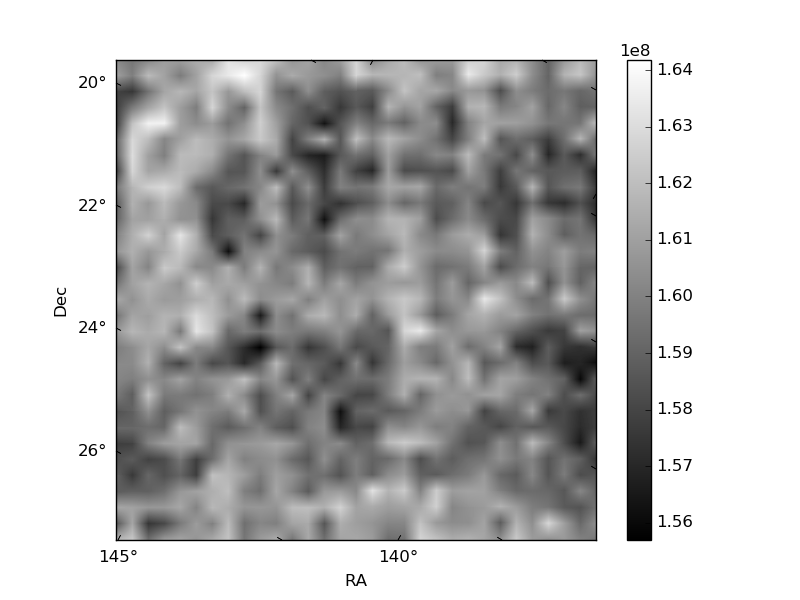
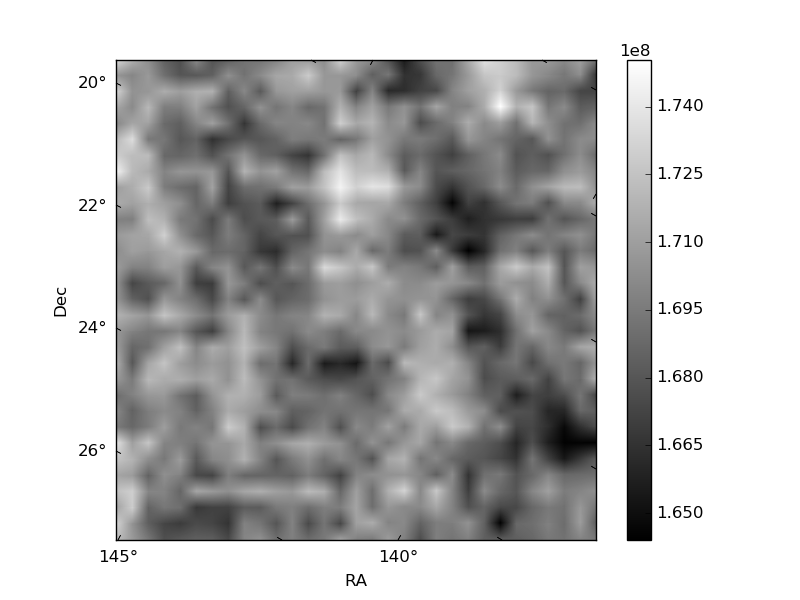
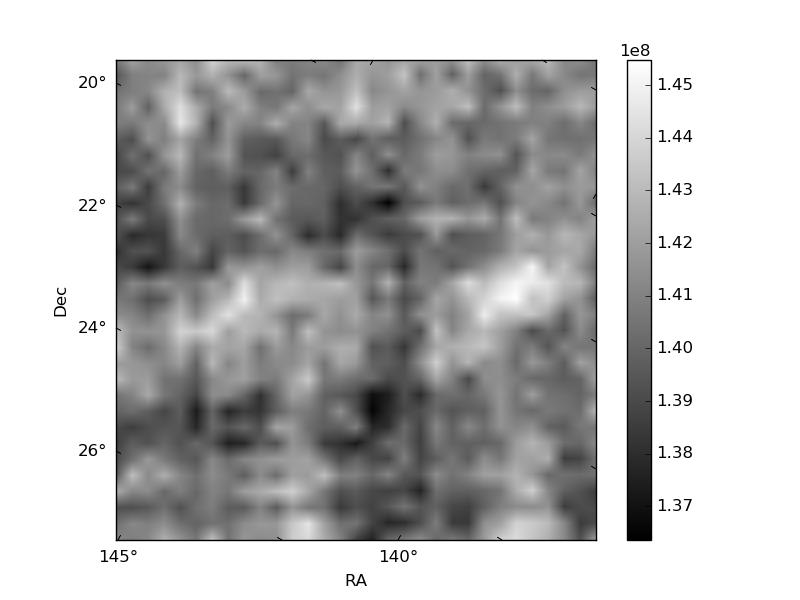
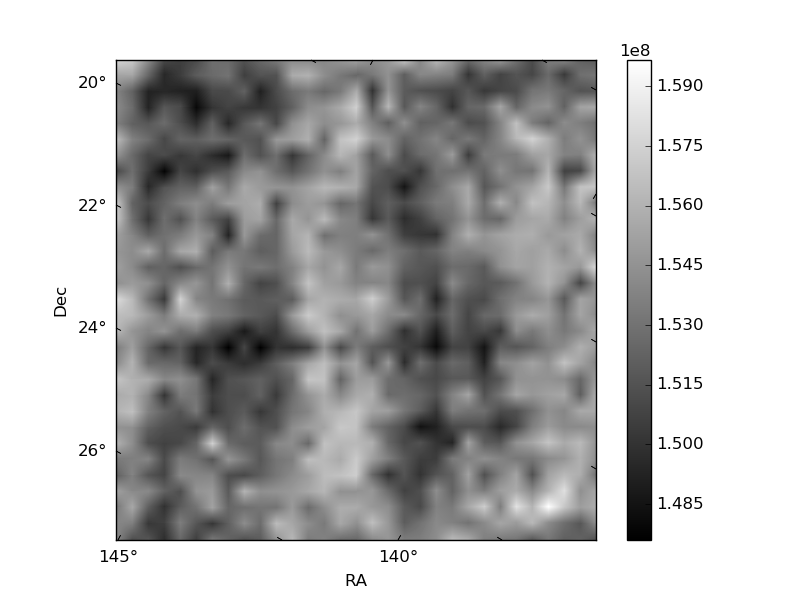
Histogram calculated using DETX and DETY for each event in the final _common_clean file
| Quadrant A | 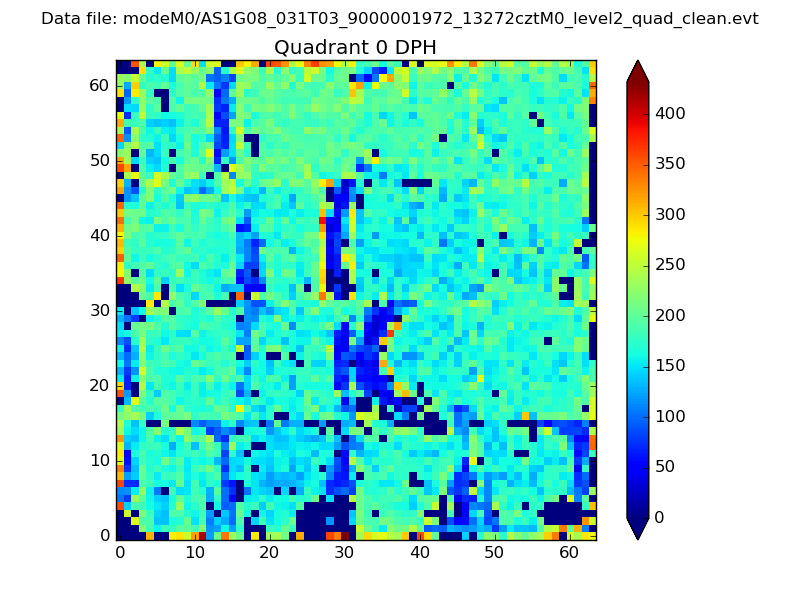 |
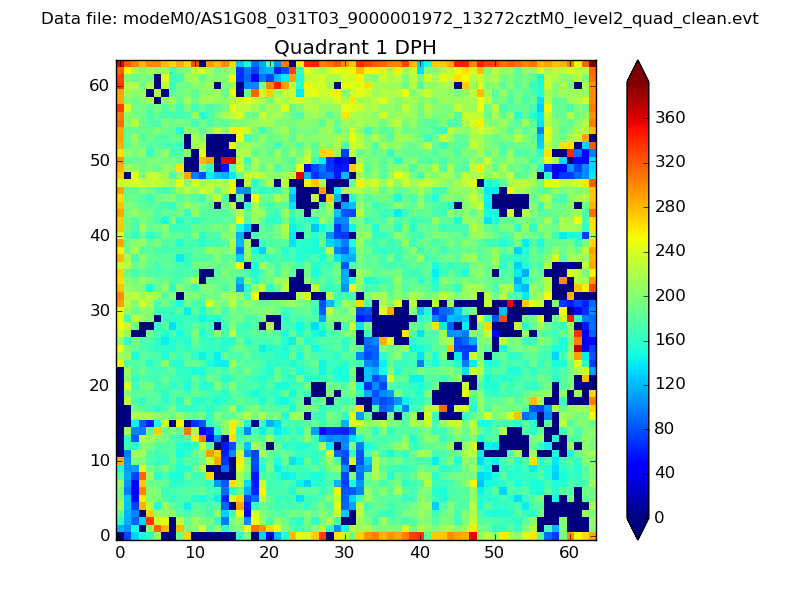 |
Quadrant B |
|---|---|---|---|
| Quadrant D | 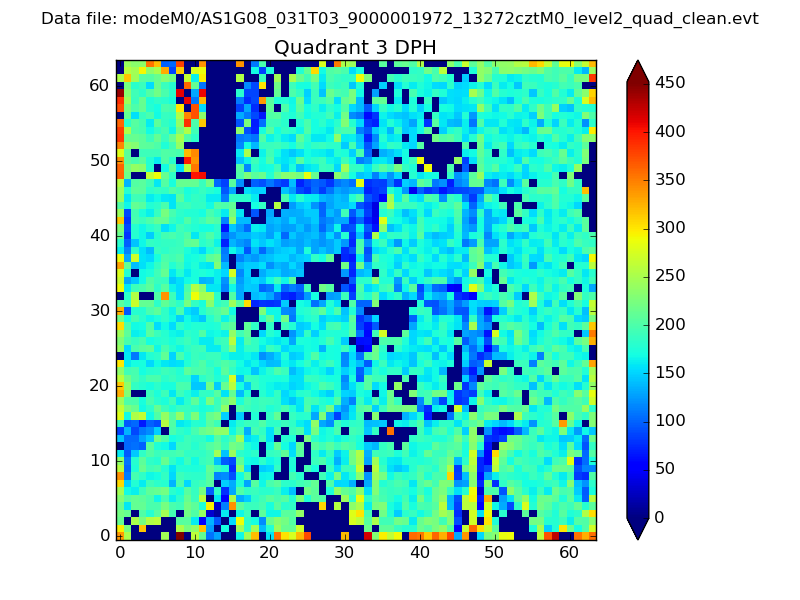 |
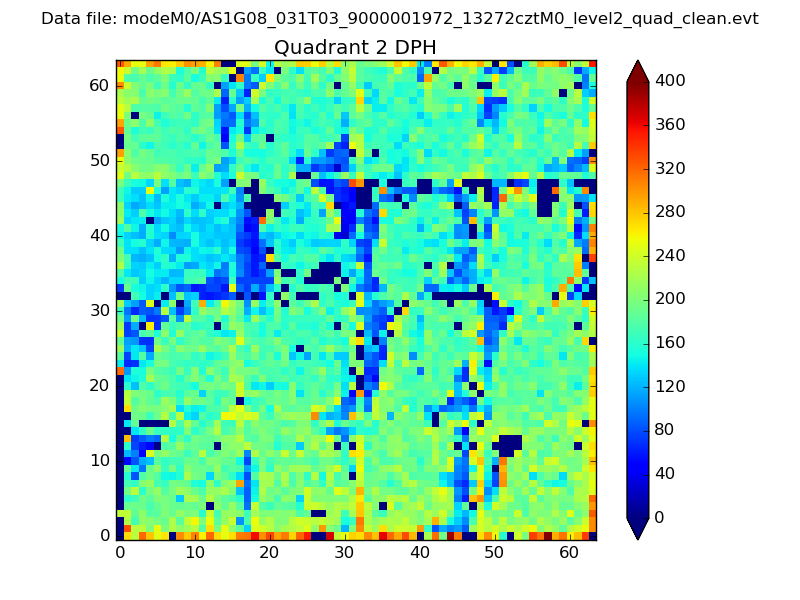 |
Quadrant C |
| Plot type | Count rate plots | Images |
|---|---|---|
| Comparison with Poisson distribution Blue bars denote a histogram of data divided into 1 sec bins. Red curve is a Poisson curve with rate = median count rate of data. |
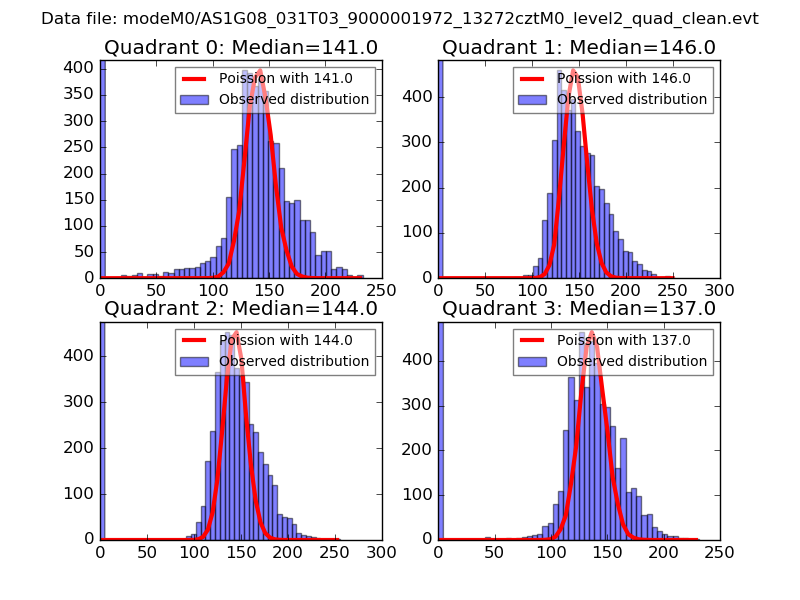 |
 |
| Quadrant-wise count rates Data is divided into 100 sec bins |
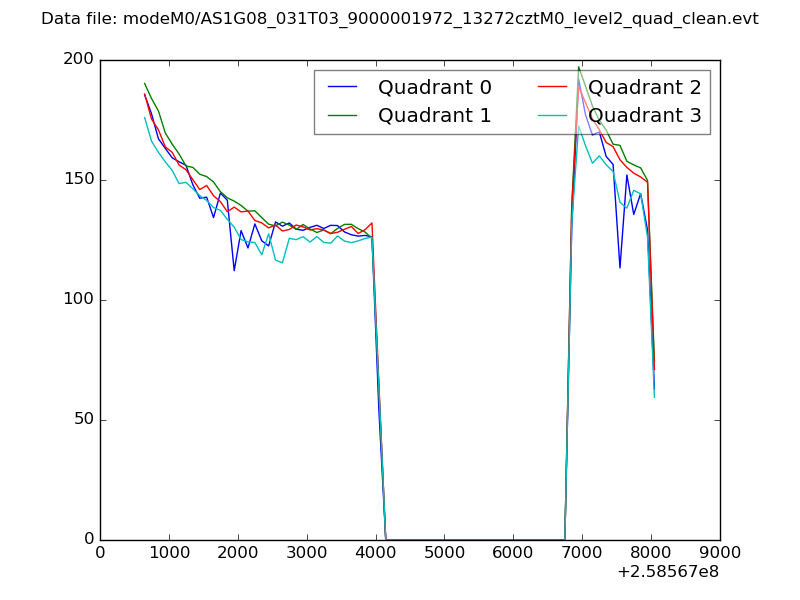 |
|
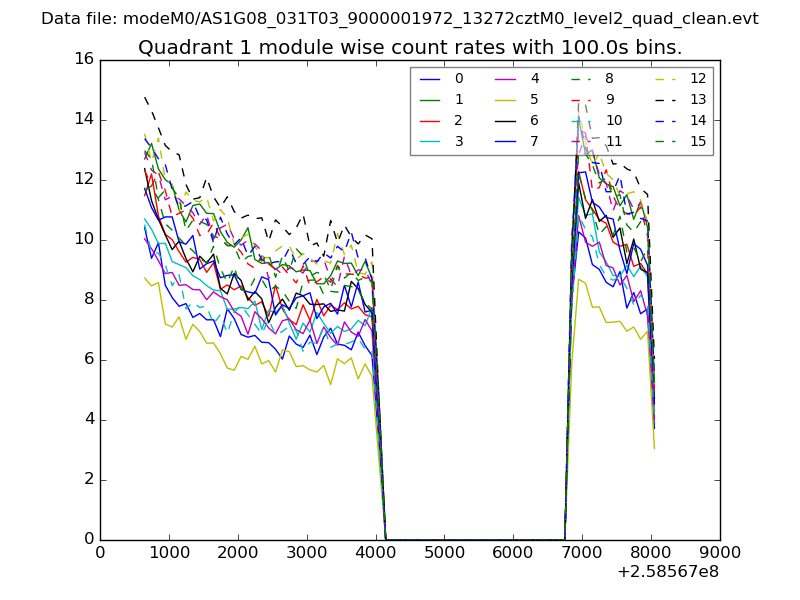
| Module-wise count rates for Quadrant A Data is divided into 100 sec bins |
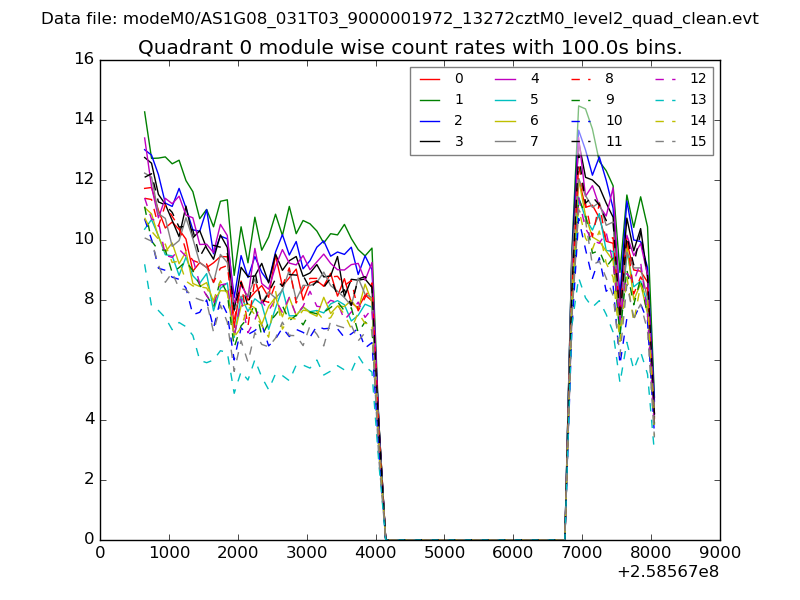 |
 |
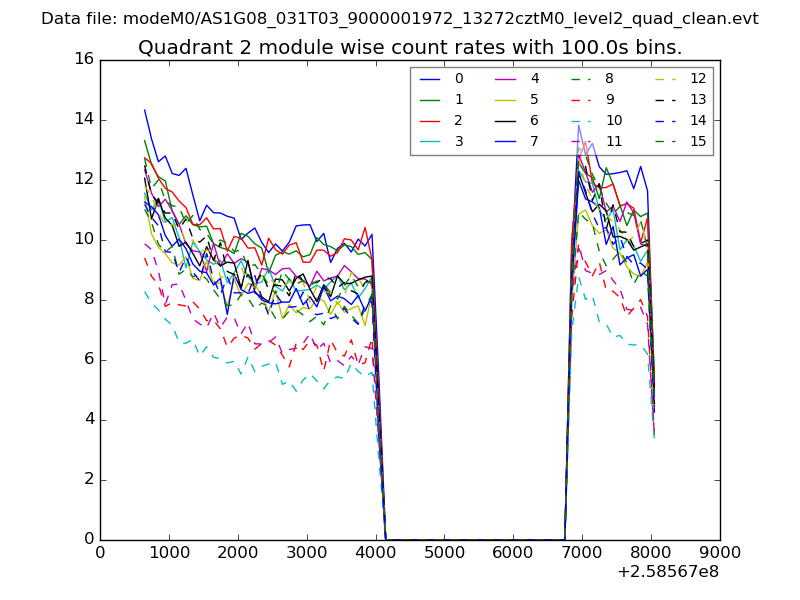
| Module-wise count rates for Quadrant B Data is divided into 100 sec bins |
 |
 |
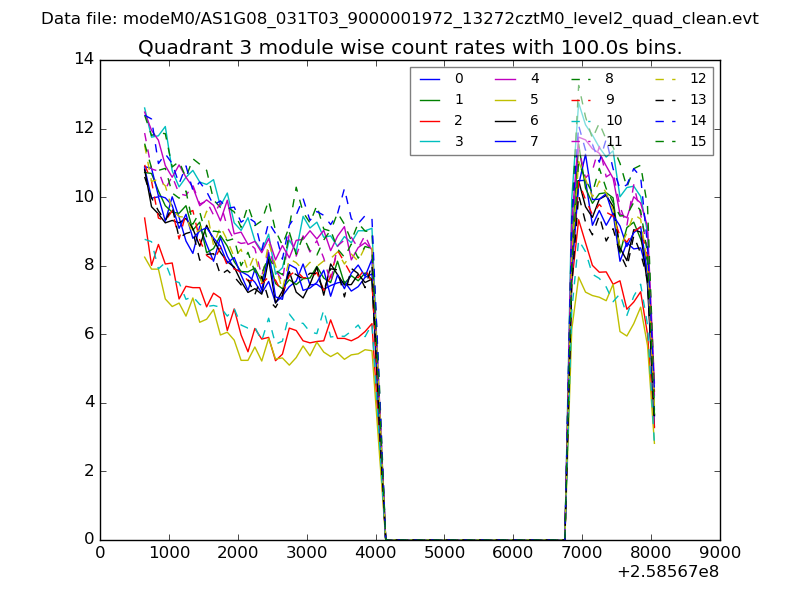
| Module-wise count rates for Quadrant C Data is divided into 100 sec bins |
 |
 |
| Module-wise count rates for Quadrant D Data is divided into 100 sec bins |
 |
 |
| Parameter | Plot |
|---|---|
| CZT HV Monitor | 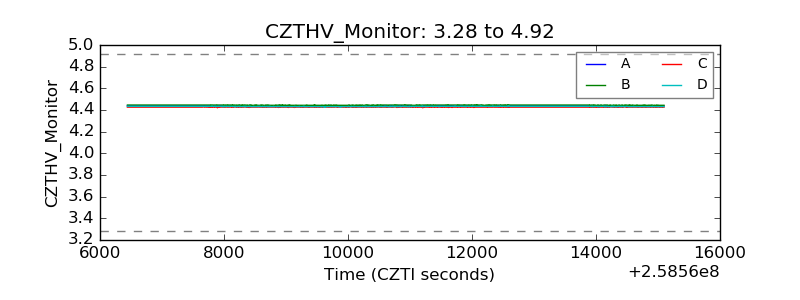 |
| D_VDD | 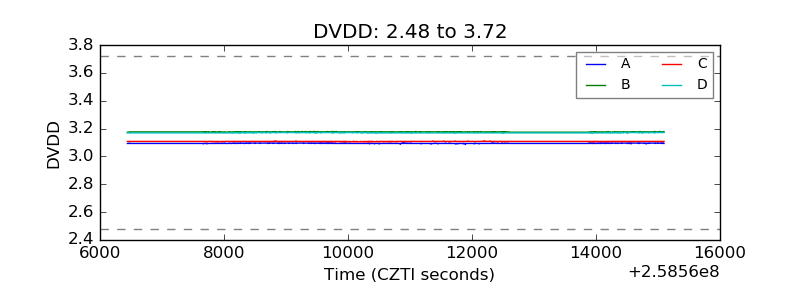 |
| Temperature 1 |  |
| Veto HV Monitor | 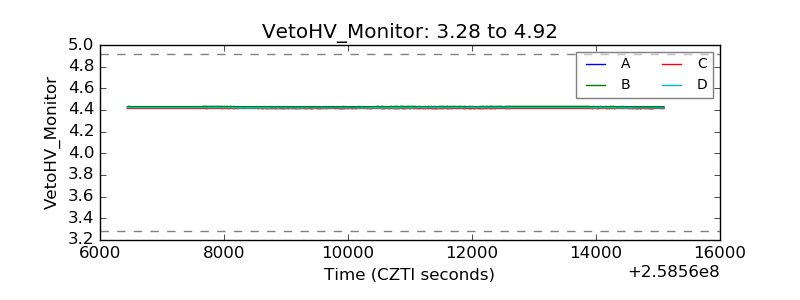 |
| Veto LLD | 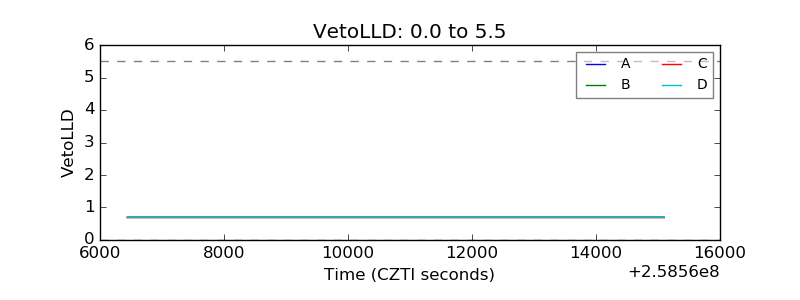 |
| Alpha Counter | 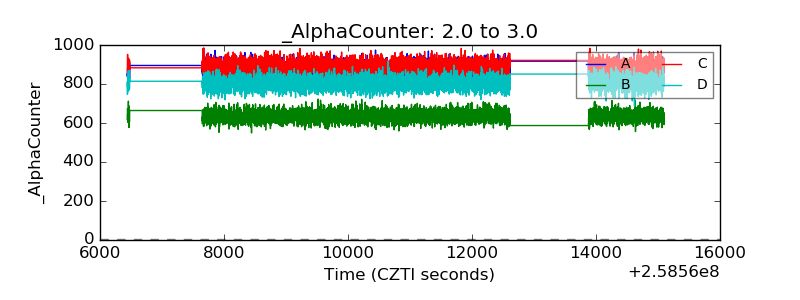 |
| _CPM_Rate | 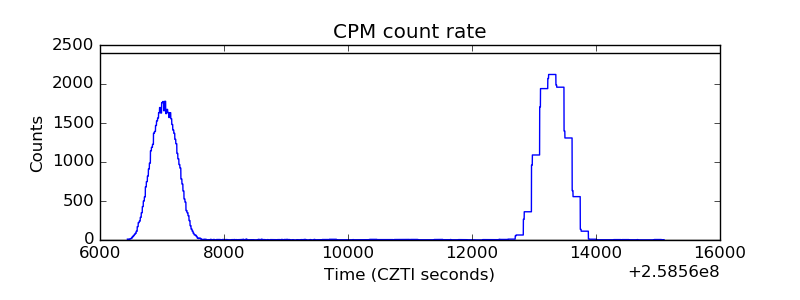 |
| CZT Counter |  |
| +2.5 Volts monitor |  |
| +5 Volts monitor |  |
| _ROLL_ROT | 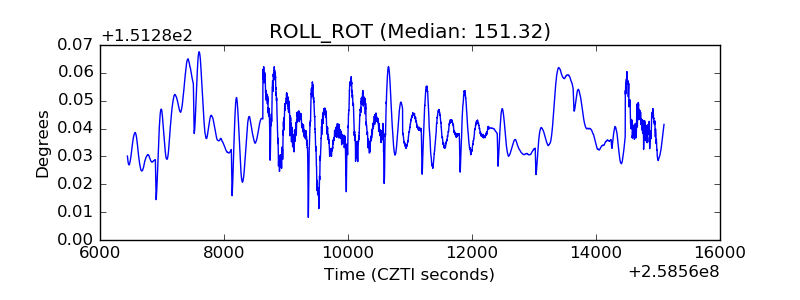 |
| _Roll_DEC | 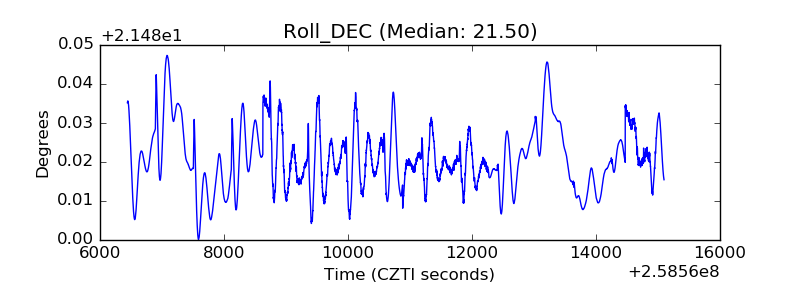 |
| _Roll_RA | 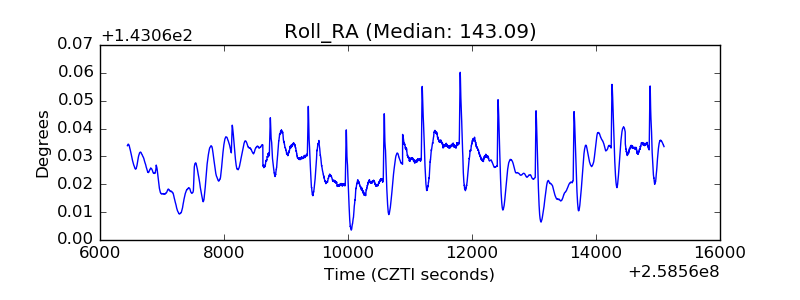 |
| Veto Counter | 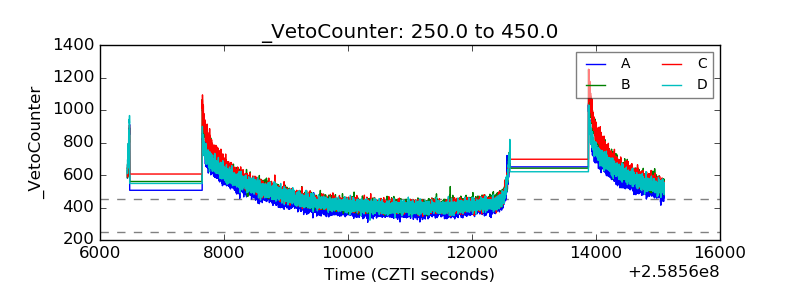 |