| Param | Original file | Final file |
|---|---|---|
| Filename | modeM0/AS1T02_013T01_9000001976cztM0_level2.fits | modeM0/AS1T02_013T01_9000001976cztM0_level2_quad_clean.evt |
| Size (bytes) | 705,683,520 | 618,166,080 |
| Size | 673.0 MB | 589.5 MB |
| Events in quadrant A | 4,612,750 | 4,179,107 |
| Events in quadrant B | 2,907,696 | 1,685,488 |
| Events in quadrant C | 4,556,220 | 4,018,373 |
| Events in quadrant D | 3,840,362 | 3,399,499 |
| Mode M9 | |||
|---|---|---|---|
| Quadrant | BADHDUFLAG | Total packets | Discarded packets |
| A | 0 | 125 | 0 |
| B | 0 | 125 | 0 |
| C | 0 | 125 | 0 |
| D | 0 | 125 | 0 |
| Mode SS | |||
|---|---|---|---|
| Quadrant | BADHDUFLAG | Total packets | Discarded packets |
| A | 0 | 1614 | 0 |
| B | 0 | 1614 | 0 |
| C | 0 | 1614 | 0 |
| D | 0 | 1614 | 0 |
| Mode M0 | |||
|---|---|---|---|
| Quadrant | BADHDUFLAG | Total packets | Discarded packets |
| A | 0 | 174647 | 0 |
| B | 0 | 308363 | 0 |
| C | 0 | 167018 | 0 |
| D | 0 | 232799 | 0 |
| Quadrant | Total seconds | Saturated seconds | Saturation percentage |
|---|---|---|---|
| A | 79305 | 1098 | 1.384528% |
| B | 79280 | 33044 | 41.680121% |
| C | 79305 | 752 | 0.948238% |
| D | 79305 | 4867 | 6.137066% |
Noise dominated data is calculated using 1-second bins in cleaned event files. If a bin has >2000 counts, and if more than 50% of those come from <1% of pixels, then it is considered to be noise-dominated and hence unusable.
| Quadrant | # 1 sec bins | Bins with >0 counts | Bins with >2000 counts | High rate bins dominated by noise | Noise dominated (total time) | Noise dominated (detector-on time) | Marked lightcurve |
|---|---|---|---|---|---|---|---|
| A | 91815 | 79305 | 0 | 0 | 0.00% | 0.00% | 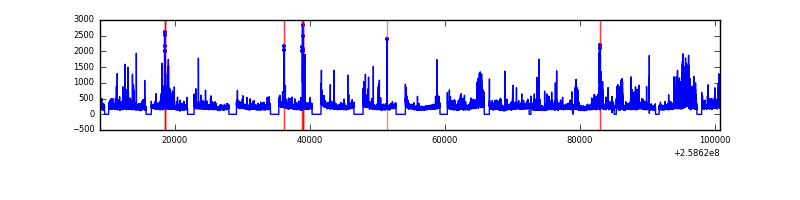 |
| B | 91815 | 64680 | 0 | 0 | 0.00% | 0.00% | 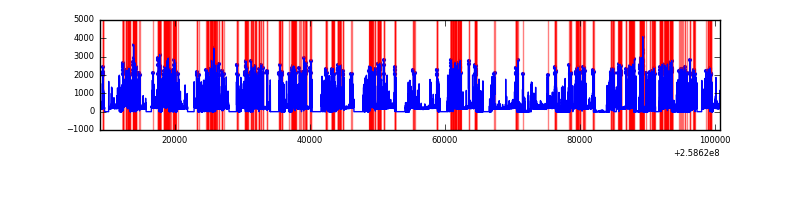 |
| C | 91815 | 79305 | 0 | 0 | 0.00% | 0.00% |  |
| D | 91815 | 79285 | 0 | 0 | 0.00% | 0.00% | 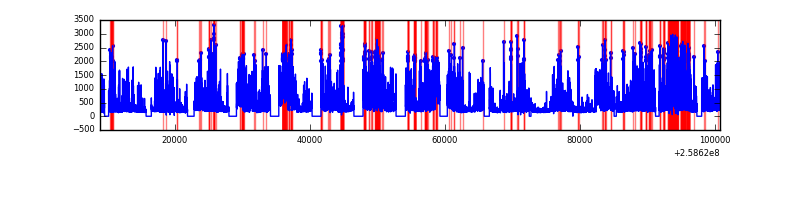 |
Top three noisy pixels from each quadrant. If the there are fewer than three noisy pixels in the level2.evt file, extra rows are filled as -1
| Pixel properties | Quadrant properties | ||||||
|---|---|---|---|---|---|---|---|
| Quadrant | DetID | PixID | Counts | Sigma | Mean | Median | Sigma |
| A | 0 | 29 | 4559 | 11.4 | 1199 | 1120 | 301.6 |
| A | 7 | 110 | 3806 | 8.91 | 1199 | 1120 | 301.6 |
| A | 0 | 30 | 3470 | 7.79 | 1199 | 1120 | 301.6 |
| B | 2 | 9 | 2473 | 11.23 | 767 | 729 | 155.3 |
| B | 3 | 17 | 2059 | 8.56 | 767 | 729 | 155.3 |
| B | 5 | 128 | 1924 | 7.69 | 767 | 729 | 155.3 |
| C | 12 | 241 | 3227 | 6.7 | 1203 | 1116 | 315.2 |
| C | 2 | 191 | 3147 | 6.44 | 1203 | 1116 | 315.2 |
| C | 7 | 111 | 3018 | 6.04 | 1203 | 1116 | 315.2 |
| D | 4 | 246 | 3042 | 6.9 | 1096 | 999 | 296.2 |
| D | 6 | 231 | 2822 | 6.16 | 1096 | 999 | 296.2 |
| D | 7 | 5 | 2691 | 5.71 | 1096 | 999 | 296.2 |
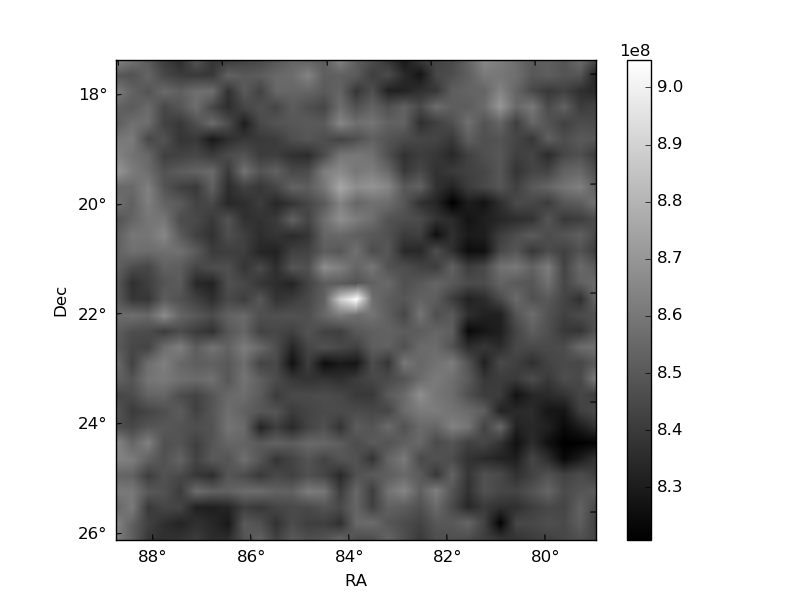
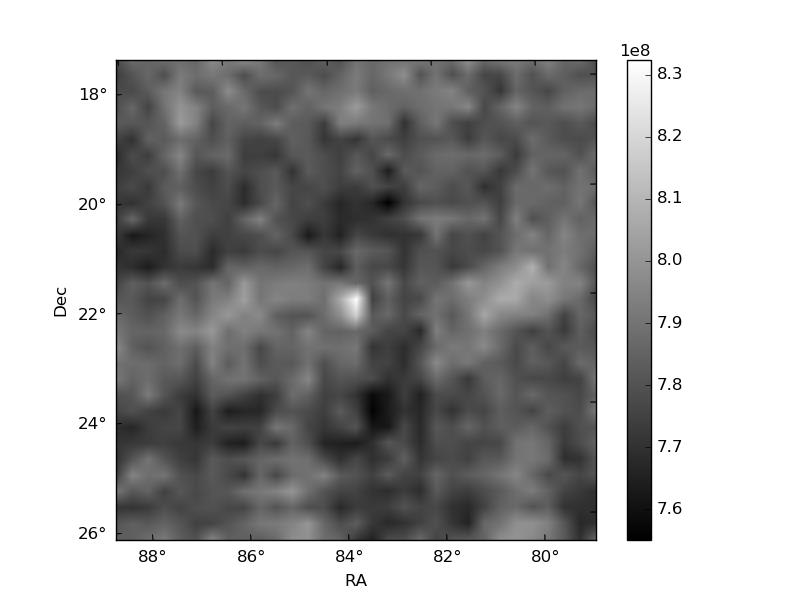
Histogram calculated using DETX and DETY for each event in the final _common_clean file
| Quadrant A |  |
 |
Quadrant B |
|---|---|---|---|
| Quadrant D | 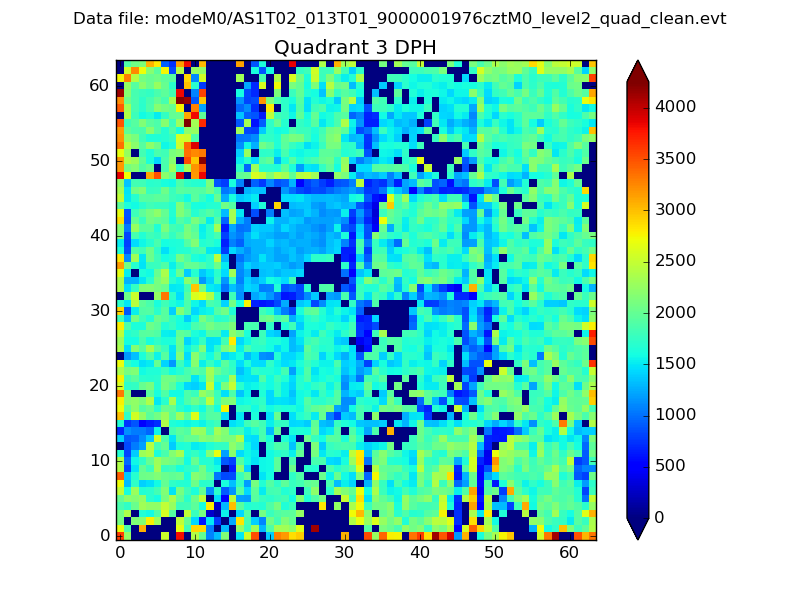 |
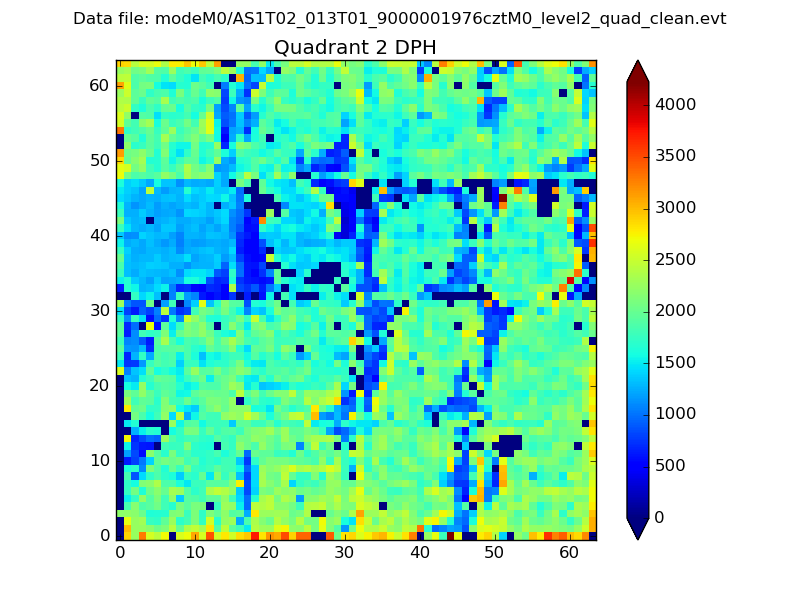 |
Quadrant C |
| Plot type | Count rate plots | Images |
|---|---|---|
| Comparison with Poisson distribution Blue bars denote a histogram of data divided into 1 sec bins. Red curve is a Poisson curve with rate = median count rate of data. |
 |
 |
| Quadrant-wise count rates Data is divided into 100 sec bins |
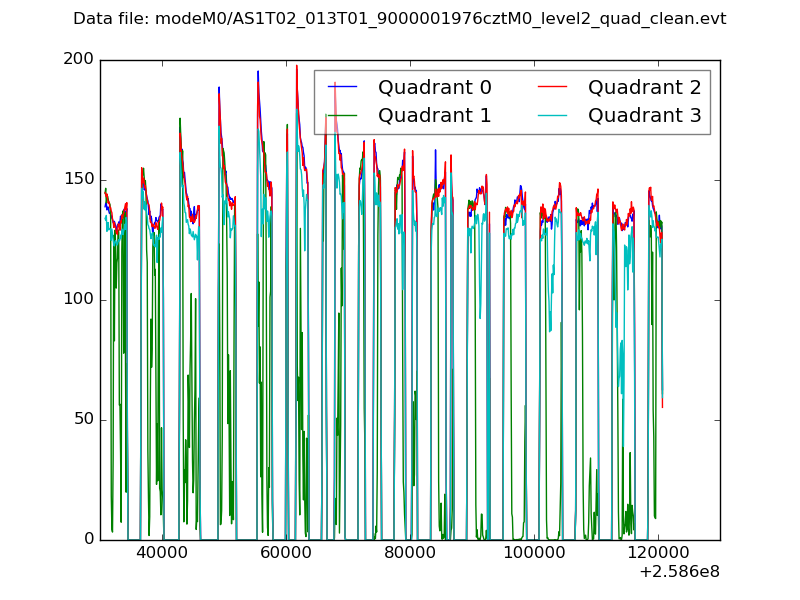 |
|
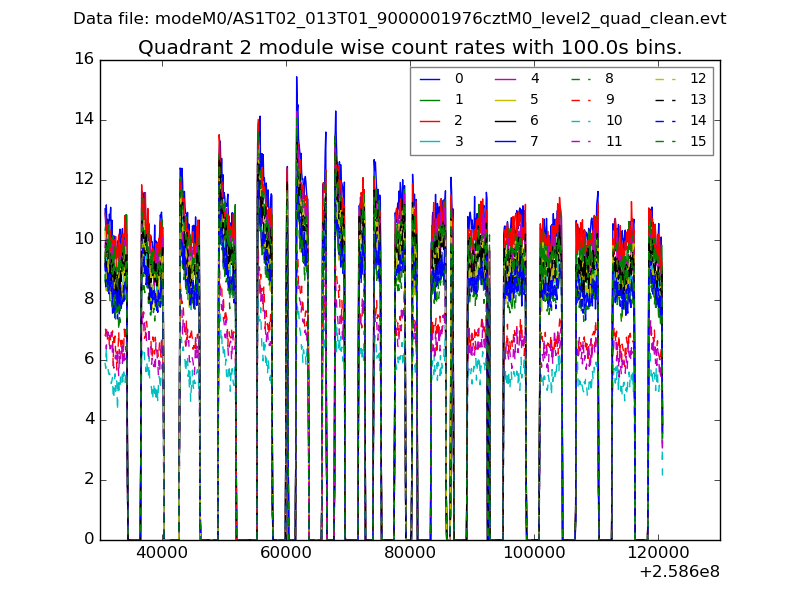
| Module-wise count rates for Quadrant A Data is divided into 100 sec bins |
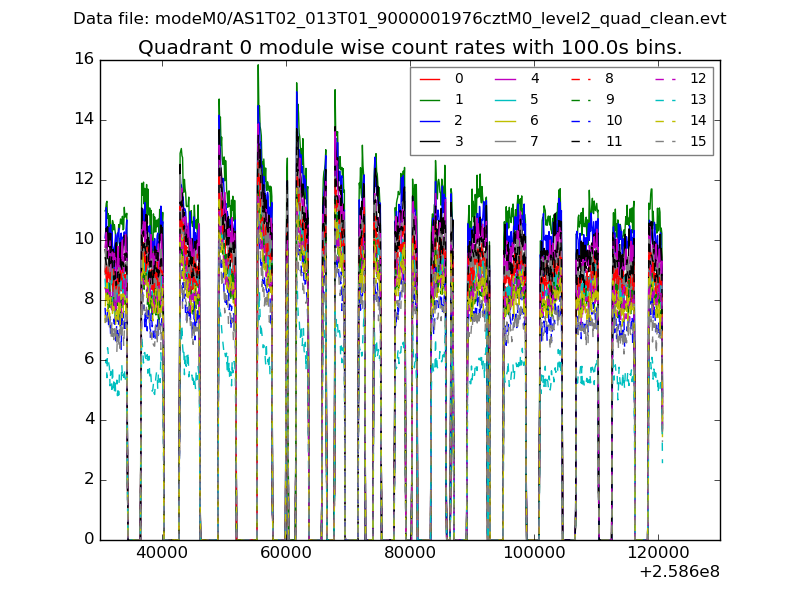 |
 |
| Module-wise count rates for Quadrant B Data is divided into 100 sec bins |
 |
 |
| Module-wise count rates for Quadrant C Data is divided into 100 sec bins |
 |
 |
| Module-wise count rates for Quadrant D Data is divided into 100 sec bins |
 |
 |
| Parameter | Plot |
|---|---|
| CZT HV Monitor |  |
| D_VDD |  |
| Temperature 1 | 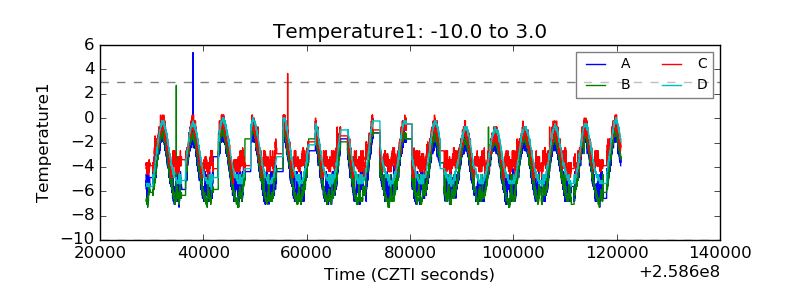 |
| Veto HV Monitor |  |
| Veto LLD | 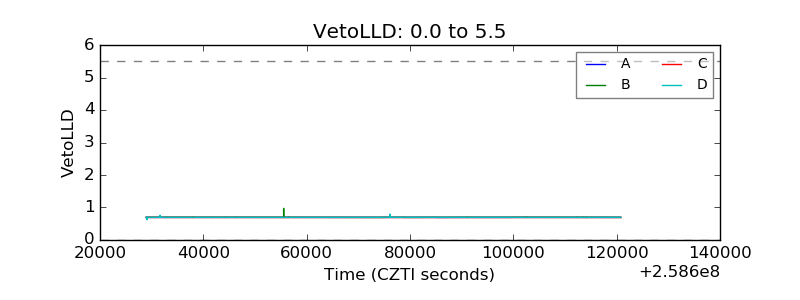 |
| Alpha Counter |  |
| _CPM_Rate |  |
| CZT Counter |  |
| +2.5 Volts monitor |  |
| +5 Volts monitor |  |
| _ROLL_ROT | 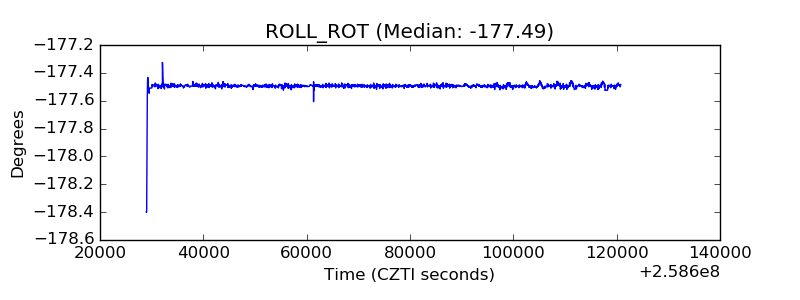 |
| _Roll_DEC |  |
| _Roll_RA | 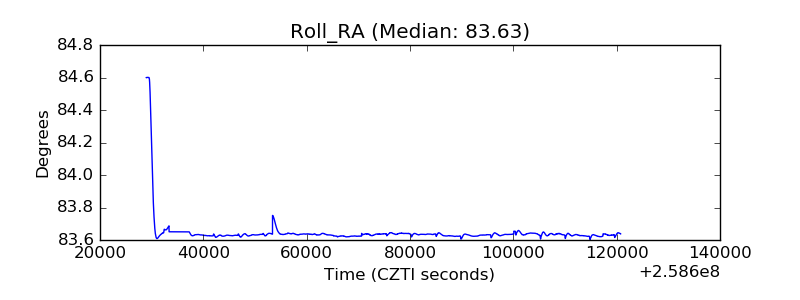 |
| Veto Counter |  |